Page 1 of 16
Identification of aberrantly methylated differentially expressed
genes targeted by differentially expressed miRNA in osteosarcoma
Ting-Xuan Wang
1#, Wen-Le Tan
2#, Jin-Cheng Huang
3#, Zhi-Fei Cui
1, Ri-Dong Liang
4, Qing-Chu Li
5,
Hai Lu
11Department of Orthopedics, The Fifth Affiliated Hospital of Sun Yat-sen University, Sun Yat-sen University, Zhuhai 519000, China; 2Department
of Orthopedics, Luoding People’s Hospital, Luoding 527200, China; 3Department of Orthopedics, Henan Provincial People’s Hospital, People’s
Hospital of Zhengzhou University, People’s Hospital of Henan University, Zhengzhou 450003, China; 4Department of Orthopedics, Southern
Medical University Affiliated Nanhai Hospital, Southern Medical University, Foshan 523800, China; 5Department of Orthopedics, The Third
Affiliated Hospital of Southern Medical University, Academy of Orthopedics, Southern Medical University, Guangzhou 510000, China
Contributions: (I) Conception and design: H Lu; (II) Administrative support: H Lu; (III) Provision of study materials or patients: H Lu, QC Li; (IV) Collection and assembly of data: TX Wang, WL Tan, JC Huang; (V) Data analysis and interpretation: TX Wang; (VII) Manuscript writing: All authors; (VII) Final approval of manuscript: All authors.
#These authors contributed equally to this work.
Correspondence to: Hai Lu, PhD. Department of Orthopedics, The Fifth Affiliated Hospital of Sun Yat-sen University, No. 52 East Meihua Road, Xiangzhou District, Zhuhai 519000, China. Email: [email protected]; Qing-chu Li, PhD. Department of Orthopedics, The Third Affiliated Hospital of Southern Medical University, No.183 West Zhongshan Avenue, Tianhe District, Guangzhou 510000, China. Email: [email protected].
Background: Osteosarcoma (OS) is the most common primary bone tumors diagnosed in children and
adolescents. Recent studies have shown a prognostic role of DNA methylation in various cancers, including OS. The aim of this study was to identify the aberrantly methylated genes that are prognostically relevant in OS.
Methods: The differentially expressed mRNAs, miRNAs and methylated genes (DEGs, DEMs and DMGs
respectively) were screened from various GEO databases, and the potential target genes of the DEMs were predicted by the RNA22 program. The protein-protein interaction (PPI) networks were constructed using the STRING database and visualized by Cytoscape software. The functional enrichment and survival analyses of the screened genes was performed using the R software.
Results: Forty-seven downregulated hypermethylated genes and three upregulated hypomethylated
genes were identified that were enriched in cell activation, migration and proliferation functions, and were involved in cancer-related pathways like JAK-STAT and PI3K-AKT. Eight downregulated hypermethylated tumor suppressor genes (TSGs) were identified among the screened genes based on the TSGene database. These hub genes are likely involved in OS genesis, progression and metastasis, and are potential prognostic biomarkers and therapeutic targets.
Conclusions: TSGs including PYCARD, STAT5A, CXCL12 and CXCL14 were aberrantly methylated in
OS, and are potential prognostic biomarkers and therapeutic targets. Our findings provide new insights into the role of methylation in OS progression.
Keywords: Osteosarcoma (OS); methylation; miRNA; tumor suppressor gene (TSG); bioinformatics
Submitted Nov 27, 2019. Accepted for publication Jan 18, 2020. doi: 10.21037/atm.2020.02.74
View this article at: http://dx.doi.org/10.21037/atm.2020.02.74
Introduction
Osteosarcoma (OS) is the most common primary malignant
bone tumors in children and young adults. It originates
from mesenchymal cells and is characterized by the
appearance of spindle cells and aberrant osteoid formation.
OS can occur in any bone, although the distal femur,
proximal tibia and the proximal humerus are the most
common sites, accounting for respectively 43%, 23% and
10% of the cases. Within the bone, OS typically affects the
metaphysis close to the growth plate (1). OS also has a high
metastasis rate of 20%, and commonly invades the lungs
and other bones (2).
Studies in recent years have shown that epigenetic
changes play an important role in tumorigenesis and
progression. DNA methylation involves addition of methyl
groups (-CH3) to cytosines in the CpG dinucleotides, and
both hypermethylation or hypomethylation can result in
long-term silencing of imprinted genes, transposons and
the inactive X chromosome (3). Aberrant methylation
is frequently observed in tumors, and silencing of the
promoter regions of tumor suppressor genes (TSGs) by
hypermethylation of CpG islands (4) affects the cell cycle
checkpoint, apoptosis, signal transduction, cell adhesion
and angiogenesis genes (5). MicroRNAs (miRNAs) are
short non-coding RNAs that regulate gene expression at
the post-translational level by binding to the 3'-UTR of
target mRNA, and are also aberrantly expressed in various
cancers (6). Abnormal DNA methylation patterns have been
detected in OS that interfere with the TSGs, and promote
tumor initiation and progression (7). Although the DNA
methylation patterns in OS have gained attention as vital
biomarkers and therapeutic targets, the regulatory network
between DNA methylation, miRNAs and target genes
remains elusive.
Previous studies have identified several differentially
methylated genes (DMGs) and differentially expressed
genes (DEGs) in OS through bioinformatics analysis (8).
However, the regulatory networks of OS-related miRNAs,
mRNAs and methylation patterns in OS are largely
unknown. To this end, we screened the mRNA, miRNA
and gene methylation profiles from OS and normal bone
microarray datasets, in order to identify the DEGs, DMGs,
TSGs and differentially expressed miRNAs (DEMs) related
to OS. The aim of our study was to identify and validate
the aberrantly methylated TSGs in OS. Our findings
provide new insights into the potential tumorigenic role
of abnormal DNA methylation, and identify potential
biomarkers and therapeutic targets for OS.
Methods
Identification of DEGs, DEMs and DMGs
The miRNA datasets GSE28423 and GSE65071, the
mRNA dataset GSE36001 and the methylation dataset
GSE36002 were downloaded from the GEO database
(https://www.ncbi.nlm.nih.gov/geo/). The GSE28423
was registered on the GPL8227 microarray platform
(Agilent-019118 Human miRNA Microarray 2.0 G4470B)
and contained data from 19 OS and 4 normal bone samples.
GSE65071 was registered on the microarray platform of
GPL19631 (Exiqon human V3 microRNA PCR panel I+II)
and included data of 20 OS and 15 normal bone samples.
GSE36001 and GSE36002 were from the GPL6102
microarray platform (Illumina human-6 v2.0 expression
beadchip), and included data of 19 OS cell lines and 6
normal osteoblasts and bones samples.
GEO2R was used to screen for the DEGs, DEMs and
DMGs from the respective datasets using |logFC| >1 or
log|β| >0.2 (for DMGs) and P value <0.05 as the thresholds.
The putative target genes of the overlapping DEMs of
GSE28423 and GSE65071 datasets were predicted using the
RNA22 tool (https://cm.jefferson.edu/rna22/Interactive/).
The expression matrix of the DEGs was analyzed by the
GSEA tool according to P values <0.05 and q values <0.05,
and the putative TSGs were identified from the TSGene
database (https://bioinfo.uth.edu/TSGene/download.
cgi). Finally, the Venn diagram tool (http://bioinformatics.
psb.ugent.be/webtools/Venn/) was used to determine (I)
overlapping hypomethylated mRNAs, up-regulated genes
and targets to identify the up-regulated hypomethylated
mRNAs; (II) overlapping hypermethylated mRNAs,
down-regulated mRNAs and targets for downregulated
hypermethylated mRNAs; (III) overlapping down-regulated
mRNAs, hypermethylated mRNAs, targets and TSGs to
identify the down-regulated hypermethylated TSGs.
Functional analyses of the relevant genes
Biological process (BP) enrichment analysis and Kyoto
Encyclopedia of Genes and Genomes (KEGG) analysis
were performed using the ClusterProfiler package of R
software, with P<0.05 as the threshold. Gene set enrichment
analysis (GSEA) was conducted using the GSEA desktop
tool. The Search Tool for the Retrieval of Interacting
Genes (STRING, https://string-db.org/) database was used
to construct the PPI networks, which were then visualized
using CYTOSCAPE.
Validation of TSGs
Analysis and Visualization Platform (http://r2.amc.nl).
The clinical data and the expression data were extracted
from a dataset, the Mixed Osteosarcoma–Kuijjer–127–vst–
ilmnhwg6v2. The patients were stratified into the respective
low- and high-expression groups using the R2 scan method.
The correlation between TSGs methylation and expression
was determined by Spearman’s rank correlation analysis,
with |Cor|>0.3 and P<0.05 as the thresholds.
Cell culture and treatment
The OS cell line MG63 was purchased from the American
Type Culture Collection (ATCC, Manassas, VA, USA), and
cultured in DMEM (Gibco, USA) supplemented with 10%
FBS under 5% CO
2at 37 ℃. The DNA methyltransferase
inhibitor 5-azacytidine (5-Aza) was purchased from
MedChemExpress. The MG63 cells were treated with
5 µM 5-Aza or DMSO (vehicle) for 48 h.
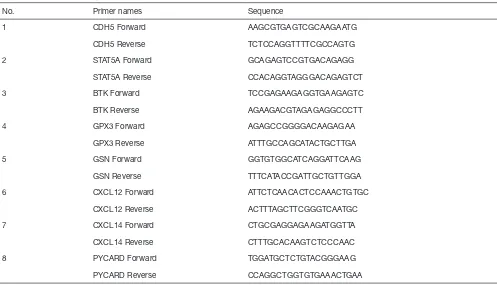
RNA isolation and quantitative RT-PCR
Total RNA was extracted from the cells using Total RNA
Extraction Reagent (Vazyme, China), and reverse transcribed
into cDNA using the HiScript II Q RT SuperMix (Vazyme,
China). RT-PCR was conducted using ChamQ SYBR qPCR
Master Mix (Vazyme, China) in a Lightcycler 96 (Roche,
Switzerland). The relative mRNA expression levels were
determined by the 2
-ΔΔCTmethod. All tests were performed
three times, and GAPDH was used as the internal control.
The primer sequences are shown in Table S1.
Cell proliferation assay
MG63 cells were seeded into a 96 well plate at the density of
3×10
3/well, and cultured with DMSO or 5-Aza for 24, 48, 72,
96 and 120 h. The medium was replaced with fresh medium
supplemented with 10 µL Cell Counting Kit-8 (CCK-8)
reagent/well (DOJINDO, Japan), and the cells were incubated
for another hour. The absorbance at 450nm was measured
using a microplate reader (Bio.Tek, USA), and the proliferation
rates were calculated after subtracting the background
absorbance. The experiment was performed thrice.
Wound-healing assay
MG63 cells were seeded into 6 well plates at 80% density and
treated with 5 µM 5-Aza or DMSO for 48 h. The monolayer
was scratched perpendicular to the plate with a sterile 200µl
pipette tip. The dislodged cells were removed by washing twice
with PBS, and serum-free medium was added. The cells were
cultured for 24 h, and the wound edges were photographed
at the same position at 0, 24 h under an inverted microscope.
The migration rate was determined based on the width of the
wound edges. The assay was performed in triplicate.
Invasion assay
In vitro invasion was analyzed using 24 well Invasion Chambers (8
µm pore size; Costar, Corning, USA). For the invasion assay, the
transwell chambers were pre-coated with 50 µL Matrigel (Corning,
USA) for 3 h. MG63 cells were seeded into the upper chambers
at the density of 1×10
4/100 µL in serum free medium, and the
lower chambers were filled with 500 µL DMEM supplemented
with 10% FBS. After incubating for 24 h, the cells were
washed twice with PBS and fixed with 4% paraformaldehyde
for 30 minutes at room temperature. The PET membranes
were air-dried and stained with 0.1% crystal violet for
15 minutes. The non-invaded cells were wiped off, and the
invaded cells were photographed and counted under an
inverted microscope in five random fields per membrane.
Both assays were performed in triplicate.
Statistical analyses
All statistical analyses were performed using GRAPHPAD
PRISM7 (GraphPad Prism Software Inc., San Diego,
CA, USA) or SPSS 23.0. Two groups were compared
using Student’s t-test with Welch correction in case of
significantly different variance, or multiple groups were
compared using one-way ANOVA analysis. P<0.05 was
considered statistically significant.
Results
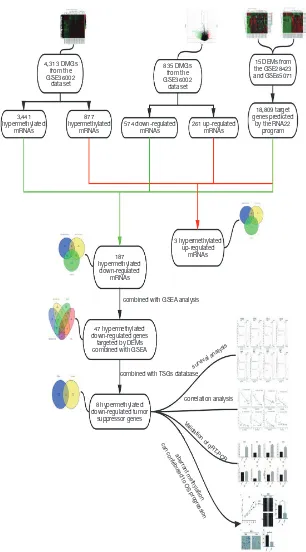
Identification of DEGs and DEMs in microarray
4,313 DMGs from the GSE36002
dataset
835 DMGs from the GSE36002
dataset
3,441 hypermethylated
mRNAs
187 hypermethylated
down-regulated mRNAs
47 hypermethylated down-regulated genes
targeted by DEMs combined with GSEA
8 hypermethylated down-regulated tumor
suppressor genes
combined with GSEA analysis
combined with TSGs database
correlation analysis
Validation of qR
T-PCR
aberrant methylation can contributed to OS pr
ogr ession
survival analysis
3 hypermethylated up-regulated
mRNAs 877
hypermethylated
mRNAs 574 down-regulated mRNAs 261 up-regulated mRNAs
18,809 target genes predicted
[image:4.595.143.449.83.635.2]by the RNA22 program 15 DEMs from the GSE28423 and GSE65071
A
C
D
B
−4 −2 0 2 color
−1·log10 (p value)
down no up
Type Tumor
Tumor Normal
Normal Type
Type Type
logFC 15
10
5
0
4
2
0
−2
−4 3
2 1 0 −1 −2 −3
2 1 0 −1 −2
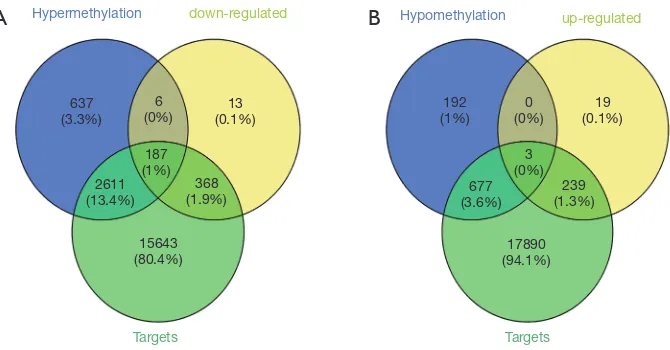
Figure 2 Identification of DEGs, DEMs and DMGs in OS. (A) Heatmap of 15 DEMs in GSE28423; (B) heatmap of 15 DEMs in GSE65071; (C) volcano plot showing DEG distribution in GSE36001; (D) heatmap of DMGs in GSE36002. The black area, green area and the red area represent the non-DEGs, down-regulated mRNAs, and up-regulated mRNAs, respectively. DEGs, differentially expressed genes; DEMs, differentially expressed miRNAs; DMGs, differentially methylated genes.
were hypomethylated.
Identification of aberrantly methylated DEGs targeted by
the DEMs
The RNA22 program predicted 18,809 target genes of
the 15 DEMs. The overlap between these targets, DEGs
and DMGs revealed 187 hypermethylated down-regulated
genes (Figure 3A) and only 3 hypomethylated up-regulated
genes (Figure 3B). The latter included BMP4, PYCR1 and
PRAME, which are involved in BP promoting cancers and
other diseases. We surmised therefore that BMP4, PYCR1
and PRAME were significant in OS progression. The
DEMs and 187 hypermethylated down-regulated genes are
respectively shown in Tables S3,S4.
Identification of hypermethylated down-regulated genes
targeted by DEMs combined with GSEA
To further identify the DEGs in OS, we conducted GSEA
based on the GSE36001 dataset. Ten KEGG gene sets
was significantly enriched in OS compared to normal
tissues, including a total of 539 mRNAs according to P
values <0.05 and q values <0.05 (Figure 4A). The most
significantly enriched KEGG gene set in OS was the
KEGG_SPLICEOSOME (Figure 4B), and its constituent
DEGs are visualized in Figure 4C. Other significant gene
sets included KEGG_CELL CYCLE and KEGG_DNA
REPLICATION (Figure S1). Overlapping of the 539
mRNAs of KEGG gene sets, DEGs, DMGs and 18,809
target genes of the 15 DEMs, revealed 47 hypermethylated
down-regulated genes (Figure 4D) that are likely involved in
OS. The list of 47 hypermethylated down-regulated genes
was shown in Table S5.
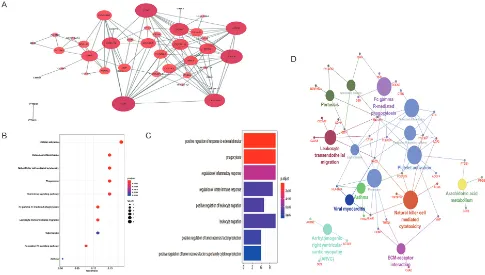
Functional enrichment analysis and PPI network
construction
Hypermethylation Hypomethylation
637 (3.3%)
6
(0%) (0.1%)13
192
(1%) (0%)0 (0.1%)19
239 (1.3%) 3 (0%) 677 (3.6%)
17890 (94.1%) 368
(1.9%) 187 (1%) 2611 (13.4%)
15643 (80.4%)
down-regulated up-regulated
Targets Targets
A
B
A
B
0.5 0.4 0.3 0.2 0.1 0.0
0.5 0.0 −0.5 −1.0
Enrichment PLOT: KEGG_SPLICEOSOME
'tumor' (positively correlated)
'normal' (negatively correlated)
Zero cross at 8264
Enrichment profile Hits Ranking metric scores 0 2,500 5,000 7,500 10.000 12,500 15,000
Rank in ordered dataset
Enrichment scor
e (ES)
Ranked list metric (Signal2Noise)
D
Hypermethylation GSEA 636
(3.3%) 5 (0%)
13 (0.1%)
306 (1.6%)
15292 (78.6%)
351 (1.8%)
1 (0%)
0 (0%) 62 (0.3%)
47 (0.2%) 140 (0.7%)
2535 (13%)
1 (0%) 76 (0.4%) (0%)1
down-regulated Targets
[image:6.595.131.466.82.257.2]C
Figure 3 Identification of aberrantly methylated DEGs. (A) A total of 193 hypermethylated down-regulated genes were identified, of which 187 genes were targets of DEMs; (B) three hypomethylated up-regulated genes targeted by DEMs were identified. DEGs, differentially expressed genes; DEMs, differentially expressed miRNAs.
[image:6.595.49.543.322.607.2]Figure 5 Functional analysis and PPI network of the hypermethylated regulated genes. (A) PPI network of 47 hypermethylated down-regulated genes visualized by the Cytoscape software. The size of the dots and the gradation of color indicate the strength of interaction; (B) bubble chart shows the significant pathways. The color depth indicates statistical significance, Y-axis represents the KEGG pathway, X-axis represents the proportion of enriched genes, and the size of the points indicates the number of genes; (C) bar graph showing the significantly enriched biological processes in the DEGs. The color depth indicates statistical significance, the Y-axis shows the GO-BP terms and X-axis represents the proportion of enriched genes; (D) clue GO analysis results. The large points and small points represent the significant KEGG pathways the enriched genes, respectively. PPI, protein−protein interaction; KEGG, Kyoto Encyclopedia of Genes and Genomes; DEGs, differentially expressed genes; GO, gene ontology; BP, biological process.
Furthermore, KEGG pathway enrichment analysis showed
that most genes were enriched in platelet activation
(hsa04611), osteoclast differentiation (hsa04380), natural
killer cell mediated cytotoxicity (hsa04650), phagosome
(hsa04145), and chemokine signaling pathway (hsa04062).
The top 10 significant pathways for the screened genes are
shown in Figure 5B, indicating that the DEGs are likely
involved in some osteoclast differentiation pathways and
several cancer-related pathways, such as the JAK-STAT
and PI3K-Akt. Furthermore, the clue GO analysis showed
that MAPK13 and FCGR2A were significantly enriched in
more pathways compared to the other DEGs (Figure 5D).
The PPI network further showed 40 nodes with strong
correlations and 2 nodes with weak correlations (Figure 5A),
indicating complex interactions between the downregulated
and hypermethylated mRNAs at the protein level.
Function analysis and PPI network construction of
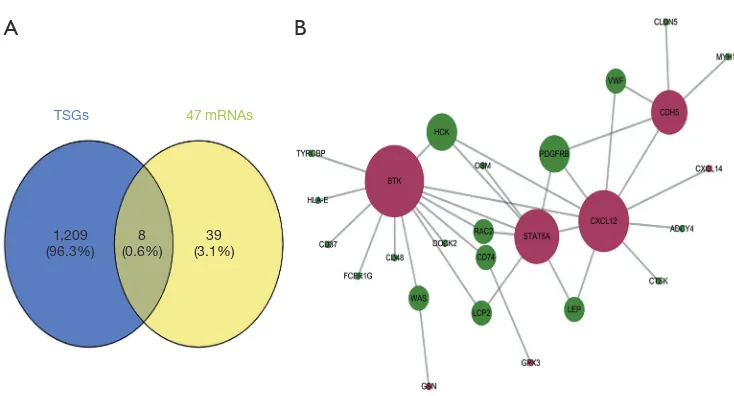
aberrantly methylated TSGs involved in OS
TSGs 47 mRNAs
1,209
(96.3%) (0.6%)8 (3.1%)39
[image:8.595.112.479.77.275.2]A
B
Figure 6 Identification of TSGs. (A) Venn diagram showing the aberrantly methylated DEGs in the TSGs database. The overlapping area includes 8 hypermethylated down-regulated TSGs; (B) hub genes highlighted in the PPI network of hypermethylated down-regulated genes. The 7 key genes are highlighted and shown as the hub genes in the network. Red region and green region indicate TSGs, and non-TSGs, respectively. DEGs, differentially expressed genes; non-TSGs, tumor suppressor genes; PPI, protein−protein interaction.
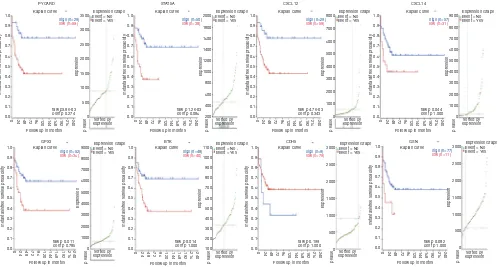
(Table 1), and pathway enrichment analysis indicated
that they were significantly enriched in the NF-kappa
B signaling pathway, chemokine signaling pathway and
viral carcinogenesis (Table 2). Therefore, these aberrantly
methylated TSGs are likely involved in OS progression, and
are potential biomarkers.
Prognostic assessment of the down-regulated
hypermethylated TSGs in OS
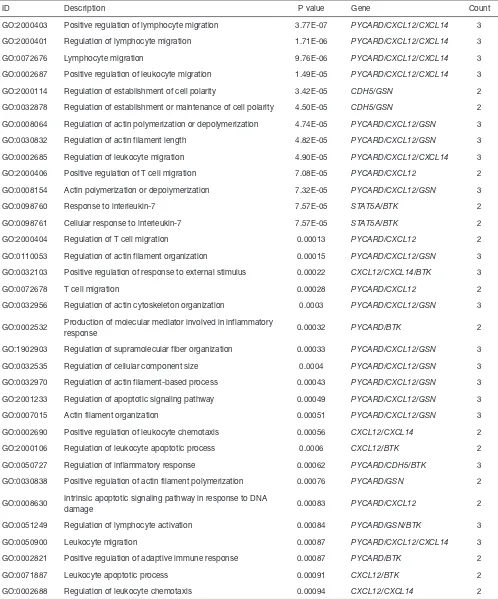
To determine the prognostic value of the above 8 TSGs
in OS, we assessed the metastasis free survival of patients
from the dataset, Mixed OS (Mesenchymal)–Kuijjer–127–
vst–ilmnhwg6v2, after stratifying them into the respective
low- and high-expressing groups. Patients expressing low
levels of BTK, GPX3, CXCL12, CXCX14, PYCARD and
STAT5A had worse metastasis free survival compared to the
corresponding high expression groups (Figure 7), indicating
that these genes have a significant impact on patient
prognosis.
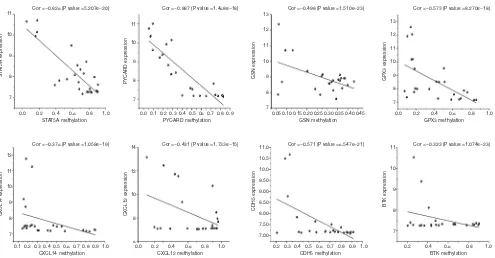
Correlation between methylation and gene expression
Correlation analysis of the gene expression and DNA
methylation data revealed a significant inverse correlation
between DNA methylation and the respective gene expression
levels (Figure 8). The methylation sites and correlation
coefficient of the significant TSGs are shown in Table 3. The
most significant effect of DNA methylation was seen on the
expression levels of STAT5A and PYCARD (Cor =−0.826, P
value =5.207e-20; Cor =−0.887, P value =1.468e-18).
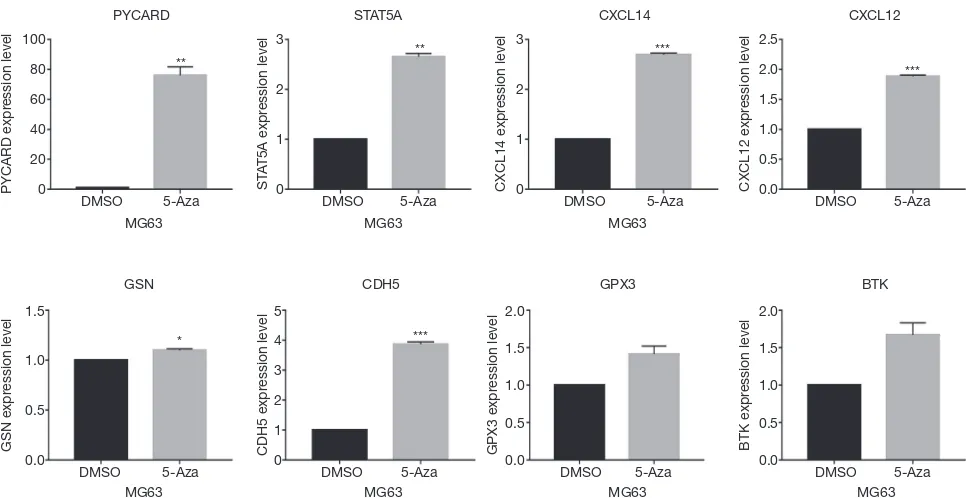
Inhibition of DNA methylation can upregulate the key
genes
To further validate the impact of methylation on the
expression of the TSGs, we treated MG63 cells with
the methyltransferase inhibitor 5-Aza, and examined the
expression levels of the relevant genes. As shown in Figure 9,
PYCARD, STAT5A, CDH5, CXCL12 and CXCL14
mRNA levels were significantly increased after 5-Aza
treatment, thereby confirming the in silico data. In contrast,
BTK and GPX3 expression was not significantly affected by
inhibiting DNA methylation.
Aberrant methylation contributed to OS progression
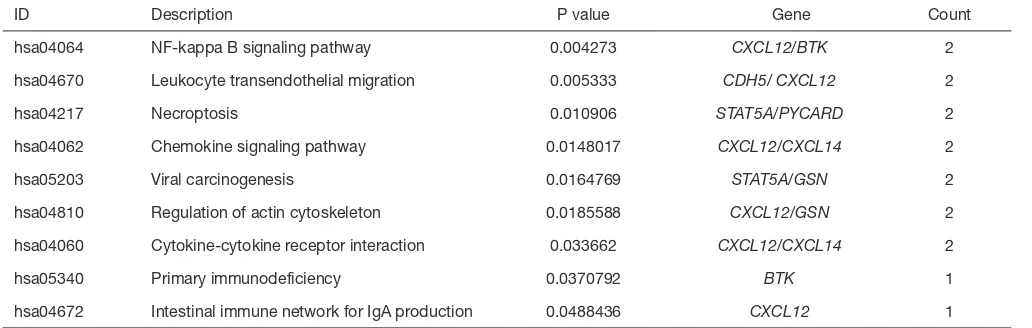
Table 1 Significant biological processes in which the 8 hub genes were mainly involved
ID Description P value Gene Count
GO:2000403 Positive regulation of lymphocyte migration 3.77E-07 PYCARD/CXCL12/CXCL14 3
GO:2000401 Regulation of lymphocyte migration 1.71E-06 PYCARD/CXCL12/CXCL14 3
GO:0072676 Lymphocyte migration 9.76E-06 PYCARD/CXCL12/CXCL14 3
GO:0002687 Positive regulation of leukocyte migration 1.49E-05 PYCARD/CXCL12/CXCL14 3
GO:2000114 Regulation of establishment of cell polarity 3.42E-05 CDH5/GSN 2
GO:0032878 Regulation of establishment or maintenance of cell polarity 4.50E-05 CDH5/GSN 2
GO:0008064 Regulation of actin polymerization or depolymerization 4.74E-05 PYCARD/CXCL12/GSN 3
GO:0030832 Regulation of actin filament length 4.82E-05 PYCARD/CXCL12/GSN 3
GO:0002685 Regulation of leukocyte migration 4.90E-05 PYCARD/CXCL12/CXCL14 3
GO:2000406 Positive regulation of T cell migration 7.08E-05 PYCARD/CXCL12 2
GO:0008154 Actin polymerization or depolymerization 7.32E-05 PYCARD/CXCL12/GSN 3
GO:0098760 Response to interleukin-7 7.57E-05 STAT5A/BTK 2
GO:0098761 Cellular response to interleukin-7 7.57E-05 STAT5A/BTK 2
GO:2000404 Regulation of T cell migration 0.00013 PYCARD/CXCL12 2
GO:0110053 Regulation of actin filament organization 0.00015 PYCARD/CXCL12/GSN 3
GO:0032103 Positive regulation of response to external stimulus 0.00022 CXCL12/CXCL14/BTK 3
GO:0072678 T cell migration 0.00028 PYCARD/CXCL12 2
GO:0032956 Regulation of actin cytoskeleton organization 0.0003 PYCARD/CXCL12/GSN 3
GO:0002532 Production of molecular mediator involved in inflammatory
response 0.00032 PYCARD/BTK 2
GO:1902903 Regulation of supramolecular fiber organization 0.00033 PYCARD/CXCL12/GSN 3
GO:0032535 Regulation of cellular component size 0.0004 PYCARD/CXCL12/GSN 3
GO:0032970 Regulation of actin filament-based process 0.00043 PYCARD/CXCL12/GSN 3
GO:2001233 Regulation of apoptotic signaling pathway 0.00049 PYCARD/CXCL12/GSN 3
GO:0007015 Actin filament organization 0.00051 PYCARD/CXCL12/GSN 3
GO:0002690 Positive regulation of leukocyte chemotaxis 0.00056 CXCL12/CXCL14 2
GO:2000106 Regulation of leukocyte apoptotic process 0.0006 CXCL12/BTK 2
GO:0050727 Regulation of inflammatory response 0.00062 PYCARD/CDH5/BTK 3
GO:0030838 Positive regulation of actin filament polymerization 0.00076 PYCARD/GSN 2
GO:0008630 Intrinsic apoptotic signaling pathway in response to DNA
damage 0.00083 PYCARD/CXCL12 2
GO:0051249 Regulation of lymphocyte activation 0.00084 PYCARD/GSN/BTK 3
GO:0050900 Leukocyte migration 0.00087 PYCARD/CXCL12/CXCL14 3
GO:0002821 Positive regulation of adaptive immune response 0.00087 PYCARD/BTK 2
GO:0071887 Leukocyte apoptotic process 0.00091 CXCL12/BTK 2
GO:0002688 Regulation of leukocyte chemotaxis 0.00094 CXCL12/CXCL14 2
Table 1 (continued)
ID Description P value Gene Count
GO:0015696 Ammonium transport 0.00094 CXCL12/BTK 2
GO:0090066 Regulation of anatomical structure size 0.00098 PYCARD/CXCL12/GSN 3
GO:0001938 Positive regulation of endothelial cell proliferation 0.00099 STAT5A/CXCL12 2
GO, Gene Ontology; PYCARD, PYD and CARD domain containing; STAT5A, signal transducer and activator of transcription 5A; CDH5, Cadherin 5; CXCL12, C-X-C Motif Chemokine Ligand 12; CXCL14, C-X-C Motif Chemokine Ligand 14; GSN, Gelsolin; BTK, Bruton tyrosine kinase; GPX3, glutathione peroxidase 3.
Table 2 Significant KEGG pathways in which the 8 hub genes were mainly involved.
ID Description P value Gene Count
hsa04064 NF-kappa B signaling pathway 0.004273 CXCL12/BTK 2
hsa04670 Leukocyte transendothelial migration 0.005333 CDH5/ CXCL12 2
hsa04217 Necroptosis 0.010906 STAT5A/PYCARD 2
hsa04062 Chemokine signaling pathway 0.0148017 CXCL12/CXCL14 2
hsa05203 Viral carcinogenesis 0.0164769 STAT5A/GSN 2
hsa04810 Regulation of actin cytoskeleton 0.0185588 CXCL12/GSN 2
hsa04060 Cytokine-cytokine receptor interaction 0.033662 CXCL12/CXCL14 2
hsa05340 Primary immunodeficiency 0.0370792 BTK 1
hsa04672 Intestinal immune network for IgA production 0.0488436 CXCL12 1
KEGG, Kyoto Encyclopedia of Genes and Genomes; PYCARD, PYD And CARD Domain Containing; STAT5A, Signal Transducer And Activator Of Transcription 5A; CDH5, Cadherin 5; CXCL12, C-X-C Motif Chemokine Ligand 12; CXCL14, C-X-C Motif Chemokine Ligand 14; GSN, Gelsolin; BTK, Bruton Tyrosine Kinase; GPX3, Glutathione Peroxidase 3.
markedly diminished their migration (Figure 10B) and
invasion capacities (Figure 10C) compared to the DMSO
controls. Taken together, aberrant DNA methylation
is conducive to OS progression, and inhibiting DNA
methyltransferases can decrease proliferation, migration
and invasion of OS cells.
Discussion
OS is a primary bone malignancy with a high rate
of recurrence. Despite advancements in surgery and
chemotherapy, the overall survival rates have been dismal
over the past 20 years (9). Aberrant DNA methylation is an
epigenetic modification that is frequently observed in most
cancers, and is a major risk factor that drives tumorigenesis
via gene silencing (7). Since epigenetic modifications affect
gene functions without altering the DNA sequence, they
result in more diverse gene expression profiles (10). Novel
molecular biology techniques and bioinformatics integration
analysis in recent years have enabled identification of
aberrant methylation patterns in various cancers, and
provided insights into the underlying mechanisms.
We identified 187 hypermethylated genes and 3
hypomethylated genes in OS based on mRNA, miRNA and
methylation datasets, along with 15 DEMs that are relevant
in OS and other cancers except has-miR-331-5p (11). The
142-5p (12), 338-3p (13) and
hsa-miR-542-5p were in particular strongly associated with OS, and
can help identify the key genes involved in OS progression.
[image:10.595.44.560.241.405.2]Figure 7 Prognostic relevance of hypermethylated TSGs in OS. Kaplan-Meier survival analysis of 8 hub genes were conducted by R2: Genomics Analysis and Visualization Platform (http://r2.amc.nl). The differences were tested using the log-rank test. P values are demonstrated in the lower right corner of each image and the numbers of samples with high expression and low expression are displayed in the higher right corner of each image. TSGs, tumor suppressor genes; Bonf p: Adjusted P value for multiple comparisons (Bonferroni method); Raw P: raw P value.
likely oncogenic. PYCR1 catalyzes NAD(P)H-dependent
conversion of pyrroline-5-carboxylate to proline during
cell proliferation and metabolism, and is up-regulated
in a wide range of cancers. Overexpression of PYCR1
contributes to poor prognosis in prostate cancer (16), and
based on our results, may have a pro-tumorigenic role
in OS. PRAME is overexpressed in melanoma, myeloid
leukemia, neuroblastoma (17), and head and neck cancer,
and its hypomethylated form promotes the progression
of chronic myeloid leukemia (18). In OS as well, PRAME
overexpression is associated with poor prognosis, and
increases tumor cell proliferation by attenuating cell cycle
arrest (19). Taken together, these genes likely promote OS
progression, although the underlying mechanisms need to
be elucidated. Furthermore, they are potential prognostic
biomarkers and therapeutic targets in OS.
Forty-seven hypermethylated down-regulated genes in
OS were enriched in functions like response to external
stimulus, cell migration and cell proliferation, chemotaxis
and inflammatory response, all of which contribute to tumor
metastasis (20). Aberrant migration and proliferation is an
important cellular program in tumors, and are mediated
by dysregulated signaling pathways (21). KEGG analysis
revealed that the OS-related hypermethylated genes were
significantly associated with the PI3K-Akt and JAT-STAT
pathways. The former is the most frequently mutated
network in human cancers, and is also dysregulated in tumors
due to methylation (22). It promotes cancer cell survival by
inhibiting pro-apoptotic and activating anti-apoptotic genes,
Furthermore, the downstream mTOR kinase also promotes
cell growth and protein synthesis, and downregulates this
pathway through a feedback loop. Constitutive activation
of the PI3K-Akt pathway is often accompanied by loss
or mutations in the tumor suppressor PTEN (23). It also
plays a critical role in OS genesis by inhibiting apoptosis
and activating pro-survival pathways (24). The JAK/STAT
pathway is also dysregulated in many solid tumors and
increases tumor cell proliferation and angiogenesis, resulting
in worse prognosis (25). Tyrosine phosphorylation and
nuclear localization of the STATs have been observed in the
1.0 0.9 0.8 0.7 0.6 0.5 0.4 0.3 0.2 0.1 0.0 1.0 0.9 0.8 0.7 0.6 0.5 0.4 0.3 0.2 0.1 0.0 1.0 0.9 0.8 0.7 0.6 0.5 0.4 0.3 0.2 0.1 0.0 1.0 0.9 0.8 0.7 0.6 0.5 0.4 0.3 0.2 0.1 0.0 1.0 0.9 0.8 0.7 0.6 0.5 0.4 0.3 0.2 0.1 0.0 1.0 0.9 0.8 0.7 0.6 0.5 0.4 0.3 0.2 0.1 0.0 1.0 0.9 0.8 0.7 0.6 0.5 0.4 0.3 0.2 0.1 0.0 1.0 0.9 0.8 0.7 0.6 0.5 0.4 0.3 0.2 0.1 0.0 3500 3000 2500 2000 1500 1000 500 0 9000 8000 7000 6000 5000 4000 3000 2000 1000 0 1100 1000 900 800 700 600 500 400 300 200 100 3000 2500 2000 1500 1000 500 0 3000 2500 2000 1500 1000 500 0 2000 1800 1600 1400 1200 1000 800 600 400 200 8000 7000 6000 5000 4000 3000 2000 1000 0 9000 8000 7000 6000 5000 4000 3000 2000 1000 0 PYCARD
GPX3 BTK CDH5 GSN
STAT5A CXCL12 CXCL14
Kaplan curve
Kaplan curve Kaplan curve Kaplan curve Kaplan curve
Kaplan curve Kaplan curve Kaplan curve
Expression Graph Expression Graph
Expression Graph Expression Graph
Expression Graph Expression Graph
Expression Graph Expression Graph
Event = No Event = No Event = No Event = No
high (n=29) Event = Yes high (n=50) Event = Yes high (n=29) Event = Yes high (n=57) Event = Yes
low (n=59) low (n=38) low (n=59) low (n=31)
Expr ession Expr ession Expr ession Expr ession Expr ession Expr ession Expr ession Expr ession
raw p3.8e-03 raw p 1.2e-03 raw p 4.7e-03 raw p 0.044
bonf p 0.274 bonf p 0.086 bonf p 0.343 bonf p 1.000
sorted by expression sorted by expression sorted by expression sorted by expression sorted by expression sorted by expression sorted by expression sorted by expression
p value p value p value
p value p value
p value
p value
p value
Follow up in months Follow up in months Follow up in months
Follow up in months Follow up in months Follow up in months Follow up in months
Follow up in months
0 0 0
0 0 0 0
0
24 24 24
24 24 24 24
24
48 48 48
48 48 48 48
48
72 72 72
72 72 72 72
72
96 96 96
96 96 96 96
96
120 120 120
120 120 120 120
120
144 144 144
144 144 144 144
144
168 168 168
168 168 168 168
168
192 192 192
192 192 192 192
192
216 216 216
216 216 216 216
216
240 240 240
240 240 240 240
240
metastasisfr
ee survival pr
obability
metastasisfr
ee survival pr
obability
metastasisfr
ee survival pr
obability
metastasisfr
ee survival pr
obability
metastasisfr
ee survival pr
obability
metastasisfr
ee survival pr
obability
metastasisfr
ee survival pr
obability
metastasisfr
ee survival pr
obability
Event = No high (n=52) Event = Yes
low (n=36)
Event = No high (n=48) Event = Yes
low (n=40)
Event = No high (n=9) Event = Yes
low (n=79)
Event = No high (n=77) Event = Yes
low (n=11)
raw p 0.082 raw p 0.199
raw p 0.014 raw p 0.011
bonf p 1.000 bonf p 1.000
11
10
9
8
7
12
11
10
9
8
7
14
12
10
8
6
11.0
10.5
10.0
9.50
9.00
8.50
8.00
7.50
7.00
11
10
9
8
7 11
10
9
8
7
13
12
11
10
9
8
7
13
12
11
10
9
8
7
ST
AT5A expr
ession
CXCL14 expr
ession
CXCL12 expr
ession
CDH5 expr
ession
BTK expr
ession
PYCARD expr
ession
GSN expr
ession
GPX3 expr
ession
Cor =−0.826 (P value =5.207e−20)
0.0 0.2 0.4 0.6 0.8 1.0 0.0 0.1 0.2 0.3 0.4 0.5 06 0.7 0.8 0.9 0.05 0.10 0.15 0.20 0.25 0.30 0.35 0.40 0.45 0.0 0.2 0.4 0.6 0.8 1.0
0.1 0.2 0.3 0.4 0.5 0.6 0.7 0.8 0.9 1.0 0.0 0.2 0.4 0.6 0.8 1.0 0.2 0.3 0.4 0.5 0.6 0.7 0.8 0.9 1.0 0.2 0.4 0.6 0.8 1.0
STAT5A methylation PYCARD methylation GSN methylation GPX3 methylation
CXCL14 methylation CXCL12 methylation CDH5 methylation BTK methylation
Cor =−0.376 (P value =1.058e−19)
Cor =−0.887 (P value =1.468e−18)
Cor =−0.431 (P value =1.733e−15)
Cor =−0.498 (P value =1.510e−23)
Cor =−0.571 (P value =6.547e−21)
Cor =−0.573 (P value =8.270e−18)
[image:12.595.52.547.79.337.2]Cor =−0.323 (P value =1.074e−23)
Figure 8 The correlation between methylation values and expression values of 8 hub genes. Higher correlation coefficient indicates stronger association between gene expression and methylation. Cor, correlation coefficient.
Table 3 The methylation sites and correlation coefficient of The TSGs.
Gene symbol Methylation site Correlation P value
PYCARD cg09587549 −0.997 1.468e-18
STAT5A cg03001305 −0.826 5.207e-20
CDH5 cg22319147 −0.571 6.547e-21
CXCL12 cg18618334 −0.431 1.733e-15
CXCL14 cg18995088 −0.376 1.058e-19
GSN cg17071957 −0.498 1.510e-23
GPX3 cg17820459 −0.573 8.270e-18
BTK cg03791917 −0.323 1.074e-23
TSGs, tumor suppressor genes; PYCARD, PYD And CARD Domain Containing; STAT5A, Signal Transducer And Activator Of Transcription 5A; CDH5, Cadherin 5; CXCL12, C-X-C Motif Chemokine Ligand 12; CXCL14, C-X-C Motif Chemokine Ligand 14; GSN, Gelsolin; BTK, Bruton Tyrosine Kinase; GPX3, Glutathione Peroxidase 3.
tumor tissues across a range of cancers, indicating that JAK/
SAT activation correlates with worse prognosis. We next
established a clue GO network of the hypermethylated genes
and these pathways, and observed significant enrichment of
MAPK13 and FCGR2A. The latter is an IgG receptor, and
methylation of its promoter decreases binding affinity to the
human IgG2, which is associated with higher susceptibility
to Kawasaki Disease (26). The p38 MAP kinase MAPK13
is aberrantly expressed in several tumors, and its promoter
methylation contributes to melanoma progression (27).
However, the role of MAPK13 and FCGR2A in OS remains
to be elucidated.
[image:12.595.44.553.404.554.2]Figure 9 Expression levels of the key genes with 5-Aza treatment in MG63 cells. Error bars represent SEM, ***, P<0.001; **, P<0.01; *, P<0.05. 5-Aza, 5-azacytidine.
Figure 10 Aberrant methylation contributed to OS progression. (A) After 5-Aza treatment, the proliferation of MG63 cells were significantly decreased; the Wound-healing assay (B) and Transwell Migration Assay (C) evaluated that the migration and invasion of MG63 cells were significantly decreased after 5-Aza treatment compared to those of the control group. 0.1% crystal violet, scale bar, 100 or 200 µm, error bars represent SEM; ***, P<0.001; **, P<0.01; *, P<0.05. 5-Aza, 5-azacytidine.
4
3
2
1
0
0.8
0.6
0.4
0.2
0.0
80
60
40
20
0 0 h
24 h
OD value
MG63
MG63
MG63
MG63
MG63
***
** 0 1 2 3 4 5 6
days **
** * *
*
DMSO
DMSO
DMSO
DMSO
invasive cells perfield
DMSO
W
ound healing per
centage
5-Aza
5-Aza
5-Aza
5-Aza
5-Aza
A
C
B
100
80
60
40
20
0
3
2
1
0
3
2
1
0
2.5
2.0
1.5
1.0
0.5
0.0
2.0
1.5
1.0
0.5
0.0 2.0
1.5
1.0
0.5
0.0 1.5
1.0
0.5
0.0
5
4
3
2
1
0
DMSO DMSO DMSO DMSO
DMSO DMSO
DMSO DMSO
5-Aza 5-Aza 5-Aza 5-Aza
5-Aza 5-Aza
5-Aza 5-Aza
MG63 MG63 MG63
MG63 MG63 MG63 MG63
** ***
***
*** *
PYCARD expr
ession level
GSN expr
ession level
CDH5 expr
ession level
GPX3 expr
ession level
BTK expr
ession level
ST
AT5A expr
ession level
CXCL14 expr
ession level
CXCL12 expr
ession level
PYCARD
GSN
STAT5A
CDH5
CXCL14
GPX3
CXCL12
[image:13.595.84.511.389.631.2]STAT5A and GSN. PYCARD is a signaling factor consisting
of a PYD and CARD domain, and mediates the apoptotic
pathway by activating caspases (28). Studies show that
hypermethylation-mediated silencing of PYCARD enables
tumor cell survival by blocking apoptosis (29). We showed
a strong correlation between PYCARD hypermethylation
and down-regulation in OS, and verified that its low
expression levels indicated worse prognosis based on
clinical data. Furthermore, 5-Aza treatment markedly
upregulated PYCARD, which strongly suggests that the
aberrant methylation of PYCARD drives OS genesis.
CXCL12 is a chemokine of the intercrine family, and
binds with CXCR4 to initiate divergent pathways related
to chemotaxis and cell survival (30). High expression levels
of CXCL12 is associated with poor prognosis in ovarian
cancer (31), and increased migration and invasiveness of
adamantinomatous craniopharyngiomas (32). In contrast,
down-regulation of CXCL12 have also been detected in OS
via promoter hypermethylation by DNA methyltransferase 1
(DNMT1) (33). According to our findings, low expression
and hypermethylation of CXCL12 indicates worse prognosis
in OS, which make it a potential therapeutic target. CXCL14
is another chemokine involved in immunoregulatory and
inflammatory processes (34), as well as tumor migration and
invasion. It inhibited colorectal cancer cell migration by
suppressing NF-kB signaling, whereas
hypermethylation-mediated silencing promoted migration (35). BTK is a
component of the Toll-like receptors (TLR) pathway, and
promotes inflammatory responses (36). In addition, it is a
modulator of p53 that can be induced in response to DNA
damage and p53 activation, and phosphorylates the latter to
enhance apoptosis (37). We found that low expression levels
of BTK due to hypermethylation was associated with poor
prognosis in OS.
CDH5 belongs to the cadherin superfamily, and is
involved in the vasculogenic mimicry of glioblastoma
stem-like cells under hypoxic conditions (38). Low expression levels
of CDH5 mediated by promoter methylation was strongly
associated with poor overall survival in neuroblastomas (39).
In agreement with this, CDH5 was expressed at low levels
in OS tissues compared to normal samples, and predicted
poor prognosis. STAT5A is a transcription factor that is
frequently dysregulated in cancer. Methylation-dependent
promoter region silencing of STAT5A inhibited
NPM1-ALK expression in NPM1-ALK + TCL cell lines (40). One study
reported low levels of STAT5A in OS and correlated it with
increased tumor progression and worse overall survival (41).
Consistent with this, the hypermethylation status of STAT5A
was strongly associated with its low expression levels as well
as poor prognosis in our study. Interestingly, BTK, CXCL12,
CDH5 and STAT5A showed strong functional connectivity
at the protein level, although the molecular mechanisms
remain to be elucidated.
GPX3 is a glutathione peroxidase that protects cells
against ROS and DNA damage, and is an established
tumor suppressor in various cancers (42). Gene silencing
of GPX3 by promoter hypermethylation has been reported
in hepatocellular carcinoma (43), and similar trends were
observed in the OS samples as well. GSN is an
actin-binding protein that regulates actin filament formation
and disassembly, as well as apoptosis via DNase I binding
and release (44). GSN downregulation via promoter
methylation predicts poor survival in gastric cancer (45),
whereas overexpression of GSN promoted growth and
invasion of OS cells (46). This contradicts our findings that
hypermethylation and down regulation of GSN likely drive
OS progression.
To summarize, we identified several TSGs that were
hypermethylated and downregulated in the OS tissues,
indicating a strong relationship between DNA methylation
and tumorigenesis. Although our findings have to be
validated in experimental studies and the underlying
mechanisms also need to be elucidated, we can conclude
that the aforementioned genes are significantly involved in
OS progression, and are potential prognostic markers and/
or therapeutic targets. There are however several limitations
in this study. Since the CpG sites information was not
available, the significance of specific methylation sites of
these hub genes could not be determined. Furthermore,
we did not correlate the expression data with the clinical
parameters in the same datasets. Further studies are needed
to validate the role of these TSGs in OS.
Conclusions
We identified 47 hypermethylated down-regulated mRNAs
targeted by significant miRNAs in OS, of which 8 are
established tumor suppressors. The aberrantly methylated
TSGs may be the potential prognostic biomarkers and
therapeutic targets for OS. Our findings provide new
insights into the role of methylation in OS progression.
Acknowledgments
Funding: This study was supported by grants from the
National Natural Science Foundation of China (Grant
number 81572628, 81372869), The Science and Technology
Project of Guangzhou (Grant No. 201704020033) and
The Science and Technology Project of Tianhe District,
Guangzhou (Grant No. 201604KW012).
Footnote
Conflicts of Interest: All authors have completed the ICMJE
uniform disclosure form and declare: the authors have no
conflicts of interest to declare.
Ethical Statement: The authors are accountable for all
aspects of the work in ensuring that questions related
to the accuracy or integrity of any part of the work are
appropriately investigated and resolved.
Open Access Statement: This is an Open Access article
distributed in accordance with the Creative Commons
Attribution-NonCommercial-NoDerivs 4.0 International
License (CC BY-NC-ND 4.0), which permits the
non-commercial replication and distribution of the article with
the strict proviso that no changes or edits are made and the
original work is properly cited (including links to both the
formal publication through the relevant DOI and the license).
See: https://creativecommons.org/licenses/by-nc-nd/4.0/.
References
1. Gill J, Ahluwalia MK, Geller D, et al. New targets and approaches in osteosarcoma. Pharmacol Ther 2013;137:89-99.
2. Yan GN, Lv YF, Guo QN. Advances in osteosarcoma stem cell research and opportunities for novel therapeutic targets. Cancer Lett 2016;370:268-74.
3. Wu SC, Zhang Y. Active DNA demethylation: many roads lead to Rome. Nat Rev Mol Cell Biol 2010;11:607-20. 4. Cui J, Wang W, Li Z, et al. Epigenetic changes in
osteosarcoma. Bull Cancer 2011;98:E62-8. 5. Suzuki H, Maruyama R, Yamamoto E, et al. DNA
methylation and microRNA dysregulation in cancer. MOL ONCOL 2012;6:567-78.
6. Zhuang M, Qiu X, Cheng D, et al. MicroRNA-524 promotes cell proliferation by down-regulating PTEN expression in osteosarcoma. Cancer Cell Int 2018;18:114. 7. Li X, Lu H, Fan G, et al. A novel interplay between
HOTAIR and DNA methylation in osteosarcoma cells
indicates a new therapeutic strategy. J Cancer Res Clin Oncol 2017;143:2189-200.
8. Kresse SH, Rydbeck H, Skårn M, et al. Integrative analysis reveals relationships of genetic and epigenetic alterations in osteosarcoma. PLoS One 2012;7:e48262.
9. O'Day K, Gorlick R. Novel therapeutic agents for osteosarcoma. Expert Rev Anticancer Ther 2009;9:511-23. 10. Moore LD, Le T, Fan G. DNA Methylation and Its Basic
Function. Neuropsychopharmacology 2013;38:23-38. 11. Xie B, Ding Q, Han H, et al. miRCancer: a
microRNA-cancer association database constructed by text mining onliterature. Bioinformatics 2013;29:638-44.
12. Jones KB, Salah Z, Del Mare S, et al. miRNA Signatures Associate with Pathogenesis and Progression of
Osteosarcoma. Cancer Res 2012;72:1865-77. 13. Cao R, Shao J, Hu Y, et al. microRNA-338-3p
inhibits proliferation, migration, invasion, and EMT inosteosarcoma cells by targeting activator of 90 kDa heat shock protein ATPasehomolog 1. Cancer Cell Int 2018;18:49.
14. Gustafson B, Hammarstedt A, Hedjazifar S, et al. BMP4 and BMP Antagonists Regulate Human White and Beige Adipogenesis. Diabetes 2015;64:1670-81.
15. Ivanova T, Zouridis H, Wu Y, et al. Integrated
epigenomics identifies BMP4 as a modulator of cisplatin sensitivity in gastric cancer. Gut 2013;62:22-33.
16. Zeng T, Zhu L, Liao M, et al. Knockdown of PYCR1 inhibits cell proliferation and colony formation via cell cycle arrest and apoptosis in prostate cancer. Med Oncol 2017;34:27.
17. Oberthuer A, Hero B, Spitz R, et al. The tumor-associated antigen PRAME is universally expressed in high-stage neuroblastoma and associated with poor outcome. Clin Cancer Res 2004;10:4307-13.
18. Roman-Gomez J, Jimenez-Velasco A, Agirre X, et al. Epigenetic regulation of PRAME gene in chronic myeloid leukemia. Leuk Res 2007;31:1521-8.
19. Tan P, Zou C, Yong B, et al. Expression and prognostic relevance of PRAME in primary osteosarcoma. Biochem Biophys Res Commun 2012;419:801-8.
20. Lu H, Ouyang W, Huang C. Inflammation, a key event in cancer development. Mol Cancer Res 2006;4:221-33. 21. Zhou N, Si Z, Li T, et al. Long non-coding RNA CCAT2
functions as an oncogene in hepatocellular carcinoma, regulating cellular proliferation, migration and apoptosis. Oncol Lett 2016;12:132-8.
prostate cancer radioresistance. Crit Rev Oncol Hematol 2015;96:507-17.
23. Stemke-Hale K, Gonzalez-Angulo AM, Lluch A, et al. Integrative genomic and proteomic analysis of PIK3CA, PTEN, and AKT mutations in breast cancer. Cancer Res 2008;68:6084-91.
24. Zhang J, Yu XH, Yan YG, et al. PI3K/Akt signaling in osteosarcoma. Clin Chim Acta 2015;444:182-92.
25. Lai SY, Johnson FM. Defining the role of the JAK-STAT pathway in head and neck and thoracic malignancies: Implications for future therapeutic approaches. Drug Resist Updat 2010;13:67-78.
26. Kuo HC, Hsu YW, Wu MS, et al. FCGR2A Promoter Methylation and Risks for Intravenous Immunoglobulin Treatment Responses in Kawasaki Disease. Mediators Inflamm 2015;2015:564625.
27. Gao L, Smit MA, van den Oord JJ, et al. Genome-wide promoter methylation analysis identifies epigenetic silencing of MAPK13 in primary cutaneous melanoma. Pigment Cell Melanoma Res 2013;26:542-54.
28. McConnell BB, Vertino PM. Activation of a caspase-9-mediated apoptotic pathway by subcellular redistribution of the novel caspase recruitment domain protein TMS1. Cancer Res 2000;60:6243-7.
29. Conway KE, McConnell BB, Bowring CE, et al. TMS1, a novel proapoptotic caspase recruitment domain protein, is a target of methylation-induced gene silencing in human breast cancers. Cancer Res 2000;60:6236-42.
30. Teicher BA, Fricker SP. CXCL12 (SDF-1)/CXCR4 Pathway in Cancer. CLIN Cancer Res 2010;16:2927-31. 31. Guo Q, Gao BL, Zhang XJ, et al. CXCL12-CXCR4
Axis Promotes Proliferation, Migration, Invasion, and Metastasis of Ovarian Cancer. Oncol Res 2014;22:247-58. 32. Yin X, Liu Z, Zhu P, et al. CXCL12/CXCR4 promotes
proliferation, migration, and invasion of adamantinomatous craniopharyngiomas via PI3K/AKT signal pathway. J Cell Biochem 2019;120:9724-36.
33. Li B, Wang Z, Wu H, et al. Epigenetic Regulation of CXCL12 Plays a Critical Role in Mediating Tumor Progression and the Immune Response In Osteosarcoma. Cancer Res 2018;78:3938-53.
34. Schwarze SR, Luo J, Isaacs WB, et al. Modulation of CXCL14 (BRAK) expression in prostate cancer. Prostate 2005;64:67-74.
35. Cao B, Yang Y, Pan Y, et al. Epigenetic Silencing of CXCL14 Induced Colorectal Cancer Migration and Invasion. Discov Med 2013;16:137-47.
36. Liu X, Zhan Z, Li D, et al. Intracellular MHC class II molecules promote TLR-triggered innate immune responses by maintaining activation of the kinase Btk. Nat Immunol 2011;12:416-24.
37. Althubiti M, Rada M, Samuel J, et al. BTK Modulates p53 Activity to Enhance Apoptotic and Senescent Responses. Cancer Res 2016;76:5405-14.
38. Mao XG, Xue XY, Wang L, et al. CDH5 is specifically activated in glioblastoma stemlike cells and contributes to vasculogenic mimicry induced by hypoxia. Neuro Oncol 2013;15:865-79.
39. Fujita T, Igarashi J, Okawa ER, et al. CHD5, a tumor suppressor gene deleted from 1p36.31 in neuroblastomas. J Natl Cancer Inst 2008;100:940-9.
40. Zhang Q, Wang H, Liu X, et al. STAT5A is epigenetically silenced by the tyrosine kinase NPM1-ALK and acts as a tumor suppressor by reciprocally inhibiting NPM1-ALK expression. NAT MED 2007;13:1341-8.
41. Guo Z, Tang Y, Fu Y, et al. Decreased expression of STAT5A predicts poor prognosis in osteosarcoma. PATHOL RES PRACT 2019;215:519-24.
42. Barrett CW, Ning W, Chen X, et al. Tumor suppressor function of the plasma glutathione peroxidase gpx3 in colitis-associated carcinoma. Cancer Res 2013;73:1245-55. 43. Cao S, Yan B, Lu Y, et al. Methylation of promoter and
expression silencing of GPX3 gene in hepatocellular carcinoma tissue. Clin Res Hepatol Gastroenterol 2015;39:198-204.
44. Yeh YL, Hu WS, Ting WJ, et al. Hypoxia Augments Increased HIF-1α and Reduced Survival Protein p-Akt in Gelsolin (GSN)-Dependent Cardiomyoblast Cell Apoptosis. Cell Biochem Biophys 2016;74:221-8. 45. Wang HC, Chen CW, Yang CL, et al. Tumor-Associated
Macrophages Promote Epigenetic Silencing of Gelsolin through DNA Methyltransferase 1 in Gastric Cancer Cells. Cancer Immunol Res 2017;5:885-97.
46. Ma X, Sun W, Shen J, et al. Gelsolin promotes cell growth and invasion through the upregulation of p-AKT and p-P38 pathway in osteosarcoma. Tumour Biol 2016;37:7165-74.
Table S1 Primers used for quantitative RT-PCR
No. Primer names Sequence
1 CDH5 Forward AAGCGTGAGTCGCAAGAATG
CDH5 Reverse TCTCCAGGTTTTCGCCAGTG
2 STAT5A Forward GCAGAGTCCGTGACAGAGG
STAT5A Reverse CCACAGGTAGGGACAGAGTCT
3 BTK Forward TCCGAGAAGAGGTGAAGAGTC
BTK Reverse AGAAGACGTAGAGAGGCCCTT
4 GPX3 Forward AGAGCCGGGGACAAGAGAA
GPX3 Reverse ATTTGCCAGCATACTGCTTGA
5 GSN Forward GGTGTGGCATCAGGATTCAAG
GSN Reverse TTTCATACCGATTGCTGTTGGA
6 CXCL12 Forward ATTCTCAACACTCCAAACTGTGC
CXCL12 Reverse ACTTTAGCTTCGGGTCAATGC
7 CXCL14 Forward CTGCGAGGAGAAGATGGTTA
CXCL14 Reverse CTTTGCACAAGTCTCCCAAC
8 PYCARD Forward TGGATGCTCTGTACGGGAAG
Gene logFC P value Expression status
CBS 2.86863 1.40E-06 up-regulated
TMSB15A 2.51239 1.33E-03 up-regulated
ASNS 2.48438 4.74E-06 up-regulated
PRAME 2.43715 3.85E-03 up-regulated
PHGDH 2.36205 1.83E-06 up-regulated
PSAT1 2.35393 9.79E-04 up-regulated
HOXB9 2.32252 3.37E-05 up-regulated
FOXF2 2.31887 7.88E-09 up-regulated
TUBB2B 2.27458 6.73E-03 up-regulated
RPS27 2.26996 7.67E-09 up-regulated
TRIB3 2.202 1.02E-03 up-regulated
KRT18 2.19222 4.04E-02 up-regulated
RPS28 2.16531 2.27E-11 up-regulated
RHPN2 2.14741 5.16E-10 up-regulated
HOXB7 2.0859 7.54E-11 up-regulated
UCHL1 2.06058 3.44E-02 up-regulated
SNAR-A1 2.06015 1.81E-02 up-regulated
LARP6 2.00116 1.90E-04 up-regulated
NDUFB9 1.97682 3.33E-06 up-regulated
BMP4 1.96386 2.94E-02 up-regulated
KRT80 1.93456 2.20E-03 up-regulated
UQCRHL 1.91456 8.07E-11 up-regulated
PYCR1 1.90138 1.45E-08 up-regulated
TMSB15B 1.89281 1.81E-03 up-regulated
TMEM158 1.87398 3.90E-02 up-regulated
RPS23 1.87289 3.49E-08 up-regulated
CTXN1 1.86829 2.16E-03 up-regulated
LDHB 1.85533 6.35E-08 up-regulated
GGH 1.8369 1.21E-06 up-regulated
CDH2 1.82037 1.67E-04 up-regulated
CBX2 1.81804 1.37E-05 up-regulated
CCDC85C 1.79464 5.82E-05 up-regulated
CD70 1.79194 1.41E-02 up-regulated
MTHFD2 1.7826 2.26E-06 up-regulated
HOXC6 1.77691 3.40E-04 up-regulated
NARS 1.71376 8.73E-08 up-regulated
RPL23 1.70136 1.12E-08 up-regulated
COCH 1.67175 1.18E-02 up-regulated
RPN2 1.66775 1.83E-05 up-regulated
DLX1 1.66684 8.53E-06 up-regulated
LAPTM4B 1.6466 2.60E-04 up-regulated
P4HA2 1.622 5.90E-03 up-regulated
DKK3 1.62106 1.11E-02 up-regulated
SH3BP4 1.6136 1.46E-04 up-regulated
INHBE 1.58633 3.15E-03 up-regulated
FOXD1 1.58097 9.51E-04 up-regulated
MARS 1.56382 2.06E-03 up-regulated
CDK4 1.56202 3.82E-03 up-regulated
C8orf59 1.56049 6.93E-07 up-regulated
TUSC3 1.54348 1.10E-04 up-regulated
TUFT1 1.5424 4.59E-04 up-regulated
NETO2 1.51885 2.62E-03 up-regulated
MRPL13 1.51548 5.36E-05 up-regulated
CTHRC1 1.51249 3.13E-02 up-regulated
PBK 1.50362 3.41E-03 up-regulated
LHX2 1.49652 7.64E-05 up-regulated
SUMO2 1.4912 1.83E-07 up-regulated
HS3ST3A1 1.49006 1.68E-02 up-regulated
BCAT1 1.49003 1.71E-04 up-regulated
AMY1C 1.47724 1.76E-03 up-regulated
YES1 1.46839 1.51E-06 up-regulated
TUBA1A 1.46646 2.09E-03 up-regulated
CDC20 1.45371 2.15E-02 up-regulated
GJA1 1.4512 2.01E-02 up-regulated
CDKN2A 1.44766 4.14E-02 up-regulated
PSMG1 1.44007 2.64E-05 up-regulated
CDK1 1.43336 3.51E-04 up-regulated
ADORA2B 1.43215 4.21E-02 up-regulated
PPT1 1.42821 4.80E-05 up-regulated
IGF1R 1.41576 7.63E-04 up-regulated
HOXB5 1.41239 1.40E-04 up-regulated
RPLP0 1.40545 6.57E-05 up-regulated
CLEC2D 1.40137 5.23E-05 up-regulated
IGF2BP3 1.39775 3.08E-04 up-regulated
TSEN15 1.38192 5.97E-06 up-regulated
PCNA 1.37241 8.85E-05 up-regulated
FAM60A 1.3608 6.53E-05 up-regulated
MRPS21 1.35778 1.31E-03 up-regulated
HIST1H1C 1.3562 4.08E-02 up-regulated
PTGES3 1.35171 8.56E-08 up-regulated
BAIAP2L1 1.35122 2.40E-02 up-regulated
HOXB8 1.34337 6.75E-04 up-regulated
UBE2V2 1.3423 4.31E-06 up-regulated
TFAP2A 1.34098 2.17E-04 up-regulated
RPL39L 1.33544 4.24E-02 up-regulated
PNMA2 1.33329 2.51E-03 up-regulated
MSMO1 1.32728 4.89E-04 up-regulated
43723 1.32217 1.21E-08 up-regulated
JPH3 1.32023 6.72E-04 up-regulated
CADM1 1.31959 4.67E-02 up-regulated
ATF4 1.31573 3.97E-06 up-regulated
MRGBP 1.31347 1.81E-05 up-regulated
STIL 1.3069 1.79E-04 up-regulated
CD24 1.30188 3.10E-02 up-regulated
FADS1 1.29936 4.22E-04 up-regulated
TSPAN3 1.29826 1.58E-04 up-regulated
TMEM97 1.29788 1.21E-03 up-regulated
SNRPF 1.29673 4.06E-04 up-regulated
LMNB2 1.29257 5.44E-04 up-regulated
SLC38A2 1.28646 1.17E-06 up-regulated
CTSV 1.2847 1.35E-02 up-regulated
CENPN 1.2795 7.02E-03 up-regulated
PFN2 1.27903 2.83E-03 up-regulated
FSCN1 1.27759 3.83E-03 up-regulated
KIAA0101 1.27625 3.22E-02 up-regulated
ITPKA 1.27388 1.83E-03 up-regulated
S100A10 1.27361 1.86E-04 up-regulated
HEBP2 1.27358 7.11E-05 up-regulated
USP1 1.2721 1.56E-05 up-regulated
SNTB1 1.2702 2.22E-02 up-regulated
TOMM34 1.26349 5.32E-04 up-regulated
PSPH 1.26287 8.13E-04 up-regulated
RPL7 1.26277 7.84E-05 up-regulated
SLC35B2 1.25915 3.14E-03 up-regulated
KCNG1 1.25551 1.67E-02 up-regulated
SHROOM3 1.25475 2.97E-05 up-regulated
TRA2B 1.25444 3.53E-06 up-regulated
SHMT2 1.25438 5.72E-04 up-regulated
DENND2A 1.25123 1.98E-02 up-regulated
P4HA1 1.24989 1.56E-04 up-regulated
NPTN 1.24936 7.71E-07 up-regulated
SOX4 1.24746 2.96E-04 up-regulated
XRCC6 1.24656 8.32E-06 up-regulated
PTK7 1.24626 2.60E-03 up-regulated
SLC25A23 1.24538 6.90E-05 up-regulated
YAP1 1.24156 1.83E-03 up-regulated
TSFM 1.24148 2.00E-02 up-regulated
RDH10 1.23377 1.03E-02 up-regulated
AHCY 1.23173 1.93E-04 up-regulated
DLL3 1.22567 2.91E-04 up-regulated
BCAS4 1.22392 2.07E-03 up-regulated
RPS21 1.2177 2.10E-03 up-regulated
MTRR 1.21718 1.21E-03 up-regulated
EIF3A 1.21646 1.63E-07 up-regulated
SCD 1.2133 4.26E-03 up-regulated
SNRPA1 1.21076 1.81E-05 up-regulated
PVT1 1.20649 1.06E-02 up-regulated
TNFRSF12A 1.20647 3.45E-02 up-regulated
MED10 1.20467 1.91E-05 up-regulated
FOXF1 1.20251 1.41E-02 up-regulated
AGPAT5 1.19818 8.36E-07 up-regulated
TRIP13 1.19681 9.72E-03 up-regulated
FAM64A 1.19622 1.60E-02 up-regulated
BCAR3 1.19567 8.67E-03 up-regulated
SLC35F2 1.18443 3.98E-04 up-regulated
TMEM14A 1.18308 6.63E-03 up-regulated
DFNA5 1.18302 2.11E-02 up-regulated
C1orf53 1.18241 1.57E-06 up-regulated
BOP1 1.18186 4.69E-04 up-regulated
TMEM54 1.181 3.62E-04 up-regulated
EPHA2 1.17619 1.05E-02 up-regulated
MORF4L1 1.16974 5.49E-05 up-regulated
SLC38A1 1.16964 1.17E-02 up-regulated
KIF20A 1.16683 1.91E-02 up-regulated
ULBP1 1.16431 9.31E-04 up-regulated
RPLP1 1.16415 1.09E-05 up-regulated
TPST1 1.16013 5.00E-03 up-regulated
CCNO 1.15859 1.36E-05 up-regulated
MAD2L2 1.15818 6.63E-05 up-regulated
CCNB2 1.15807 2.76E-02 up-regulated
NTF3 1.15717 9.22E-03 up-regulated
METTL21B 1.15654 3.81E-02 up-regulated
HOXB2 1.15621 3.40E-02 up-regulated
PRKCA 1.15608 1.29E-03 up-regulated
CKS2 1.15449 9.21E-03 up-regulated
ELOVL5 1.15325 1.65E-05 up-regulated
CNN3 1.15265 8.52E-03 up-regulated
WDR54 1.15192 1.99E-03 up-regulated
RND3 1.15142 2.44E-02 up-regulated
UAP1 1.14908 5.14E-05 up-regulated
B4GALNT1 1.14738 2.53E-02 up-regulated
CXorf57 1.14526 2.62E-03 up-regulated
PERP 1.14226 4.21E-03 up-regulated
PIR 1.13938 3.93E-03 up-regulated
AURKA 1.13846 2.66E-02 up-regulated
MAD2L1 1.13735 8.81E-03 up-regulated
TAGLN2 1.13671 2.67E-03 up-regulated
MSH6 1.1361 8.31E-05 up-regulated
PIGT 1.13238 6.38E-06 up-regulated
AURKB 1.13022 1.13E-02 up-regulated
AP1S1 1.13018 6.30E-04 up-regulated
CEP55 1.12981 1.12E-02 up-regulated
ISL1 1.12874 5.64E-03 up-regulated
MTFR1 1.1271 5.25E-04 up-regulated
TM9SF2 1.12553 3.91E-04 up-regulated
NKX2-2 1.1255 8.44E-03 up-regulated
43719 1.11697 1.89E-06 up-regulated
C10orf35 1.11443 6.94E-03 up-regulated
KDELR2 1.11324 7.37E-03 up-regulated
LDOC1 1.11321 1.72E-02 up-regulated
RCN2 1.11287 2.97E-04 up-regulated
SLC29A4 1.11279 1.22E-02 up-regulated
MED30 1.11021 3.60E-04 up-regulated
C14orf166 1.10726 3.13E-04 up-regulated
RSL24D1 1.10265 2.08E-04 up-regulated
43530 1.10214 2.33E-03 up-regulated
ATAD2 1.09842 7.39E-03 up-regulated
ZFP64 1.09762 3.32E-03 up-regulated
PRKDC 1.09743 1.29E-04 up-regulated
YARS 1.09408 7.90E-05 up-regulated
PDP1 1.09367 3.91E-04 up-regulated
F12 1.09256 1.30E-03 up-regulated
PFDN6 1.09154 2.92E-03 up-regulated
MIF 1.08773 9.85E-04 up-regulated
E2F7 1.08453 3.54E-03 up-regulated
SDHAF3 1.08319 1.20E-03 up-regulated
HOXC4 1.08245 2.77E-04 up-regulated
MTX2 1.07936 3.08E-07 up-regulated
FNBP1L 1.07524 4.44E-04 up-regulated
KIF2C 1.0749 6.94E-03 up-regulated
GPX8 1.07488 1.29E-05 up-regulated
UBE2E1 1.06912 5.50E-06 up-regulated
SREBF2 1.06673 1.99E-05 up-regulated
GPT2 1.06533 1.98E-02 up-regulated
PODXL2 1.06451 3.18E-03 up-regulated
MTHFD1L 1.06383 2.81E-03 up-regulated
RAE1 1.05617 3.55E-05 up-regulated
TPI1P2 1.05585 7.46E-04 up-regulated
C15orf52 1.05524 4.71E-02 up-regulated
TMED7 1.05358 1.39E-05 up-regulated
ASPSCR1 1.05272 1.64E-02 up-regulated
TYMS 1.05271 4.15E-02 up-regulated
SERF1B 1.05268 9.76E-04 up-regulated
ZIC2 1.05264 2.88E-02 up-regulated
NUDT14 1.05253 5.59E-03 up-regulated
PSMA6 1.0494 2.33E-05 up-regulated
NCOR2 1.04841 4.62E-03 up-regulated
SLC3A2 1.04579 1.14E-04 up-regulated
FDFT1 1.04297 3.59E-05 up-regulated
CNIH1 1.03912 2.00E-04 up-regulated
COMMD10 1.03903 1.12E-06 up-regulated
PPIAL4A 1.03873 1.61E-06 up-regulated
CCDC58 1.03669 1.38E-04 up-regulated
NXN 1.03613 6.62E-03 up-regulated
MCTS1 1.03571 1.97E-07 up-regulated
BMP7 1.03213 3.34E-03 up-regulated
PCK2 1.02938 5.85E-03 up-regulated
PRKRA 1.02824 5.65E-06 up-regulated
NFE2L3 1.02822 2.96E-02 up-regulated
HDAC2 1.02712 1.57E-04 up-regulated
DHCR7 1.0266 1.03E-03 up-regulated
CCNB1IP1 1.02421 9.63E-03 up-regulated
LYPD6B 1.02351 1.54E-02 up-regulated
IQGAP3 1.02279 5.88E-03 up-regulated
PIP4K2C 1.02264 4.04E-02 up-regulated
RDH11 1.02229 2.82E-05 up-regulated
MRPL14 1.01797 6.63E-03 up-regulated
YIPF4 1.01761 1.29E-08 up-regulated
SPEG 1.01388 5.49E-03 up-regulated
SPDL1 1.01331 3.36E-03 up-regulated
MRPL9 1.01311 3.23E-04 up-regulated
GLRB 1.0118 1.22E-02 up-regulated
NR2F6 1.0106 8.71E-05 up-regulated
PIPSL 1.00853 1.49E-06 up-regulated
MEX3B 1.00817 1.25E-03 up-regulated
WDYHV1 1.00786 1.17E-03 up-regulated
NUDT5 1.00768 6.00E-03 up-regulated
NME2 1.00582 3.14E-04 up-regulated
ACOT7 1.00427 2.85E-03 up-regulated
BDNF 1.00381 1.10E-02 up-regulated
BUB1 1.00265 1.79E-03 up-regulated
IFNGR1 −1.0006 9.91E-05
STXBP2 −1.0017 1.96E-02
RNASET2 −1.0023 3.72E-02
VSIG4 −1.0045 1.93E-05
HSPB6 −1.005 4.50E-02
CCL4 −1.0059 4.84E-04
IFITM2 −1.0062 4.72E-02
HCK −1.0065 1.74E-05
TMOD4 −1.0081 2.24E-02
PARVG −1.0083 1.69E-03
CPXM2 −1.0089 4.34E-02
CELF2 −1.0101 6.13E-06
APOL3 −1.0124 2.91E-03
KDM5D −1.0166 4.09E-03
SESN1 −1.0167 2.37E-04
TSPAN7 −1.0196 1.99E-02
PNPLA7 −1.0215 8.98E-03
LPL −1.0237 2.55E-02
FEZ1 −1.0239 4.87E-02
ANKRD35 −1.0245 1.58E-04
SLC44A2 −1.0254 3.21E-03
CD59 −1.028 7.01E-03
UCP2 −1.0282 4.51E-02
LILRA2 −1.0288 5.43E-04
GPSM3 −1.0291 2.19E-02
UBAC1 −1.0294 2.85E-03
TNFSF13B −1.0303 5.62E-05
LMOD3 −1.0326 7.47E-04
BTK −1.0331 1.42E-03
PGAM2 −1.0347 2.21E-02
PIK3IP1 −1.0366 2.51E-02
UBA7 −1.0371 1.50E-02
CD79A −1.0373 4.54E-04
DHRS1 −1.0375 5.71E-03
NNAT −1.038 1.12E-02
GZMA −1.039 4.16E-02
FOXO3B −1.0408 4.64E-04
CDC42EP5 −1.041 3.07E-02
GUCY1A3 −1.0426 7.77E-04
RPL3L −1.0427 2.57E-02
ACTN2 −1.0434 2.14E-02
JAG1 −1.0437 1.22E-03
SVIL −1.0447 3.51E-02
HLA-DOA −1.048 8.29E-06
FAM26F −1.0489 6.45E-03
CXCL16 −1.0512 4.80E-02
RBP7 −1.0523 1.23E-02
GPAM −1.0548 2.10E-03
RASGRP3 −1.0574 1.91E-04
MEDAG −1.0587 1.18E-03
PIGQ −1.0594 1.43E-02
LIPE −1.0602 6.90E-03
NPL −1.0614 3.84E-03
GALC −1.0626 4.81E-03
NRAP −1.0627 1.86E-02
LST1 −1.0633 3.30E-05
ADARB1 −1.0653 1.23E-02
IGF2 −1.0654 2.34E-02
PHKG1 −1.0682 3.72E-03
GPX1 −1.0684 3.38E-03
UGCG −1.0697 1.28E-02
IL4R −1.0697 2.41E-03
COL4A3BP −1.0698 5.34E-06
EBF1 −1.072 8.10E-03
ACER3 −1.0723 4.22E-06
SLC38A5 −1.0734 4.37E-04
MYH1 −1.0748 2.46E-02
FBXO7 −1.0756 1.85E-03
NTRK2 −1.079 8.53E-04
PARM1 −1.0803 8.33E-03
XIRP2 −1.0813 3.00E-02
CEACAM8 −1.0816 7.94E-03
CTSE −1.0834 5.54E-03
TPP1 −1.0845 1.42E-03
TANGO2 −1.0875 3.40E-03
RDH5 −1.089 3.56E-03
LPAR6 −1.091 3.66E-03
RAB27B −1.0912 2.94E-02
CLK1 −1.092 4.94E-04
TNMD −1.094 2.80E-03
IL6ST −1.0944 1.54E-03
ARHGAP4 −1.0963 1.84E-02
TRIM22 −1.097 4.04E-03
ALAS2 −1.0997 7.46E-03
XK −1.1016 1.63E-02
RBP4 −1.104 1.05E-02
RGS5 −1.105 3.91E-04
IRF9 −1.1056 5.49E-03
COQ8A −1.1087 9.28E-03
COX6A2 −1.1111 2.14E-02
OSTF1 −1.1123 1.30E-04
SH2B3 −1.1128 2.51E-02
PPP2R5A −1.1193 9.74E-04
NR4A3 −1.1194 1.06E-03
PPP6R2 −1.12 5.93E-06
PTGER4 −1.1205 4.41E-04
NFIA −1.1237 1.16E-06
PPP1R3C −1.124 4.49E-02
CLEC4A −1.1248 5.92E-05
FMO2 −1.1259 3.64E-04
CASQ2 −1.1328 1.56E-03
KLF1 −1.1347 5.48E-03
CD209 −1.135 1.05E-03
SLC7A2 −1.1362 2.56E-02
CXCL14 −1.1391 3.92E-02
PYGM −1.1414 1.29E-02
43526 −1.1418 8.37E-04
TPM2 −1.1419 3.33E-02
S1PR3 −1.1433 1.30E-02
LYST −1.1437 2.27E-03
ARHGEF3 −1.1437 1.58E-02
RERGL −1.1484 1.07E-03
SIDT2 −1.1493 8.85E-04
NDRG2 −1.1521 8.60E-03
SLC15A3 −1.153 1.20E-03
FOXC1 −1.1554 6.50E-03
SLCO2B1 −1.1585 8.56E-06
SNRK −1.1601 9.47E-05
CD33 −1.1619 7.32E-04
GPD1 −1.164 4.56E-03
CPA3 −1.1643 1.26E-04
TGFBR3 −1.1694 7.50E-03
CALM1 −1.1707 1.40E-05
FAM13A −1.1712 1.66E-05
MYOC −1.1713 7.81E-03
GVINP1 −1.1734 6.77E-06
SLCO2A1 −1.1747 5.01E-03
ADD1 −1.1765 1.34E-05
FMO3 −1.1771 2.88E-04
FLOT2 −1.1775 2.54E-03
RAB20 −1.1792 1.40E-02
SLC2A5 −1.1846 1.30E-03
TCF4 −1.1855 1.15E-03
PODN −1.1862 3.33E-04
INPP5D −1.1876 2.46E-04
TRPV2 −1.1884 1.64E-04
CDO1 −1.1886 7.30E-04
MYL12A −1.1897 6.40E-04
RAPGEF3 −1.1907 2.10E-03
YPEL3 −1.1915 3.90E-05
OSM −1.1929 2.33E-04
GCA −1.1965 2.45E-02
FAM107B −1.1988 1.94E-02
CASQ1 −1.2009 1.77E-02
TEK −1.2011 1.49E-04
IL18RAP −1.2014 1.01E-03
LEP −1.2028 1.63E-03
RHD −1.2036 7.31E-03
FMOD −1.2047 7.63E-03
PROS1 −1.208 3.07E-03
APOBEC2 −1.2121 1.24E-02
MYOZ3 −1.214 1.98E-03
NFKBIA −1.216 7.49E-03
C5AR1 −1.2168 2.15E-04
PNP −1.2208 7.40E-03
MAPK13 −1.2223 4.00E-05
Table S2 (continued)
Gene logFC P value Expression status
SEPW1 −1.2235 2.56E-03
LTF −1.2254 6.82E-03
AMT −1.2395 1.89E-07
SLC11A1 −1.2422 7.40E-04
DES −1.2441 1.33E-02
TBC1D10C −1.2446 4.47E-04
FOXO4 −1.2525 1.85E-03
SNCA −1.2532 3.81E-02
MLKL −1.2533 8.39E-04
CYTH4 −1.2577 3.12E-04
ARG1 −1.2622 6.31E-03
GIMAP6 −1.264 2.38E-05
TTN −1.2642 9.44E-03
DDIT4L −1.2664 4.15E-03
PTGIS −1.2665 6.43E-04
CYYR1 −1.2676 8.51E-04
HK3 −1.2693 9.65E-04
PRSS35 −1.2695 1.09E-04
REC8 −1.2705 1.52E-05
LTBP2 −1.277 5.84E-05
SLC25A37 −1.2775 2.81E-02
GPM6B −1.2803 3.35E-05
SPOCK2 −1.2814 9.19E-06
TMEM140 −1.2879 1.05E-03
TCN1 −1.2932 1.15E-02
PIK3R1 −1.2952 8.52E-04
CD247 −1.2957 7.70E-05
HCP5 −1.2965 4.17E-02
LBP −1.2966 1.75E-05
ITPRIP −1.2974 6.09E-05
ARHGAP15 −1.2975 4.15E-05
MYBPC2 −1.3001 1.27E-02
CA3 −1.3026 3.63E-02
CD37 −1.3042 6.28E-05
KEL −1.3112 5.26E-03
ZBTB20 −1.3148 1.66E-02
HYAL1 −1.3175 1.64E-04
CKMT2 −1.3179 1.64E-02
STARD8 −1.319 1.22E-04
RGL4 −1.3196 6.97E-04
PLIN1 −1.321 5.98E-03
PRKCH −1.3217 1.87E-03
GJA4 −1.3244 3.27E-05
ITGAM −1.3245 1.11E-04
MCEMP1 −1.3257 3.05E-03
MMP13 −1.3263 7.07E-03
MAP2K3 −1.328 2.32E-03
ACTN3 −1.3287 1.80E-02
ISLR −1.3305 8.79E-07
LYVE1 −1.3332 5.03E-06
RNASE3 −1.3361 7.55E-03
TMEM71 −1.3384 6.29E-03
BIN2 −1.3391 4.36E-04
CYP1B1 −1.3393 4.36E-02
ICAM3 −1.341 7.37E-04
ADAMTS4 −1.3412 1.29E-02
CST7 −1.342 9.91E-04
GSN −1.3423 2.06E-03
ADCY4 −1.3472 2.58E-05
<