DOI: http://dx.doi.org/10.26483/ijarcs.v8i8.4592
Volume 8, No. 8, September-October 2017
International Journal of Advanced Research in Computer Science
RESEARCH PAPER
Available Online at www.ijarcs.info
ISSN No. 0976-5697
PREDICTION AND FEATURE REDUCTION USING NON PARAMETRIC DATA
MINING TECHNIQUES
Dr. B. Lavanya
Department of Computer Science University of Madras, Chennai-600005S. Divyabarathi
Department of Computer Science University of Madras, Chennai-600005Abstract: Dimensionality Reduction is a technique that endeavors to convert the data from high dimensional space to a less dimensional space while holding measurements among them and further promotes the accuracy. Data mining has great potential in healthcare field. In this paper different data mining classification techniques like k-Nearest Neighbor, Support Vector Machine, Random Forest, and Principal Component Analysis have been implemented. This paper deals with Attribute selection for Dimensionality reduction in Machine learning. The experimental results are tabulated and graphs indicate the performance of each of the technique used. The Support Vector Machine provides better results with highest accuracy and least error rate, when compared with other classifiers.
Keywords: Classification, Dimension Reduction, k-Nearest Neighbor, Support Vector Machine, Random Forest, Principal Component Analysis.
1. INTRODUCTION
Dimensionality reduction is the investigation technique for lessening the quantity of measurements portraying the question. Data Mining has attracted great attention from various fields due to wide and large data present in these fields. The information and knowledge gained by data mining and their applications can be used in various areas including market analysis, Business and E-Commerce fraud detection, customer retention, production control, Scientific, Engineering, and HealthCare etc. Various data mining techniques can be applied in various fields [1]. This paper discusses different data mining classification techniques like k-Nearest Neighbour, Support Vector Machine, Random Forests, and Principal Component Analysis (PCA). The k-nearest neighbor algorithm is a non parametric technique, used for classifying based on closest training examples in the feature space. Support Vector Machine is to find the optimal separating hyperplane, because it correctly classifies the training data. Random Forest is an ensemble classifier that consists of many decision trees and outputs the class that is the mode of the class’s output by individual trees. PCA seeks to reduce the dimension of the data by finding a few orthogonal linear combinations (the principal components PCs) of the original variables with the largest variance.
2. LITERATURE REVIEW
S.Neelamegam, Dr.E.Ramaraj, et.al., [4], “Classification algorithm in Data mining: An Overview” of different data mining classification techniques including decision tree, K-Nearest Neighbor, Support vector machine.Gopala Krishna Murthy Nookala, et. al., [5] examined the performance analysis and evaluation of different data mining algorithms used for cancer classification. From the acquired results, it’s shown that the performance of classifier depends on the data set. Ashfaq Ahmed K, et.al., [6] presented the “prediction performance with support vector machine and random forest”, Different training models are created using different kernel functions like Linear, Polynomial, Radial functions
Venkatadri M, Lokanatha C. Reddy, [7] Presented the “comparative performance with Decision Tree techniques”, from the study’s observed that there is a varying accuracy of classification. Moloud Abdar,et.al.,[8] presented, “comparison of data mining algorithms in prediction of healthcare”. There are five algorithms including decision tree, neural network, support vector machine and k-nearest neighbour, logistic regression are used for classification and comparison. Jolliffe I, et.a1.,[9] Principal component analysis (PCA) is a mathematical algorithm that reduces the dimensionality of the data while retaining most of the variation in the dataset . It accomplishes reduction by identifying directions, called principal components, along which the variation in the data is maximal.
3. PROPOSED METHODOLOGY
The proposed method classifies the level of locations based on tobacco use risk factor and compares the performance of K-Nearest Neighbour, Random Forest, Support vector Machine and Principal Component Analysis over this data. The objective of this paper includes:
• Choose the dataset to work with. • Preparing the data.
• Apply the data on classification algorithms. • Compare the performance of the algorithms.
3.1 Dataset Description
The Dataset used for this study is taken from the web and it is a behavior risk factor data of Tobacco use [2]. R Software is used for the implementation of the proposed method.
Objective: To identify the predictors that lead to prevalence of Cigarette Smoking among Young people by utilizing the dataset (Youth tobacco survey data).In the year 1998-2016, YTS was advanced to maintain states with complete data on both male and female students regarding tobacco use. The Youth tobacco survey data comprises STATE (State Tobacco Activities and Tracking and Evaluation) and CDC (Centers for Disease Control and Prevention) approved questions designed to gather data on these seven topics [3]:
• Prevalence of Cigarette Smoking among young people.
• Tobacco Cigarette Smoking-related Knowledge and Attitudes of young people.
• Exposure to Pro-tobacco and Anti-tobacco Media Messages and Advertising.
• Minor’s access to tobacco Cigarette Smoking.
• Tobacco Cigarette Smoking-related School curriculum.
• Second hand Smoke.
• Addiction to tobacco cigarette Smoking and initiation and cessation of tobacco use.
3.2 Feature Selection or Attribute Selection Attribute subset selection, reduces the dataset size by removing irrelevant or redundant attributes. In machine learning Feature selection also known as attribute selection or variable selection
Reason for Feature selection techniques:
• simplification of models to make them easier to interpret by researchers/users,
• shorter training times,
• to avoid the
• Enhanced generalization by reducin
3.3 Cross Validation
Cross validation is a technique used to assess and evaluate the performance of machine learning algorithms. This technique is applied on new datasets that is not yet trained. In every round of cross validation we randomly partition the given original data set into a training set that is used for training a machine learning algorithm and testing set for evaluating its performance.
3.4 Pre-processing the Data
The original dataset retrieved from the web has noisy and missing values. This may affect the quality of results, in order to improve the quality of data and mining results the raw tobacco data is pre-processed so as to improve the efficiency of the mining process. The proposed method uses pre-processing methods such as data reduction, and replacing missing values.
4. CLASSIFICATION TECHNIQUE
Data mining have different types of classification techniques as follows
4.1 K-Nearest Neighbor
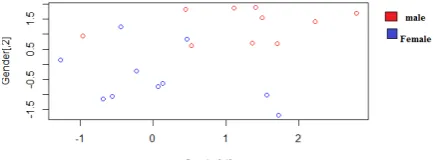
[image:2.595.315.544.135.277.2]K-Nearest Neighbor is a simple algorithm that stores all available cases and classifies new cases based on a similarity measure (e.g., distance functions)[4] [5]. The simple version of the KNN classifier algorithms is to predict the target label by finding the Nearest Neighbor class. The closest class will be identified using the distance measures like Euclidean Distance.
Figure 2: k-Nearest Neighbor classifies the class location based on gender percentage of accuracy with Repeated cross Validation
4.2 Support Vector Machine
A Support Vector Machine (SVM) is a supervised classifier formally defined by a separating hyper plane. The Goal of a SVM is to find the best hyper plane which maximizes the margin of a training data. Support Vector Machine is a Supervised Learning algorithm (SLA). SVM is a classification algorithm, which means we will use it to predict if individual belongs to a particular class. For instance, we can have that training data below [6][8]. We have plotted the size and weight of several people, and there is also a way to distinguish between male and female. Just by looking at the plot, we could trace a line and then all the data points representing male will be above the line, and all the data points representing Female will be below the line, as shown in figure 3
[image:2.595.316.534.509.589.2]Fig.4: Tuning different values of epsilon and cost values for gender by shading the values from dark to light
4.3 Random Forest
[image:3.595.316.536.92.209.2]Random Forest is a supervised learning method of classification that consists of many decision trees of training time and outputs the class that is the mode of the class’s output by individual trees [6][7]. When the training set for the current tree is drawn by sampling with replacement, about one-third of the cases are leaf out of the sample, as shown in figure 5. .
Fig.5. Histogram of class location with different frequency and tree sizes with number of nodes for random forest.
4.4 Prinicipal Component Analysis
Principal Component Analysis (PCA) is a statistical procedure that uses an orthogonal transformation to convert a set of observations of possibly correlated variables into a set of values of linearly uncorrelated variables called principal components (or Sometimes, principal modes of variation.[9]
To perform dimensionality reduction while preserving as much of the randomness in the high-dimensional space is possible. Principal Component Analysis is realized on
Covariance Matrix or on the Correlation Matrix these matrix can be calculated from the Data matrix as shown in figure 6.
Fig. 6: calculated the covariance matrix of class Location based on tobacco use gender frequency level and cumulative percentage of
standard deviation.
4.5 Confusion Matrix
The evaluation of document classification techniques can be obtained in terms of correctness by computing statistical measures namely the True Positives (TP), True Negatives (TN), False Positive (FP), and False Negatives (FN).
[image:3.595.41.274.323.464.2]Correctly classified instance = TP + TN Incorrectly classified instance = FP + FN
Table 1: Format of Confusion Matrix
Actual/ Predicted
Predicted Yes Predicted No
Actual Yes True Positive(TP)
False Positive(FN) Actual No False
Negative(FP)
True
Negative(TN)
5. PERFORMANCE MEASURES
After the classification process, the performance of the used algorithms are compared based on the performance measures such as correctly and incorrectly classified instances, kappa statistics, mean absolute error, root mean squared error, relative absolute error, root relative squared error, true positive rate and false positive rate. For the ease of comparison task the acquired results are
interpreted as graph.
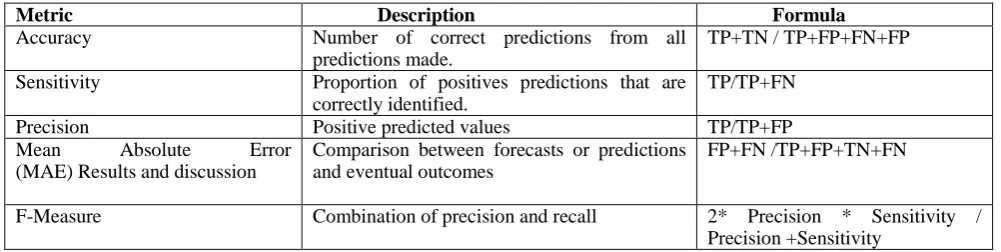
Table 2: Performance Measure Formula with Description
Metric Description Formula
Accuracy Number of correct predictions from all
predictions made.
TP+TN / TP+FP+FN+FP
Sensitivity Proportion of positives predictions that are correctly identified.
TP/TP+FN
Precision Positive predicted values TP/TP+FP
Mean Absolute Error (MAE) Results and discussion
Comparison between forecasts or predictions and eventual outcomes
FP+FN /TP+FP+TN+FN
F-Measure Combination of precision and recall 2* Precision * Sensitivity /
[image:3.595.48.549.654.780.2]6. RESULTS AND DISCUSSION
A result shows the accuracy and kappa of confusion matrix. The tested results are tabulated and graphs indicate the performance of each of the technique used.
6.1 Accuracy Measures
Accuracy is calculated using Confusion Matrix. Accuracy = (TP+TN) / (TP+FN+FP+TN). Accuracy is measures for each algorithm. It is useful tool for analyzing how well your classifier can recognize tuples of different classes. We can speak of the error rate or Misclassification rate of a classifier M, which is simply (1 – Accuracy).
Various factors affect the level of accuracy. Dimensions, quality of data, record size and many other things.
6.2 Accuracy Measures of classification Techniques with confusion Matrix
6.2.1 Results for k-Nearest Neighbor
[image:4.595.324.539.240.335.2]K-Nearest Neighbor obtained accuracy of 11.1% of correctly classified instances and 88.9% of incorrectly classified instances on “Tobacco use” data. The following table 3 shows the confusion matrix of k-Nearest Neighbor:
Table 3: K-Nearest Neighbor confusion Matrix
Classification Algorithm
Accuracy Percentage
Error Rate Percentage K-Nearest
Neighbor
11.1% 88.9%
6.2.2 Results for Support Vector Machine
[image:4.595.318.539.382.485.2]Support Vector Machine obtained accuracyof 90% correctly classified instances and 10% of incorrectly classified instances on “Tobacco use” data. The following table 4 shows the confusion matrix of Support Vector Machine.
Table 4: Support Vector Machine confusion Matrix
Classification Algorithm
Accuracy Percentage
Error Rate Percentage Support Vector
Machine
90% 10%
6.2.3 Results for Random Forest
[image:4.595.318.533.526.643.2]Random Forest obtained accuracy of 84.6% of correctly classified instances and 15.4% of incorrectly classified instances on “Tobacco use” data. The following table 5 shows the confusion matrix of Random Forest:
Table 5: Random Forest Confusion Matrix
Classification Algorithm
Accuracy Percentage
Error Rate Percentage
Random Forest 84.6% 15.4%
6.2.4 Results for Principal Component Analysis
Principal Component Analysis obtained accuracy of 12.1% of correctly classified instances and 87.9% of incorrectly classified instances on “Tobacco use” data. The following Table 6 shows the confusion matrix of Principal Component Analysis.
Table 6: Principal Component Analysis Confusion Matrix
Classification Algorithm
Accuracy Percentage
Error rate Percentage Principal
Component Analysis
12.1% 87.9%
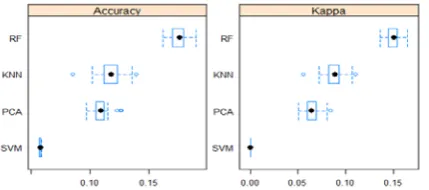
6.4 Comparison of Performance Measures with accuracy results
Comparison of classification performance measures of accuracy and kappa. Here Support Vector Machine provides better results highest accuracy and least error rate, when compared with other classifiers
Fig.7 Box width Plot performs the accuracy of confusion matrix. It measures the accuracy value of tested results. SVM provides 90%
of accuracy and 10% error rate.
Fig.8 Density Plot performs accuracy with confusion matrix. Density Measures the accuracy of tested results. SVM Provides
90% of accuracy and 10% of error rate.
Fig.9 Dot Plot Performs accuracy with confusion matrix. It measures the accuracy value of tested results. SVM Provides 90%
Fig.10 Parallel Plot performs the accuracy with confusion matrix. Parallel Measures the accuracy value of tested results. SVM
provides 90% of accuracy and 10% of error rate.
7. CONCLUSION
Data mining is the process which finds useful patterns from large amount of data. In this paper uses different data mining Classification techniques like K-Nearest Neighbor, Support Vector Machine, Random Forest, Principal component analysis (PCA) have been tested. The experiment result compares the Accuracy and Kappa for Performance Measures. The Support Vector Machine (SVM) provides better results for highest Accuracy, low time and least Error rate. It is observed that logistic Classification techniques turned out to be best classifier for tobacco Prediction.
Future Work: In Future, it is doable to increase the analysis by using different clustering techniques and Association rule mining. It is also enhanced by reducing the attributes for the Youth tobacco survey dataset, possible to improve efficiency of classification technique with Filter and wrapper approaches and combination of classification techniques.
8. REFERENCES
[1] H. C. Koh andG.Tan, “Data Mining Application in Healthcare”, Journal of Healthcare Information Management, vol. 19, no.2, (2005)
[2] http://www.cdc.gov/brffs
[3] Centres for Disease Control and Prevention. Trends in cigarette smoking among high school students – United States, 1991-2001. MMWR Morb Mortal Wkly Rep2002; 51: 409–12.
[4] S.Neelamegam, Dr.E.Ramaraj."Classification algorithm in Data mining: An Overview". International Journal of P2P Network Trends and Technology (IJPTT).V3(8):369 - 374 Issue 2013. ISSN: 2249-2615.
[5] Gopala Krishna Murthy Nookala, et. al., "Performance Analysis and Evaluation of Different Data Mining Algorithms used for Cancer Classification", International Journal of Advanced Research in Artificial Intelligence (IJARAI),Vol. 2, No.5, 2013.
[6] Ashfaq Ahmed K and Syed NaimatullahHussain, "Comparative Prediction Performance with Support Vector Machine and Random Forest Classification Techniques", International Journal of Computer Applications, Volume 69– No.11, 975-8887, May 2013. [7] Venkatadri.M, Lokanatha C. Reddy. (2010, Apr.-2010,
Sept.). “A comparative study on decision tree classification algorithms in data mining”. International Journal of Computer Application in Engineering, Technology and Sciences (IJ-CA-ETS). [Online].1.1, pg. 1. Available:
[8] MoloudAbdar,et.al, "Comparing Performance of Data Mining Algorithms in Prediction Heart Diseases", International Journal of Electrical a Computer Engineering (IJECE), Vol. 5, No. 6, ISSN: 2088-8708, December 2015.