1408
Quantitative Structure-Activity Relationship Study on BACE1
Inhibitors using Monte Carlo Algorithm
Md Lutful Islam1*, Gulabchand K. Gupta2 1
Research Scholar, Department of Computer Science and Engineering, Shri Jagdish Prasad Jhabarmal Tibrewala University, Vidyanagari, Jhunjhunu - 333 001, Rajasthan, India
2
Seva Sadan College of Arts, Science & Commerce (Affiliated to University of Mumbai), Seva Sadan Marg, Ulhasnagar-421 003, Dist. Thane, Maharashtra, India
*
Email: [email protected]
Abstract- Computational algorithms are extensively used in the wider field of scientific research including drug discovery. In order to explore the chemical functionalities of beta-site APP cleaving enzyme1 (BACE1) inhibitors the Monte Carlo (MC) algorithm was used to develop the quantitative structure-activity relationship (QSAR) models. The CORAL software tool based on MC algorithm uses the simplified molecular-input line-entry system (SMILES) based descriptors to develop QSAR models. The molecular dataset was collected from the Binding database and molecules divided into training, test, calibration and external sets. QSAR models were developed from the training set while other sets used to validate the developed models. To check the influence of cyclic rings of the molecular systems, two approaches were considered to develop the QSAR models such as without- and with-considering the influence of cyclic rings on the inhibitory activity. Best models were selected based on the different statistical parameters. Models were adjudged and found that selected models robust and efficient enough to predict the inhibitory activity of the molecules. The statistical parameters of models in both approaches explained that cyclic rings of the dataset have positive impact on the inhibitory activity. The molecular fragments were found to be crucial to increase or decrease inhibitory activity in both models which clearly explained that models have mechanistic interpretation. Therefore, it can be concluded that generated models can be used to design new promising BACE1 inhibitors for therapeutic application in Alzheimer’s disease.
Index Terms- Alzheimer’s disease; BACE1 inhibitors; QSAR; Monte Carlo algorithm; SMILES
1. INTRODUCTION
Disease due to dementia characterized by progressive deterioration of cognition, function and behavior became significant burden worldwide[1]. Among several dementia diseases, Alzheimer's disease (AD) is incurable neurodegenerative condition and highly dominant in old age globally[2-4]. As per report AD is the most common cause of senile dementia which categorized by impairment of memory, disorientation, difficulty in speaking or writing, loss of reasoning skills, and delusions among other symptoms[5]. To date it is not clear about direct cause of development of the disease but the genetic and environmental are important factors for the progression of AD[6]. As per data of World Health Organization (WHO), only in United States of America there are about 5.7 million people living with AD in 2018. According to report of 2017 about 44 million people suffering from AD or related dementia worldwide. Western Europe having higher number of AD affected people while least prevalent in Sub-Saharan Africa. The AD most prominently found in In India, more than 4 million people have some form of dementia and AD. The leading newspaper “The Indian Express” (September 21, 2016) reported that the AD affected will be double
in India by 2030. People suffering from the AD may have high risk of other age related diseases including hypertension, dyslipidemia, metabolic syndrome and diabetes. To date except management of symptoms there is no therapeutic agent to cure or control such life threatening disease which leads to encourage the current research.
1409 which Monte Carlo (MC) algorithm was used to
develop quantitative structure activity relationship (QSAR) models to explore important chemical functionalities of BACE1 inhibitors and design new lead chemical agents for therapeutic application of AD. The term QSAR can be explained as statistically validated and mathematical relationship between molecular descriptors obtained from chemical structures with biological activities. The experimental or calculated properties obtained from molecules converted into numerical forms are known as descriptor. Statistically robust QSAR models can give insight into the critical structural information of the small molecules which contribute to biological activity[12]. In maximum cases the QSAR models are progressed using the descriptors derived on basis of molecular graph[13-15] but the simplified molecular input-line entry system (SMILES) representation of the molecular structure can also be used [16-18] for molecular descriptor generation followed by development of QSAR models. SMILES notation based descriptors are based on both on the molecular structure and the property under analysis regardless of details from the 3D-molecular geometry[12]. Therefore, SMILES based molecular descriptors are rich of information of molecular properties and can be used to develop QSAR models[19-21]. Research scientists across the globe already established the reputation of the methodology, which was proficient of developing QSAR models with a similar or (http://www.bindingdb.org/) with inhibition constant (Ki) activity in nM range. Initially all duplicate and
without activity compounds were identified and removed. Subsequently, the Lipinski’s rule of five[29] and Viber’s[30] rules were checked and only considered molecules those followed the above two rules. Finally 411 molecules were considered by using above filtering criteria and used for the study. The develop QSAR models and subsequent validation the whole dataset was randomly divided into training, calibration, test and validation sets. The QSAR models were developed using the training set and calibration and test sets used to check the predictive ability of
developed model. The set of external molecules was used for final estimation of the model using the compounds those were unseen during model generation that is no information of validation set was involved during model advancement.
2.2.Optimal descriptors
The SMIES representation of the dataset was used to calculate the molecular descriptors. The SMILES format of molecular structures is one of the useful representation and can be adopted to select optimal molecular descriptors which are mathematical functions of so-called correlation weights (CW) that is “Descriptors of Correlation Weights” (DCW). The MC algorithm was used in the SMILES of the chemical compounds and DCW calculated. Two approaches viz. without and with considering the influence of cyclic rings to the inhibition constant were considered to derive the DCW. To calculate DCW without considering influence of cycle rings on inhibition activity following equation (1) was used.
1( , , ) ( ) ( ) ( )+x ( ) coefficient for classifying various molecular features extracted from SMILES into two classes such as respectively. Descriptors based on presence or absence of different elemental atoms are signified by NOSP, HALO, BOND and PAIR. NOSP explain the nitrogen, oxygen, sulphur and phosphorus; HALO represents halogen atoms such as fluorine, chlorine, bromine and iodine; BOND offers double (=), triple (#) or stereochemical bonds (@ or @@); and PAIR refers the probable grouping of pair atoms and/or SMILES attributes (for example double, triple, and stereochemical bonds) that takes place in the structure together. The α, β, γ, x, y and t are discrete coefficient with values 0 and 1. Detail calculation of the above descriptors with example can be found in Worachartcheewan et al.[26].
1410 threshold (T*) and number of epochs (N*), range of T and Nepoch were selected from 1 to 10 and 1 to 30 respectively. The statistical results were analysed and the best (N*, T*) selected for final model development. The selected best statistics of calibration set makes possible to obtain the endpoint value using numerical values of correlation weights from the training set as follows:
0 1 epoch
EndpointC C DCW(SMILES, T, N )
(3)
The endpoint represents the biological activity and, C0 and C1 are constant.
2.3.Validation
Selected QSAR models can be assessed the robustness by the help of a) internal validation using training set compounds; b) external validation using test compounds; and c) Y-scrambling or randomization of data. Above methodologies are widely used by the researchers from worldwide[21, 22, 24, 25, 28] to validate QSAR models developed using SMILES notation optimal descriptor. In the present study, the cross-validated correlation coefficient (Q2) and error of estimation (s) were also calculated based on predicted activity of training compounds. The high
Q2(>0.5) and low s explained better predictive ability of the model[32]. Further the modified r2 (r2m(LOO))
developed by Roy et al.[33, 34], r2m was calculated
which measures the degree of deviation of the predicted activity from the observed ones. To check the chance correlation Y-scrambling described by Ojha and Roy[35] was also performed in which ten
and randomized model respectively. For acceptance of QSAR model the threshold value of CR2pshould be
greater than 0.5.
3. RESULTS AND DISCUSSION
A set of 411 BACE inhibitors were considered to explore the important chemical functionalities from SMILES-based attributes and correlated with the inhibition constant (pKi). The CORAL software
(http://www.insilico.eu/coral/) based on MC algorithm was used to develop the robust QSAR model. With- and without-considering the influence of cyclic rings of the molecular systems approaches were used to generate descriptors and subsequent development the QSAR. Total 7 molecules were found to be outlier and removed from the dataset for further study.
3.1.Selection of optimal T and Nepoch
Selection of optimal set of (T, Nepoch) is crucial to develop robust QSAR models. In this purpose the “Search for preferable model” option of the CORAL was adopted for the threshold values in the range of 1 to 10 and the number of epochs ranging from 1 to 30. The statistical parameters, epoch numbers and corresponding threshold values are given in Tables 1 and 2 in case without- and with-considering the influence of cyclic rings on inhibitory activity respectively. From detailed analysis of correlation coefficient of training, calibration and test sets the optimal T and Nepoch (T* and N*epoch) were selected. The (T* and N*epoch) were found to be (5, 4) and (6, 4) in case of without- and with-considering the influence of cyclic rings on inhibitory activity respectively. Although it can be seen from Tables 1 and 2 that some epoch numbers may have higher correlation coefficient for training, test and calibration sets but the
Rm2avg values found to be below threshold (≥0.5).
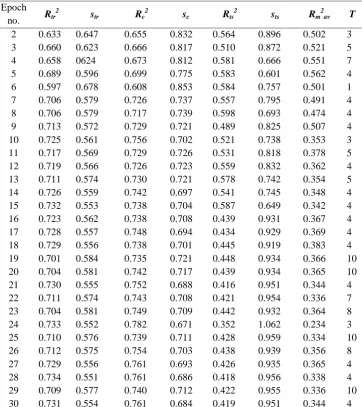
1411 Table 1: Statistical parameters of training, calibration and test set to search T* and N*epoch for without influence of cyclic rings on inhibitory activity
Epoch no. Rtr
2
str Rc2 sc Rts2 sts Rm2av T
2 0.633 0.647 0.655 0.832 0.564 0.896 0.502 3 3 0.660 0.623 0.666 0.817 0.510 0.872 0.521 5 4 0.658 0624 0.673 0.812 0.581 0.666 0.551 7 5 0.689 0.596 0.699 0.775 0.583 0.601 0.562 4 6 0.597 0.678 0.608 0.853 0.584 0.757 0.501 1 7 0.706 0.579 0.726 0.737 0.557 0.795 0.491 4 8 0.706 0.579 0.717 0.739 0.598 0.693 0.474 4 9 0.713 0.572 0.729 0.721 0.489 0.825 0.507 4 10 0.725 0.561 0.756 0.702 0.521 0.738 0.353 3 11 0.717 0.569 0.729 0.726 0.531 0.818 0.378 5 12 0.719 0.566 0.726 0.723 0.559 0.832 0.362 4 13 0.711 0.574 0.730 0.721 0.578 0.742 0.354 5 14 0.726 0.559 0.742 0.697 0.541 0.745 0.348 4 15 0.732 0.553 0.738 0.704 0.587 0.649 0.342 4 16 0.723 0.562 0.738 0.708 0.439 0.931 0.367 4 17 0.728 0.557 0.748 0.694 0.434 0.929 0.369 4 18 0.729 0.556 0.738 0.701 0.445 0.919 0.383 4 19 0.701 0.584 0.735 0.721 0.448 0.934 0.366 10 20 0.704 0.581 0.742 0.717 0.439 0.934 0.365 10 21 0.730 0.555 0.752 0.688 0.416 0.951 0.344 4 22 0.711 0.574 0.743 0.708 0.421 0.954 0.336 7 23 0.704 0.581 0.749 0.709 0.442 0.932 0.364 8 24 0.733 0.552 0.782 0.671 0.352 1.062 0.234 3 25 0.710 0.576 0.739 0.711 0.428 0.959 0.334 10 26 0.712 0.575 0.754 0.703 0.438 0.939 0.356 8 27 0.729 0.556 0.761 0.693 0.426 0.935 0.365 4 28 0.734 0.551 0.761 0.686 0.418 0.956 0.338 4 29 0.709 0.577 0.740 0.712 0.422 0.955 0.336 10 30 0.731 0.554 0.761 0.684 0.419 0.951 0.344 4
Rtr 2
: Correlation coefficient of training set; str: standard error of training set; Rc 2
: Correlation coefficient of calibration set; sc: standard error of calibration set; Rts
2
: Correlation coefficient of test set; sts: standard error of test
set; Rm2av: Modified correlation coefficient; T: Threshold
3.2.Without considering influence of various cyclic rings
To develop the robust QSAR model without any influence of cyclic rings on inhibitory activity the selected optimal (T* and N*epoch) was considered. The best model is given as below.
0.008( 0.010) 0.022( 0.00007) (4,5)
i
pK DCW
(4)
Training set: n = 202; R2 = 0.687; s = 0.598; F = 439; Q2 = 0.681; Rm
2
= 0.562; CR2p =
0.686
Calibration set: n = 67; R2 = 0.700; s = 0.769; F = 152; Rm
2
= 0.521; CR2p = 0.693
Test set: n = 65; R2 = 0.576; s = 0.601, F = 47; Rm2 = 0.521; CR2p = 0.543
External set: n = 70; R2 =0.668; s = 0.746, F = 137; Rm
2
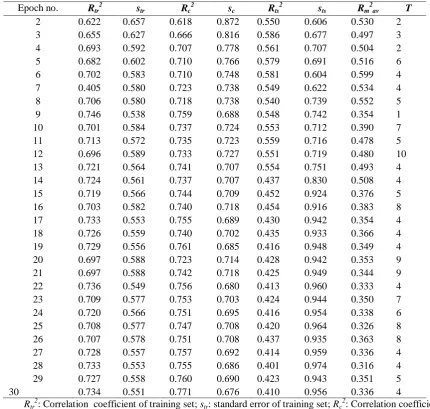
1412 Table 2: Statistical parameters of training, calibration and test set to search T* and N*epoch for with influence of cyclic rings on inhibitory activity
Epoch no. Rtr2 str Rc2 sc Rts2 sts Rm2av T
2 0.622 0.657 0.618 0.872 0.550 0.606 0.530 2 3 0.655 0.627 0.666 0.816 0.586 0.677 0.497 3 4 0.693 0.592 0.707 0.778 0.561 0.707 0.504 2 5 0.682 0.602 0.710 0.766 0.579 0.691 0.516 6 6 0.702 0.583 0.710 0.748 0.581 0.604 0.599 4 7 0.405 0.580 0.723 0.738 0.549 0.622 0.534 4 8 0.706 0.580 0.718 0.738 0.540 0.739 0.552 5 9 0.746 0.538 0.759 0.688 0.548 0.742 0.354 1 10 0.701 0.584 0.737 0.724 0.553 0.712 0.390 7 11 0.713 0.572 0.735 0.723 0.559 0.716 0.478 5 12 0.696 0.589 0.733 0.727 0.551 0.719 0.480 10 13 0.721 0.564 0.741 0.707 0.554 0.751 0.493 4 14 0.724 0.561 0.737 0.707 0.437 0.830 0.508 4 15 0.719 0.566 0.744 0.709 0.452 0.924 0.376 5 16 0.703 0.582 0.740 0.718 0.454 0.916 0.383 8 17 0.733 0.553 0.755 0.689 0.430 0.942 0.354 4 18 0.726 0.559 0.740 0.702 0.435 0.933 0.366 4 19 0.729 0.556 0.761 0.685 0.416 0.948 0.349 4 20 0.697 0.588 0.723 0.714 0.428 0.942 0.353 9 21 0.697 0.588 0.742 0.718 0.425 0.949 0.344 9 22 0.736 0.549 0.756 0.680 0.413 0.960 0.333 4 23 0.709 0.577 0.753 0.703 0.424 0.944 0.350 7 24 0.720 0.566 0.751 0.695 0.416 0.954 0.338 6 25 0.708 0.577 0.747 0.708 0.420 0.964 0.326 8 26 0.707 0.578 0.751 0.708 0.437 0.935 0.363 8 27 0.728 0.557 0.757 0.692 0.414 0.959 0.336 4 28 0.733 0.553 0.755 0.686 0.401 0.974 0.316 4 29 0.727 0.558 0.760 0.690 0.423 0.943 0.351 5
30 0.734 0.551 0.771 0.676 0.410 0.956 0.336 4
Rtr2: Correlation coefficient of training set; str: standard error of training set; Rc2: Correlation coefficient
of calibration set; sc: standard error of calibration set; Rts 2
: Correlation coefficient of test set; sts:
standard error of test set; Rm2av: Modified correlation coefficient; T: Threshold
Figure 1: Observed and predicted inhibitory activity as per model developed without considering influence of
cyclic rings on pKi
Detailed study of the statistical parameters it can be found that selected model was statistically robust in nature. The correlation coefficient (R2) of training, test, calibration and external sets were found to be 0.687, 0.700, 0.582 and 0.668 respectively. High R2
1413 Figure 2: Radar plot showing fitness of observed and
predicted inhibitory activity of training, test, calibration and external sets
The detailed exploration of DCW from the best model developed without considering any influence of cyclic rings on the inhibitory activity explained that components “+ + + + B2--B3= =”, “+ + + +F- - -Cl= =” and “+ + + +S- - - SB3 = = =”, “+ + + +CL- -S= = =” and “+ + + +Cl--B2= =” were found to be positive impact, while ++++F---N= = =” and “+ + + +F- - -S= = =” showed negative impact on the inhibitory activity. The “BOND10000000”, “BOND10100000” and “BOND11100000” components were also showed positive influence towards the inhibition of BACE1. Absence of halogens characterized by the component “HALO00000000” decreases the pKi. Presence of
nitrogen and oxygen together give positive influence on inhibition of BACE1. On other hand impact of presence of nitrogen (“NOSP01000000”) and oxygen (“NOSP11000000”) separately showed positive impact towards the pKi.
3.3.With considering influence of various cyclic rings
According to selected best epoch number and threshold value the best QSAR model with the influence of cycling rings on inhibitory activity was developed as given below.
0.020( 0.009) 0.029( 0.0001) (5, 6)
i
pK DCW
(5) Training set: n = 202; R2 = 0.706; s = 0.580; F =
479; Q2 = 0.700; Rm2 = 0.599; CR2p=
0.703
Calibration set: n = 67; R2 = 0.714; s = 0.751; F = 162; Rm2 = 0.593; CR2p = 0.706
Test set: n = 65; R2 = 0.582; s = 0.603; F = 96;
Rm2 = 0.598; CR2p = 0.578
External set: n = 70; R2 = 0.709; s = 0.689; F = 166; Rm2 = 0.604
The quality of the model was verified by the statistical parameters of QSAR model. High cross-validated correlation coefficient (Q2 = 0.690) of training set
clearly explained that robustness of the model. The experimental and predicted inhibitory activity of the training, test, calibration and external set are given in Figure 3 and Table S2 (Supplementary file). Experimental and predicted inhibitory activities plotted in radar plot and given in Figure 4.
Figure 3: Observed and predicted inhibitory activity as per model developed with considering influence of
cyclic rings on pKi
After model development the DCW were explored in details. It was observed that “+ + + +F- - -B3= =”, “+ + + +F- - -B3= =” showed negative influence for inhibition of BACE1 whareas as “+ + + +F-- -Cl= =”, “+ + + +CL- -N= = =”, “+ + + +Cl- -O= = =”, “+ + + +CL- -S= = =” and “+ + + +S- - -B3= =” increase the value of pKi.It was observed that “BOND10000000”
gives positive influence on pKi but “BOND10100000”
and “BOND11100000” have no sigficant contribution on the pKi. Only combined presence of fluorine and
chlorine (“HALO11000000”) was found to be negatively favorable on inhibitory activity. Negative contribution of DCW value of all three components, “NOSP10000000”, “NOSP11000000” and “NOSP11100000” explained that presence of nitrogen, oxygen and sulphur give nagative impact for the inhibition of BACE1 enzyme.
Figure 4: Radar plot showing fitness of observed and predicted inhibitory activity of training, test,
1414 The statistical parameters of both models were
explored and it was observed that the correlation coefficient of training, test, calibration and external sets showed higher value for the model developed with considering the influence of cyclic rings compare to the model developed without considering influence of cyclic rings on the inhibitory activity. Further high
Rm2avg value also recorded in case of model developed
with considering the cyclic rings. Therefore based on statistical parameters it can be explained that presence of cyclic rings in the BACE1 inhibitors have importance for inhibition of BACE1.
4. CONCLUSION
A large dataset of BACE1 inhibitors were collected from the Binding database. To develop statitically robust QSAR models the online free CORAL software was used. The descriptors were extracted from the SMILES format of the molecular staructure. By considering influence and without influence of cyclic rings on inhibitory activity two QSAR models were developed. Statistical parameters of both models clearly substantiated that models were statistically robust and efficient enough to predict the inhibitory activity of BACE1 molecules. The DCW were explored and found that with variation of molecular structure the inhibitory activity increase or decrease the biological activity which suggest the mechanistic interpretation of the both models. From above it can be concluded that important molecular fragmanets can play crucial protagonist to design new promising BACE1 inhibitors for the therapeutic applications in Alzheimer’s disease.
5. ACKNOWLEDGMENT
One of the authors, Md L. Islam would like to thank Head of the Department, Department of Computer Engineering, MH Saboo Siddik College of Engineering, Byculla, Mumbai for providing research facilities.
REFERENCES
1. Reitz, C., Mayeux, R. Alzheimer disease: epidemiology, diagnostic criteria, risk factors and biomarkers. Biochem Pharmacol. 2014, 88, 640-51.
2. Santana, I., Farinha, F., Freitas, S., Rodrigues, V., Carvalho, A. [The Epidemiology of Dementia and Alzheimer Disease in Portugal: Estimations of Prevalence and Treatment-Costs]. Acta Med Port. 2015, 28, 182-8.
3. Alzheimer's, A. 2015 Alzheimer's disease facts and figures. Alzheimers Dement. 2015, 11, 332-84.
4. Chiang, K., Koo, E.H. Emerging therapeutics for Alzheimer's disease. Annu Rev Pharmacol Toxicol. 2014, 54, 381-405.
5. Selkoe, D.J. Alzheimer's disease: genes, proteins, and therapy. Physiol Rev. 2001, 81, 741-66. 6. Ghosh, A.K., Osswald, H.L. BACE1
(beta-secretase) inhibitors for the treatment of Alzheimer's disease. Chem Soc Rev. 2014, 43, 6765-813.
7. Vassar, R., Bennett, B.D., Babu-Khan, S., Kahn, S., Mendiaz, E.A., Denis, P., et al. Beta-secretase cleavage of Alzheimer's amyloid precursor protein by the transmembrane aspartic protease BACE. Science. 1999, 286, 735-41.
8. Cui, H., Hung, A.C., Klaver, D.W., Suzuki, T., Freeman, C., Narkowicz, C., et al. Effects of heparin and enoxaparin on APP processing and Abeta production in primary cortical neurons from Tg2576 mice. PLoS One. 2011, 6, e23007. 9. Luo, Y., Bolon, B., Kahn, S., Bennett, B.D.,
Babu-Khan, S., Denis, P., et al. Mice deficient in BACE1, the Alzheimer's beta-secretase, have normal phenotype and abolished beta-amyloid generation. Nat Neurosci. 2001, 4, 231-2.
10. Christensen, M.A., Zhou, W., Qing, H., Lehman, A., Philipsen, S., Song, W. Transcriptional regulation of BACE1, the beta-amyloid precursor protein beta-secretase, by Sp1. Mol Cell Biol. 2004, 24, 865-74.
11. Nishitomi, K., Sakaguchi, G., Horikoshi, Y., Gray, A.J., Maeda, M., Hirata-Fukae, C., et al. BACE1 inhibition reduces endogenous Abeta and alters APP processing in wild-type mice. J Neurochem. 2006, 99, 1555-63.
12. Zivkovic, J.V., Trutic, N.V., Veselinovic, J.B., Nikolic, G.M., Veselinovic, A.M. Monte Carlo method based QSAR modeling of maleimide derivatives as glycogen synthase kinase-3beta inhibitors. Computers in biology and medicine. 2015, 64, 276-82.
13. Randic, M., Basak, S.C. A new descriptor for structure-property and structure-activity correlations. Journal of chemical information and computer sciences. 2001, 41, 650-6.
14. Junkes Bda, S., Arruda, A.C., Yunes, R.A., Porto, L.C., Heinzen, V.E. Semi-empirical topological index: a tool for QSPR/QSAR studies. Journal of molecular modeling. 2005, 11, 128-34.
15. Ivanciuc, O. Chemical graphs, molecular matrices and topological indices in chemoinformatics and quantitative structure-activity relationships. Current computer-aided drug design. 2013, 9, 153-63.
1415 methodology and encoding rules. Journal of
chemical information and modeling. 1988, 28, 31-6.
17. Weininger, D., Weininger, A., Weininger, J.L. SMILES. 2. Algorithm for generation of unique SMILES notation Journal of chemical information and modeling. 1989, 29, 97-101.
18. Weininger, D. SMILES. 3. Depict. Graphical depiction of chemical structures. Journal of chemical information and modeling. 1990, 30, 237-43.
19. Toropov, A.A., Benfenati, E. SMILES in QSPR/QSAR Modeling: results and perspectives. Current drug discovery technologies. 2007, 4, 77-116.
20. Toropov, A.A., Benfenati, E. SMILES as an alternative to the graph in QSAR modelling of bee toxicity. Computational biology and chemistry. 2007, 31, 57-60.
21. Veselinovic, A.M., Veselinovic, J.B., Zivkovic, J.V., Nikolic, G.M. Application of SMILES Notation Based Optimal Descriptors in Drug Discovery and Design. Current topics in medicinal chemistry. 2015, 15, 1768-79.
22. Toropov, A.A., Toropova, A.P., Diaza, R.G., Benfenati, E., Gini, G. SMILES-based optimal descriptors: QSAR modeling of estrogen receptor binding affinity by correlation balance. Structural Chemistry. 2012, 23, 529–44.
23. Veselinovic, A.M., Milosavljevic, J.B., Toropov, A.A., Nikolic, G.M. SMILES-based QSAR models for the calcium channel-antagonistic effect of 1,4-dihydropyridines. Archiv der Pharmazie. 2013, 346, 134-9.
24. Veselinovic, A.M., Milosavljevic, J.B., Toropov, A.A., Nikolic, G.M. SMILES-based QSAR model for arylpiperazines as high-affinity 5-HT(1A) receptor ligands using CORAL. European journal of pharmaceutical sciences : official journal of the European Federation for Pharmaceutical Sciences. 2013, 48, 532-41.
25. Veselinovic, J.B., Toropov, A.A., Toropova, A.P., Nikolic, G.M., Veselinovic, A.M. Monte carlo method-based QSAR modeling of penicillins binding to human serum proteins. Arch Pharm (Weinheim). 2015, 348, 62-7.
26. Worachartcheewan, A., Mandi, P., Prachayasittikul, V., Toropova, A.P., Toropov, A.A., Nantasenamat, C. Large-scale QSAR study of aromatase inhibitors using SMILES-based descriptors. Chemometrics and Intelligent Laboratory Systems. 2014, 138, 120-6.
27. Li, Q., Ding, X., Si, H., Gao, H. QSAR model based on SMILES of inhibitory rate of 2, 3-diarylpropenoic acids on AKR1C3. Chemometrics and Intelligent Laboratory Systems. 2014, 139, 120-6.
28. Toropova, A.P., Toropov, A.A., Veselinovic, J.B., Miljkovic, F.N., Veselinovic, A.M. QSAR models for HEPT derivates as NNRTI inhibitors based on Monte Carlo method. European journal of medicinal chemistry. 2014, 77, 298-305.
29. Lipinski, C.A., Lombardo, F., Dominy, B.W., Feeney, P.J. Experimental and computational approaches to estimate solubility and permeability in drug discovery and development settings. Advanced drug delivery reviews. 2001, 46, 3-26. 30. Veber, D.F., Johnson, S.R., Cheng, H.Y., Smith,
B.R., Ward, K.W., Kopple, K.D. Molecular properties that influence the oral bioavailability of drug candidates. Journal of medicinal chemistry. 2002, 45, 2615-23.
31. Toropova, M.A., Toropov, A.A., Raska, I., Jr., Raskova, M. Searching therapeutic agents for treatment of Alzheimer disease using the Monte Carlo method. Comput Biol Med. 2015, 64, 148-54.
32. Kubinyi, H., Hamprecht, F.A., Mietzner, T. Three-dimensional quantitative similarity-activity relationships (3D QSiAR) from SEAL similarity matrices. Journal of medicinal chemistry. 1998, 41, 2553-64.
33. Roy, K., Mitra, I., Kar, S., Ojha, P.K., Das, R.N., Kabir, H. Comparative studies on some metrics for external validation of QSPR models. Journal of chemical information and modeling. 2012, 52, 396-408.
34. Ojha, P.K., Mitra, I., Das, R.N., Roy, K. Further exploring rm2 metrics for validation of QSPR models. Chemometrics and Intelligent Laboratory Systems. 2011, 107, 194-205.