Volume 7, No. 7, Nov-Dec 2016
International Journal of Advanced Research in Computer Science
RESEARCH PAPER
Available Online at www.ijarcs.info
Bank Note Authentication: A Genetic Algorithm Supported Neural based Approach
Spandan Sen Sarma Department of Information Technology
Academy of Technology Aedconagar, Hooghly – 712121, India
Abstract: Recent research works have focused on detection of authenticity of Bank Notes using several machine learning techniques. Accurate separation of original notes from the forged one is a challenging job. In the present work Neural Network (NN) has been trained using Genetic algorithm (GA employed to detect authenticity of bank notes by classifying them into two separate classes. The initial weight vector to the input layer of the NN has been optimized gradually using the optimization techniques to enhance the performance of NN to a greater extent. The experimental results of the proposed method have been compared with a well-known Multilayer Perceptron Feed-Forward Network (MLP-FFN) and also with the NN. Performance measures like accuracy, precision, recall and F-measure have been used to compare the performances of the algorithms. The experimental results have revealed significant improvement over the existing performances to detect forgery of bank notes using GA.
Keywords: Bank Note Authentication; Genetic Algorithm; ANN; MLP-FFN; Gradient Descent
I. INTRODUCTION
Despite of relatively low incidence of forgery, there are still some forged banknotes in circulation and has become a serious threat to our society. The advancement in digital image processing [22] plays a significant role in producing ever increasing number of fake banknotes every year [1, 8]. The main challenge is how to identify and classify that the banknotes are real or forged? In the current work, an efficient method for detection of real or forged banknotes has been proposed.
Recent automatic machines which accept banknotes are developed to meet several functions. These machines recognize banknotes by identifying the design or value of the banknotes. In general, authentication is more difficult than recognition, since the differences in recognizing the differences between designs or values of real and forged notes are difficult.
Prime et al.[2] reported that the perfect forgery has never been detected. The forger does not need to reproduce the actual note, instead only produce a simulation that can be passed at least once. Durability is not a concern but must acquire a number of compromises by the resources and skills available. As banknotes are not designed to be used primarily with automatic identification techniques, the features of the banknotes which are used for identification are chosen on an empirical basis. That implies there is no simple method by which these features can be fetched to determine whether the banknotes are valid or not.
Yeh et al. [3] proposed a system based on multiple-kernel support vector machines for forged banknote recognition. A support vector machine (SVM) to minimize false rates is developed. Experiments with Taiwanese banknotes show that the proposed approach outperforms single-kernel SVMs, standard SVMs with SDP, and multiple-SVM classifiers.
While Hassanpour et al.[4] proposed a new feature extraction technique for paper currency recognition. In this technique, the texture characteristic is used in the recognition. The Markov chain concept has been employed to model the texture of paper currencies as a random process. The method proposed in this paper can be used for recognizing paper currencies from different countries. In these circumstances for this research, the author proposed to use neural network to classify the real or forged banknotes,.
Studies about the Banknote Authentication using Artificial Neutral Network (ANN) have already been conducted. They provide method/s, which is/are helpful for banknote authenticating or protecting physical. But those methods are not suitable as they did not achieve reasonable accuracy. In this research, the data were extracted from images that were taken for the evaluation of an authentication procedure for banknotes. This data will be implemented using the Artificial Neural Network supported by Genetic Algorithm technique to classify the banknotes whether it is real or forged.
The goal of this research is to overcome the problem of premature convergence of ANNs which effectively reduces its performance in classification jobs. To overcome the problem Genetic Algorithm has been employed in the training phase of the ANNs to find the optimal set of weight vectors of ANNs. Being a global optimization technique GA ensures better performance of ANN in classification task. The data is taken from “Banknotes Authentication Data Set” and the source is from UCI Machine Learning Repository and is publicly available.
measurement parameters like accuracy, precision, recall and F-measure.
II. PROPOSED METHODOLOGY
The versatility of hidden layer Neural Networks has been well studied [11, 12, 13]. Though, these studies do not look inside the problem of finding the optimal network to maximize the accuracy of the desired work. The performance of the NN highly depends on the initial weight vector that has been supplied to it at beginning of training phase. Generally, the weight vector is generated randomly keeping its component values within a given range. And different learning algorithms like variable metric, back-propagation, and gradient descent are used to gradually adjust the weights to converge the output to a better result. But the major drawback of using these local search methods is that there is a high possibility of getting trapped into local optima. As these methods tries to minimize one error estimating function gradually, the problem of getting trapped into local minima is obvious. To cope with the problem a global search strategy is required that would judge different possibilities over the search space instead of searching in the vicinity of last found best solution. In the present work we use Genetic Algorithm (GA) to overcome the problem.
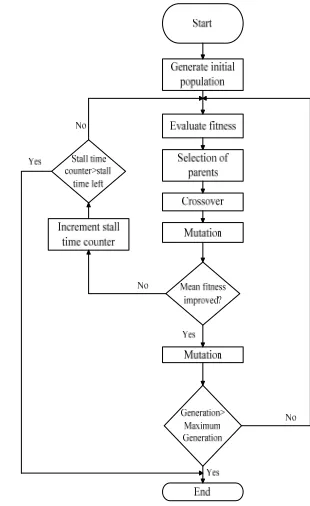
GA was proposed by Holland (1975) to implement the theory of natural selection to solve optimization problems. The GA starts solving a problem by using a set of initial solutions. And it continuously applies crossover and mutations on the solutions to produce better offspring. The survival of any offspring depends on the fitness which is decided by the problem definition of the problem being solved. At each generation the best offspring survives and gradually produces better solutions in later generations until the solution of expected accuracy is reached. The problem of deciding the initial weight vector of the NN is an optimization problem. The GA can be successfully employed to solve the problem. The GA has lesser chance of getting trapped into local optima. Thus, it can be better choice than the traditional methods. The method of applying GA can be summarized as follows;
1. Generation of initial population: ‘N’ numbers of chromosomes are randomly generated. Each chromosome is actually an array of random real weight values, biologically genes; they vary in between ‘0’ to ‘1’.
2. Calculating fitness values: A fitness function has to be defined, using it the fitness of each individual solution (chromosome) has to be evaluated. MSE of NN training is used as the fitness function.
3. Selection: The smaller the MSE, higher is the chance of getting selected for the next generation. denotes the fitness function value of solution. The selection procedure works as follows;
3.1. is calculated for each solution in population. 3.2.All are aggregated or averaged together to find
3.3.A random value ( ) is selected from predefined closed interval
3.4.For all solutions is calculated and if the result of the subtraction is less than or equal to ‘0’ the individual is selected.
3.5.The process goes on until the number of solutions selected for next generation (mating pool) is equal to the number of solutions in the population initially.
4. Cross-over: The selected chromosomes take part in cross-over where the after selecting cross-cross-over points on the chromosome the genes at the right of that point for both the chromosomes taking part get exchanged. And it creates two new individual.
5. Mutation: Genes of same chromosome take part in this phase. Genes from randomly selected position are swapped to create new individual solution.
6. Termination condition: Finally the termination condition is checked. In the present work number of generation has been selected as terminating condition. When the user given number of generation is reached the best possible individual is selected as the optimized weight vector, otherwise it starts from step 2 again.
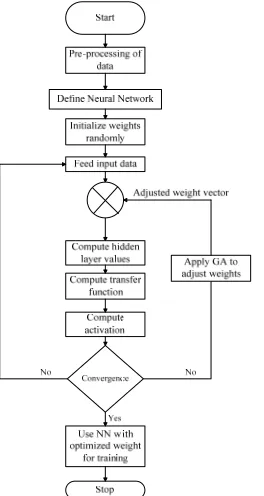
[image:2.612.352.507.356.609.2]The training phase using GA is depicted in Figure 1 while Figure 2 depicts the flow of GA.
Figure. 1. The Genetic Algorithm which has been
Figure. 2. Flowchart of NN training using Genetic algorithm depicted in Figure 3.
III. EXPERIMENTAL METHODOLOGY
A. Preprocessing
The following preprocessing is done on the dataset before the classification.
a) Feature Extraction - This step involves the task of
extracting those attributes which are most important to classify the dataset correctly. For datasets having two or more classes, feature extraction is basically choosing the most effective features which can separate the classes accurately. Class separability depends not only on the class distributions but also on the classifier to be used. For example, the optimum feature set for a linear classifier may not be the optimum set for other classifiers for the same distributions. We assume that we seek the optimum feature set with reference to the Bayes classifier; this will result in the minimum error for the given distributions. Then, class separability becomes equivalent to the probability of misclassification due to the Bayes classifier. Therefore, theoretically, the Bayes error is the optimum measure of feature effectiveness. Also, in practice, the Bayes error calculated experimentally is one of the most popular criteria. That is, having selected a set of features intuitively from given data; estimate the Bayes error in the feature space. A major disadvantage of the Bayes error as a criterion is the fact that an explicit mathematical expression is not available except for a very few special cases. Even for normal distributions, the calculation of the Bayes error involves a numerical integration, except for the equal covariance case.
b) Data Cleaning - The data might contain missing values or
noise. It is important to remove noise and fill up empty entries by suitable data by means of statistical analysis.
c) Data Normalization - the needs to be normalized before
classification task is carried on to reduce distance between attribute values. It is generally achieved by keeping the value range in between -1 to +1.
2. After preprocessing the datasets are divided into two parts. One of which is used as training dataset and the other as testing dataset. In the present work two third (70%) of the data is used as training data and rest (30%) as testing data.
3. In the training phase the training dataset is supplied to different algorithms respectively to build the required classification model.
In the testing phase the classification models obtained from the training phase is employed to test the accuracy of the model.
After we obtain the experimental results it is time to find out the performance of the algorithms which are employed to perform the task. To measure the performance and to compare the performances we use several statistical performance measures like correlation coefficient, accuracy, Kappa statistic, Root mean squared error (RMSE), Mean absolute error, True positive rate (TP rate), and F-measure. The performance measuring parameters are defined as follows;
B. Root Mean Square Error (RMSE)
RMSE [9] is a well-known performance measure which is calculated as the difference between the values anticipated by a classifier and the valuesactually discovered from the surroundings of the system being modeled. The RMSE of a classifier prediction withrespect to the computed variable is determined as thesquare root of the mean-squared error and is given by;
Where, denotes the originally observed value of object and denotes the predicted value by the classifier.
C. Confusion Matrix
The confusion matrix [10] is a tabular representation that provides visualization of the performance of a classification algorithm. Each column of the matrix denotes the examples in a predicted class, while each row indicates the examples in an actual class. This helps to find out any type of misclassification due to the classifier. It provides more detailed analysis than classification accuracy. Classification accuracy is not a reliable metric for assessing the performance of a classifier as it may produce misleading results when the numbers of samples in different classes vary greatly. The confusion matrix entries can be defined as follows;
i. True positive (tp) is the number of ‘positive’ instances categorized as ‘positive’.
ii. False positive (fp) is the number of ‘negative’ instances categorized as ‘positive’.
[image:3.612.116.248.53.301.2]iv. True negative (tn) is the number of ‘negative’ instances categorized as ‘negative’.
TABLE I. Typical Example of Confusion Matrix of A Binary Classification Problem
Predicted Class
Actual Class Positive Negative
Positive tp fp
Negative fn tn
As stated before that the accuracy may not be a good performance parameter hence couple of other parameters which are obtained from the confusion matrix, has been used and are found to be promising. They are as follows;
i. Accuracy
Accuracy is defined as a ratio of sum of the instances classified correctly to the total number of instances.
ii. Precision
Precision is defined as the ratio of correctly classified data in positive class to the total number of data classified as to be in positive class.
iii. Recall
Recall or TP rate is defined as the ratio of to the total number of instances classified under positive class.
iv. F-measure
F-measure is defined as a combined representation of Precision and Recall and is defined as follows;
IV. RESULTS &DISCUSSION
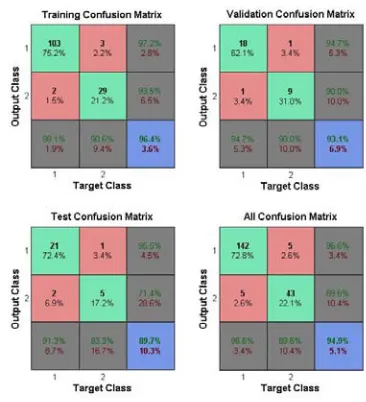
Figure 3 depicts the confusion matrix of training, validation, testing, and overall phases for ‘Bank Note Authentication’ dataset. It is basically a binary classification problem. We apply MLP-FFN to the dataset, and it provides 96.38% accuracy. Figure 5 shows the error histogram for 20
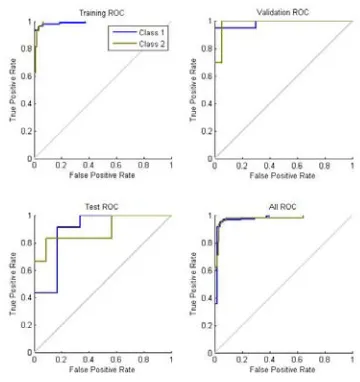
[image:4.612.69.289.104.219.2]bins. It reveals that the error involved during all the phases is almost equal to ‘0’. And it clearly suggests that for classifying such problem MLP-FFN would be a satisfactory choice. Figure 4 depicts a plot of cross-entropy vs. epochs for all three phases. Cross-entropy has been used as the performance estimator. Best performance is achieved at 34th epoch. Figure 6 shows the receiver operating characteristics (ROC) of the same for all three phases. Except test phase ROC all other phases have shown satisfactory performance.
Table II reports the confusion matrix of NN-GA model. Next in Table III a comparative study is reported. It reveals that the NN-GA model has outperformed the other models with greater extent.
Table II. Confusion Matrix of NN-GA Model
Actual Predicted
Parkinson +ve Parkinson -ve
Parkinson +ve 44 2
[image:4.612.324.543.228.291.2]Parkinson -ve 0 12
Table III. Comparison OF Different Models
NN MLP-FFN NN-GA
Accuracy 96.38 94.9 100
Precision 83.33 96.6 100
Recall 92.67 96.6 100
[image:4.612.332.531.331.390.2]F-Measure 87.75 96.6 100
[image:4.612.336.519.435.636.2]Figure. 4 Performance of training, testing and validation phases of MLP-FFN for Bank Note Authentication dataset.
Figure. 5 Error histogram of MLP-FFN for Bank Note Authentication dataset.
Figure. 6 Receiver Operating Characteristic of MLP-FFN for Bank Note Authentication dataset.
V. CONCLUSION
In this paper an efficient detection method of Bank Note has been proposed. To overcome the premature convergence of local optimization methods in training phase of ANNs, Genetic algorithm is engaged to enhance its performance. The proposed model is compared with well-known MLP-FFN classifier. Experimental results suggest that NN-GA model is superior to other models under current study.
VI. REFERENCES
[1] A. Roy, B. Halder, and U. Garain, “Authentication of currency notes through printing technique verification,” Proceedings of the Seventh Indian Conference on Computer Vision, Graphics and Image Processing - ICVGIP ’10, pp. 383–390, 2010.
[2] E. L. Prime and D. H. Solomon, “Australia’s plastic banknotes: fighting counterfeit currency.,” Angewandte Chemie (International ed. in English), vol. 49, no. 22, pp. 3726–36, May 2010.
[3] C.-Y. Yeh, W.-P. Su, and S.-J. Lee, “Employing multiple-kernel support vector machines for counterfeit banknote recognition,” Applied Soft Computing, vol. 11, no. 1, pp. 1439–1447, Jan. 2011.
[4] H. Hassanpour and E. Hallajian, “Using Hidden Markov Models for Feature Extraction in Paper Currency Recognition.”
[5] Sirshendu Hore, Sankhadeep Chatterjee, V. Santhi, Nilanjan Dey, Amira S. Ashour, Valentina E. Balas, Fuqian Shi,\Indian Sign Language Recognition using Optimized Neural Networks", 2015 International Confer-ence on Information Technology and Intelligent Transportation Systems (ITITS 2015), At Xi'an, China, Volume: 455 of the series AISC, pp 553-563, November 2016.
[6] Sankhadeep Chatterjee, Sirshendu Hore, Nilanjan Dey, Sayan Chakraborty, Amira S. Ashour, “Dengue Fever Classication using Gene Expression Data: A PSO based Articial Neural Network Approach". 5th International Conference on Frontiers in Intelligent Computing: Theory and Applications; Springer, June 2016. (in press).
[7] Sirshendu Hore, Sankhadeep Chatterjee, Rahul Kr. Shaw, Nilanjan Dey, Jitendra Virmani, “Detection of Chronic Kidney Disease: A NN-GA based Approach", CSI - 2015; 50th Golden Jubilee Annual Convention, At Delhi, Volume: Springer - AISC, November 2015. (in press). [8] Sirshendu Hore, Sankhadeep Chatterjee, Shouvik
Chakraborty, Rahul Kumar Shaw, “Analysis of Di erent Feature Description Algorithm in Object Recognition". Feature Detectors and Motion Detection in Video Processing, A volume in the Advances in Multimedia and Interactive Technologies (AMIT) Book Series, IGI Global, 2017. (in press).
[9] Armstrong JS, Collopy F. Error measures for generalizing about forecasting methods: empirical comparisons. Int. J Forecast, 8:69–80, 1992.
[10] Stehman SV. Selecting and interpreting measures of thematic classification accuracy. Remote SensEnviron,62(1):77–89, 1997.
[11] Hornik K., Multilayer Feedforward Networks are universal Approximators, Neural Networks, Vol. 2, pp.359-366, 1989.
[13] White H., Connectionist Nonparametric regression: multilayer feedforward network can learn arbitrary mappings, Neural Networks, Vol. 3, pp. 535-549, 1990. [14] Chatterjee, S., Chakraborty, R., Dey, N., & Hore, S.
(2015). A quality prediction method for weight lifting activity.
[15] Chatterjee, S., Sarkar, S., Hore, S., Dey, N., Ashour, A. S., & Balas, V. E. (2016). Particle swarm optimization trained neural network for structural failure prediction of multistoried RC buildings. Neural Computing and Applications, 1-12.
[16] Chatterjee, S., Ghosh, S., Dawn, S., Hore, S., & Dey, N. (2016). Forest Type Classification: A Hybrid NN-GA Model Based Approach. In Information Systems Design and Intelligent Applications (pp. 227-236). Springer India. [17] Hore, S., Chatterjee, S., Sarkar, S., Dey, N., Ashour, A.
S., Balas-Timar, D., & Balas, V. E. (2016). Neural-based prediction of structural failure of multistoried RC buildings. Structural Engineering and Mechanics, 58(3), 459-473.
[18] Chakraborty, R., Paladhi, S., Chatterjee, S., & Banerjee, S. (2014). An Optimized Algorithm for Solving Combinatorial Problems using Reference Graph. IOSR Journal of Computer Engineering, 16(3), 1-7.
[19] Chatterjee, S., Paladhi, S., Hore, S., & Dey, N. (2015, March). Counting all possible simple paths using Artificial Cell division mechanism for directed acyclic graphs. In Computing for Sustainable Global Development (INDIACom), 2015 2nd International Conference on (pp. 1874-1879). IEEE.
[20] Chatterjee, S., & Banerjee, D. (2014). A Novel Boolean Expression based Algorithm to find all possible Simple Paths between two nodes of a Graph. International Journal of Advanced Research in Computer Science, 5(7).
[21] Chatterjee, S., Paladhi, S., & Chakraborty, R. A Comparative Study On The Performance CharacteristicsOf Sudoku Solving Algorithms.
[22] Sirshendu Hore, Souvik Chakraborty, Sankhadeep Chatterjee, Nilanjan Dey, Amira S. Ashour, Le Van Chung, and Dac-Nhuong Le. \An Integrated Interactive Technique for Image Segmentation using Stack based Seeded Region Growing and Thresholding." International Journal of Electrical and Computer Engineering (IJECE) 6, no. 6 (2016).