Drawing Nomograms with R: applications to categorical outcome and survival data
Full text
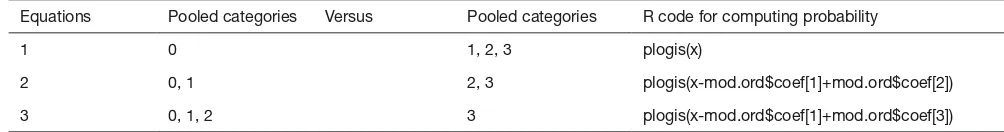
Figure


Related documents
Types of Aviation Economic Impact Measured Airports Visitors Construction Military Aviation Air Cargo Aviation Education Aviation Businesses Federal Aviation
Furthermore, the Bayes factor tests provided strong evidence that we replicated the findings of Koldewyn and colleagues [16] and that the observed lower FA value in the right ILF
In addition to supporting the dynamic download of kernels and root file systems through the ST Micro Connect, the STLinux distribution contains a version of Das U-Boot boot
The potential of biological control to manage Old World climbing fern ( Lygodium microphyllum ), an invasive weed in Florida.
In spite of the scarcity of finds [in fact, no finds] in this area, the rel- atively abundance of Persian period finds along its southern slope, its proximity to the
Jonassen, “A Mathematica Implementation of Nonlinear Dynamical Systems Theory via the Spider Algorithm and Finding Critical Zeros of High-Degree Polynomials,” The Mathemat- ica
62/2008 as amended Plea of guilty Probation Act applied Costs €300.. Fenmac Oil & Transport Ltd T/A
