3381
Predicting Stances from Social Media Posts using Factorization Machines
Akira Sasaki1∗, Kazuaki Hanawa2, Naoaki Okazaki3,4, Kentaro Inui2,5 1Recruit Technologies Co., Ltd., Tokyo, Japan
2Graduate School of Information Sciences, Tohoku University, Miyagi, Japan
3School of Computing, Tokyo Institute of Technology, Tokyo, Japan
4National Institute of Advanced Industrial Science and Technology (AIST), Tokyo, Japan
5RIKEN Center for Advanced Intelligence Project (AIP), Tokyo, Japan
1[email protected] 2{hanawa,inui}@ecei.tohoku.ac.jp 3[email protected]
Abstract
Social media provide platforms to express, discuss, and shape opinions about events and issues in the real world. An important step to analyze the discussions on social media and to assist in healthy decision-making is stance detection. This paper presents an approach to detect the stance of a user toward a topic based on their stances toward other topics and the social media posts of the user. We apply factorization machines, a widely used method in item recommendation, to model user preferences toward topics from the social media data. The experimental results demonstrate that users’ posts are useful to model topic preferences and therefore predict stances of silent users.
1 Introduction
Web and social media provide platforms to express, discuss, and shape opinions about events and issues in the real world. However, these platforms suffer from new emerging problems such as filter bub-ble (Pariser, 2011), echo chamber (Jamieson and Cappella, 2008), and fake news (Lazer et al., 2018). An important step to analyze the argumentation structure of social media and to assist in healthy decision-making is stance detection(Mohammad et al., 2016): predicting whether a given text/user is in favor (agree), against (disagree), or neutral toward a target topic (e.g., Donald Trump).
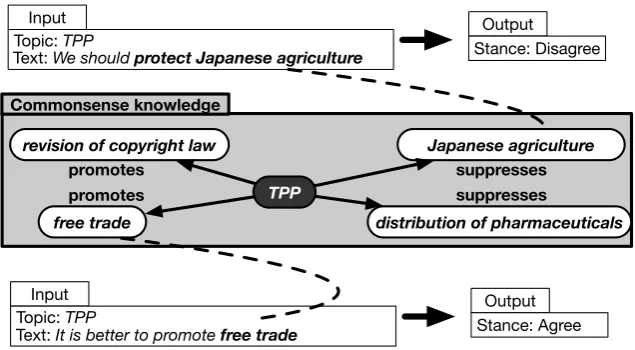
Unfortunately, users rarely make an explicit statement about a topic. For example, computers may easily detect a stance for the topic of the Trans-Pacific Partnership (TPP) from the sentence, “I totally disagree with TPP,” containing the topic word ‘TPP’ with the explicit linguistic pattern “I totally disagree with ...” However, many social media posts may not refer to a topic but only to its related topics, for example, “We should protect Japanese agriculture.” We need commonsense knowledge about the topic (e.g., “TPP suppresses Japanese agriculture”) to predict the stance (objection to TPP) for such a sentence (see Figure 1). Furthermore, social media users are often silent on a topic (Gong et al., 2016): users who are interested in a topic without posting anything related to it are called thesilent majority(Lassiter, 2007) andlurkers(Gong et al., 2015).
This paper presents an approach to detect the stance of a user toward a topic based on: (1) their stances toward other topics, and (2) the social media posts of the user. We apply factorization machines (FMs), a widely used method in item recommendation, to model user preferences toward topics from data consisting of the stance statements and social media posts of users. Contributions of this work are twofold.
1. We present a method to obtain stance statements from tweets and to model topic preferences from the stance statements jointly with the users’ tweets.
2. The experimental results demonstrate that users’ posts are useful to model topic preferences and therefore predict stances of silent users.
∗
Work done while at Tohoku University.
Input Output Text: We should protect Japanese agriculture
Topic: TPP Stance: Disagree
Input Output
Text: It is better to promote free trade
Topic: TPP Stance: Agree
TPP
Japanese agriculture
free trade
revision of copyright law
distribution of pharmaceuticals
promotes promotes
suppresses Commonsense knowledge
suppresses
Figure 1: An example of commonsense knowledge.
2 Related Work
In many previous studies, social media such as Twitter has been used to make various analyses and predictions with respect to politics. Of these, several studies have focused on the analysis of political leaning such as liberal or conservative (Bakshy et al., 2015; Wong et al., 2016) and the prediction of people’s support for parties or candidates during the election period (Tumasjan et al., 2010; Burnap et al., 2016). These studies were realized because social media has become a means for people to publish messages and to acquire information. Furthermore, because social media has become a part of our daily lives, many candidates in the United States presidential election made use of social media to win the election (Hong and Nadler, 2012).
However, few studies have addressed the silent majority (who hardly expresses a stance), limiting the target to users who explicitly expressed their opinions (Gayo-Avello, 2012). In our work, we shed light on the silent majority as well as vocal users (who express stances explicitly). We aim to predict stances of the silent majority by modeling the topic preferences of users with explicit stance statements and ordinary posts.
Stance detection has been extensively studied in recent years as a task to predict a stance of a user or text toward a specific topic (Murakami and Raymond, 2010; Mohammad et al., 2016; Persing and Ng, 2016). However, most studies have depended heavily on labeled training data (Tutek et al., 2016; Liu et al., 2016). Therefore, these methods had difficulty in predicting a stance toward an unseen topic. Accordingly, the SemEval-2016 task 6B released unlabeled data on a topic to be predicted and labeled data on other topics (Mohammad et al., 2016). However, the accuracy on the setting dropped drastically compared with the setting when labeled data for the topic are given. One reason for the relatively low accuracy is that, if no labeled data are available for a new topic, it is impossible to learn expressions that may imply stances for that topic.
One way to overcome this problem is to incorporate external knowledge about the topics. The most relevant work is our previous work (Sasaki et al., 2017). Main goal of this work was to acquire knowl-edge such as“those who agree with the TPP also agree with free trade.” We called such knowledge “inter-topic preferences.” We used texts on Twitter and modeled inter-topic preferences using matrix factorization. As a side effect of this modeling, we were able to predict the missing stances of users by considering users’ explicit stances toward other topics. However, the method of this previous work cannot be applied to the silent majority, who does not explicitly express any stances.
User 1
User 2 (the silent majority)
domestic consumption information disclosure
TPP
specific secret protection act
Agree Disagree
...
user’s posts
record 1 record 2 record 3 record 4
Agree Disagree
? ?
Factorization Machines (FMs)
Agree Disagree
train
predict
...
encode user’s posts in features extract stance statements
of users
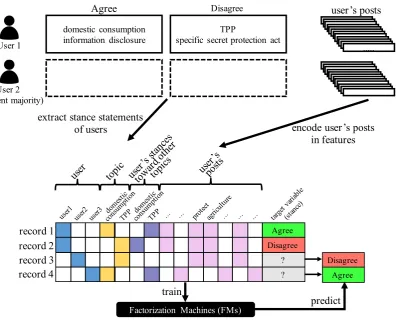
Figure 2: The overview of the proposed method.
They asked the following questions to the users of social media: whether they are interested in specific issues (e.g., healthcare cost and retirement); and whether they have posted on those issues on Twitter or Facebook. In contrast to their work covering only seven issues, we deal with more than 1000 topics. In addition, our method automatically learns the relationships between stances and users’ posts. Our method is a versatile method applicable to multiple topics and users, including the silent majority.
Predicting stances of the silent majority is similar to thecold-start problemin item recommendation: recommending items to users who have not purchased any items in the past (Schein et al., 2002; Lam et al., 2008). In order to overcome this problem, a recommendation incorporating not only the purchase history of items but also other contexts has been extensively studied as acontext-aware recommenda-tion (Adomavicius and Tuzhilin, 2015). One method for realizing context-aware recommendation is factorization machines (FMs) (Rendle, 2010; Rendle et al., 2011). In our work, we consider the users’ posts ascontextin item recommendation.
3 Proposed Method
1
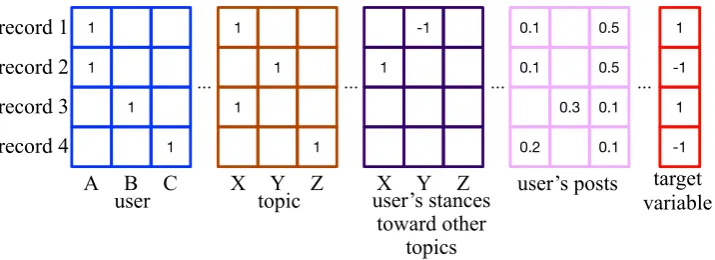
Figure 3: An example of an input of factorization machines.
stances.
In order to model stance statements and users’ posts jointly to predict user-level stances, we apply factorization machines (FMs), a widely used and scalable method for recommendation and click-through rate (CTR) predictions, etc. More specifically, we consider that a stance for a topic to analogously correspond to a like/dislike of an item and that a user’s post provides additional information for item recommendation. In this section, we first review the formalization of FMs and present definitions of records as an input for FMs. In addition, we explain the details of the linguistic patterns to detect stance statements and the feature extractions used to encode users’ posts into FMs.
3.1 Background: factorization machines
FMs predicts a target value (e.g., a rating in item recommendation or a rate in CTR prediction) from
n variables (e.g., features of the item) x1, ..., xn. FMs use second-order feature combinations xixj
(i, j ∈ {1, ..., n}) as well as first-order features xi (i ∈ {1, ..., n}). Formally, FMs compute a target
of thei-th variable,vi ∈ Rdpresents the weight vector used for second-order feature combinations, d
is the number of dimensions of the weight vectors, andhvi, vjidenotes a dot product of two vectorsvi
andvj. We usetffm1to train a model (i.e., to find the parametersw0, ..., wnandv1, ..., vnfor the given
supervision data).
3.2 Applying factorization machines to our task
In order to apply FMs to user-level stance detection, we assume a target variable to present the stance of a user toward a topic:+1(a positive stance to the topic) and−1(a negative stance to the topic). The user and topic are represented as features for the input to FMs. In this work, we define four types of variables to build arecordfor FMs: user, topic, user’s stances toward other topics, and user’s posts. Figure 3 shows an example of input records. We describe each type of variable in detail.
user
We define a variable to identify each user in the data. We set1to the variable corresponding to the user of a record and0to the other variables in this category.
topic
We also define a variable for each topic in the data. We set1to the variable for which the target variable presents a stance. Given that a record is associated with a topic, only one variable in this category is set to1and one of the variables in this category must be1.
This category of variables indicates stances of the user toward other topics. The number of variables in this category is the same as that in the topic category. A value of this category ranges from−1
(negative to the topic) to+1(positive to the topic). We will explain the values of these features in detail in Section 3.3.
user’s posts
Variables in this category encode textual features of posts sent by the user. We describe these variables in detail in Section 3.4.
Let us consider an example where the user A is favor to the topic X, but against to the topic Y. Figure 3 illustrates records for this example. Record 1 presents the stance toward topic X as the target variable and the stance toward Y as other topics. Similarly, record 2 presents the stance toward topic Y as the target variable and the stance toward X as other topics. Given that records 1 and 2 are for the same user, the values for the user’s posts are essentially the same. When we ignore the features of the user’s posts for simplicity, Equation 3 for the first record is,
1 =w0+wuser:A+wtopic:X−wother:Y
+hvuser:A, vtopic:Xi − hvtopic:X, vother:Yi − hvother:Y, vuser:Ai.
(2)
Here,user : A,topic : X, andother : Ypresent the index numbers of features indicating that the user is A, the topic of the target variable is X, and the stance for the other topic is Y, respectively. Similarly, Equation 3 for the second record is,
−1 =w0+wuser:A+wtopic:Y+wother:X
+hvuser:A, vtopic:Yi+hvtopic:Y, vother:Xi+hvother:X, vuser:Ai,
(3)
wheretopic : Yandother : Xdenote the index numbers of features indicating that the topic of the target variable is Y, and the stance for the other topic is X, respectively.
3.3 Extracting stance statements of users
In order to obtain data for target variables and stances on other topics, we extract stance statements of users from SNS data. Throughout this work, we use SNS data consisting of 1,763,164,770 Japanese tweets (444,321 users) crawled from February 6, 2013, to September 30, 20162.
Given that Twitter does not have an option to store an explicit indicator about a stance, we use a set of 200 linguistic patterns to automatically extract stance statements from tweets (Sasaki et al., 2017)3. The patterns were manually designed to extract stance statements with high-precision and low-recall, for example, “support X” (positive to X) and “X is terrible” (negative to X). We compute a stance value for a user toward a topic as,
(#pos−#neg)
(#pos + #neg). (4)
Here, #posand#negpresent the number of tweets from the user that included positive patterns and negative patterns, respectively, accompanying the target topic.
3.4 Encoding users’ posts in features
In order to acquire features based on posts of each user, we focus on posts of users extracted in Section 3.3 not including texts containing positive or negative patterns. Here, tweets including positive or negative patterns are eliminated because, when evaluating the performance of the stance detection for
2
We used the Twitter API to crawl these tweets. We collected 43B Japanese tweets since February 6, 2013 without a specific purpose. Because the volume of the entire crawled tweets is extremely large, we randomly selected one-sixteenth users based on hash values computed from screen names. We removed retweets from the corpus.
Feature type Examples
1-gram war
2-gram (war, bill)
adnominal (terrible, bill)
adjective→noun phrase (long, working hours) noun phrase→adjective (train, plentiful) noun phrase→verb (salary level, return)
Table 1: Examples of features based on users’ posts.
Used information Numbers of stances stated Numbers of stances stated Topic User Other Posts ≥0 ≥5 ≥10 ≥30 ≥50 ≤0 ≤5 ≤10 ≤30 ≤50
X X X X 62.80 62.30 63.35 72.55 85.46 65.35 62.99 62.67 62.66 62.71
X X X 62.62 62.69 63.45 69.78 87.22 64.97 62.53 62.44 62.50 62.52
X X X 63.34 63.22 63.76 73.70 88.11 65.24 63.40 63.21 63.18 63.24
X X 62.97 62.39 63.64 70.59 88.11 65.11 63.14 62.80 62.86 62.87
X X X 65.99 66.40 66.83 74.39 89.43 66.99 65.78 65.81 65.86 65.90
X X 63.95 63.82 63.39 66.44 74.45 65.10 64.10 64.04 63.90 63.91
X X 66.45 66.57 67.23 75.09 88.55 66.91 66.37 66.25 66.31 66.36
Majority baseline 63.67 62.25 60.99 55.82 55.51 65.23 64.47 64.18 63.78 63.70 Matrix factorization (topic&user) 61.12 64.17 64.56 72.55 80.18 54.31 59.63 60.48 60.95 61.05
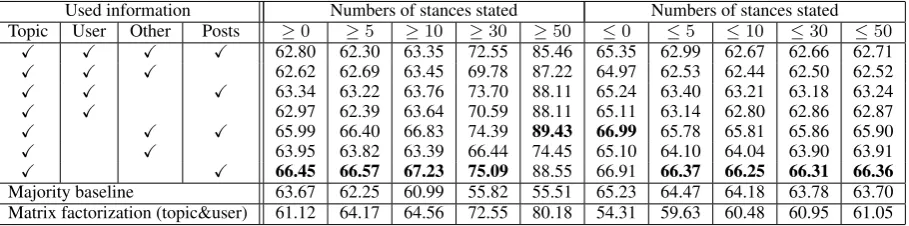
Table 2: Evaluation result of completing missing stances. Each cell presents the accuracy. “Numbers of stances stated” indicates the condition for evaluation. For example, as to≥ 5, we evaluate the per-formance for completing missing stances for users who declared their stances toward no less than five topics. Note that, this treatment is applied only for the test portion of the cross validation.
each topic, these patterns are strong clues and it is thought that a proper evaluation could not be performed if they were included. We perform preprocessing on target tweets using the Japanese dependency parsing toolCaboCha(Kudo et al., 2004)4. We then extracted features about uni-grams, bi-grams and features based on dependencies from posts of each user. Table 1 shows examples of extracted features. Here, we choose only adnominal, adjective→noun phrase, noun phrase→adjective, and noun phrase→verb as features based on dependencies. Verb→noun phrase and triplet such as (subject, predicate, object) are not suitable as features because the number of users using each feature is very small and they become sparse.
4 Evaluation
4.1 Completing missing stances
The first experiment examines how well FMs complete missing stances of users with the additional information from users’ posts. In order to measure the performance of the completion, we hide some stances in the matrix and evaluate the accuracy of the prediction. Given that it is impossible to evaluate users who do not express agreement/disagreement, we only select users who declare stances more than once. As a result, a matrix consisting of 326,202 stances was obtained. There are 130,635 users and 1,142 topics in the matrix. In the evaluation, we use 5% of the rows in this matrix as a validation set for parameter tuning and an early stopping of training. We evaluate the accuracy of a 10-fold cross validation with respect to the remainder of the matrix (95% of the rows).
For comparison, we implemented the majority baseline and matrix factorization. The majority baseline predicts a stance of a user based on the stance of the majority (other users) in the training set. For example, if the number of users who expressed disagreement toward “Article 9” exceeded the number of users who expressed agreement, the majority baseline always predicts “disagreement” toward “Article 9”. For matrix factorization, we use the same parameters as in Sasaki et al. (2017) (k= 100,λP = 0.1,
4We used mecab-ipadic-NEologd (https://github.com/neologd/mecab-ipadic-neologd) as a
0 500 1000 1500 2000 2500 3000 3500 4000 4500 5000
number of used tweets
0.635 0.640 0.645 0.650 0.655 0.660
accuracy
majority baseline
factorization machines (only stances)
Figure 4: Evaluation result for pseudo-silent majority.
λQ= 0.1). Note that, matrix factorization used in Sasaki et al. (2017) cannot incorporate text information
(users’ posts). Therefore, we only use stances of users in the baseline method of matrix factorization. For FMs, we set the number of dimensions of the weight vectorvitod= 8.
Table 2 shows the evaluation result. Here, topics that are extremely biased toward an agreement or a disagreement are thought to be inappropriate for the evaluation because stances on such topics can easily be predicted with even a simple model. Therefore, we performed experiments with limited targets consideringtavg , which is an average stance on a topic in the data. More specifically, we select targets
of−0.5 ≤tavg ≤0.5. Table 2 indicates that, even though the matrix factorization exceeds the majority
baseline for instances with numbers of stances stated≥5, the result was lower than the majority baseline for instances with numbers of stances stated ≤ 5. Conversely, all methods of FMs outperformed the majority baseline in most cases. In addition, for the FMs, users’ posts contributed to increasing the accuracy compared to a method using only users’ stances. From this result, we confirmed that users’ posts are useful clues for predicting their stances.
For instances, without stances stated (numbers of stances stated≤ 0), methods that do not consider users’ posts underperform the majority baseline. Conversely, methods utilizing users’ posts were better than the majority baseline. This suggests that, even for users without stances stated, it is possible to predict their stances for each topic with a certain degree of accuracy if posts of such users are available. Meanwhile, how many posts for each user are sufficient to make a prediction? In Section 4.2, we focus on these users (pseudo-silent majority). Hereafter, we conducted experiments using the model with topic variables and users’ posts variables, which showed the highest performance in numbers of stances stated
≥0.
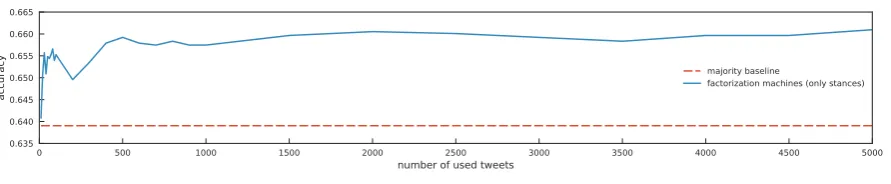
4.2 Evaluation for pseudo-silent majority
In this subsection, we treat users with only one stance as the pseudo silent majority, and perform evalua-tions and analyses. Note that, it would be preferable to evaluate users who did not declare stances at all as the silent majority. However, since it is virtually impossible for a third person to annotate stances of such users, we defined the pseudo silent majority for this experiment.
For the training data, we used all the users who expressed two or more stances. For the test data, we used users who expressed only one stances and posted more than 5,000 tweets. Then, we changed the number of tweets derived from the pseudo-silent majority, and measured the change in accuracy. Figure 4 shows the evaluation result. This result shows that 500 tweets are enough for predicting stances of a silent user.
4.3 The size of the silent majority
0 1 2 3 4 5 6 7 8 9 10 11 12 13 14
#topics
0 50000 100000 150000 200000 250000 300000
#users
Figure 5: Number of topics for which users explicitly declared a stance.
variable usage ρ
topic user other users’ posts —
X X X X 0.0650
X X X 0.0380
X X X 0.0047
X X 0.0402
X X X 0.0935
X X 0.0384
X X 0.2049
matrix factorization (topic&user) 0.2652
(Sasaki et al., 2017) 0.2210
Table 3: Spearman’s rank correlation coefficient (ρ) between human judgments and similarity of feature vectors obtained via our method.
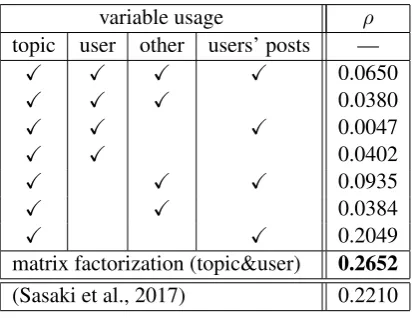
4.4 Inter-topic preference
In FMs, each variable (user, topic, user’s stances to other topics, and users’ posts) is expressed as a feature vector. We examine whether inter-topic preferences (e.g., “those who agree with A also agree with B”) can be derived from the feature vectors. In this subsection, we perform a quantitative evaluation to verify whether the model could acquire inter-topic preferences.
Here, we use the dataset created in Sasaki et al. (2017). This dataset includes inter-topic preferences given by six to ten crowd workers for 450 topic pairs. An inter-topic preference is defined as one of the following: -1 (those who agree/disagree with topic A may conversely disagree/agree with topic B), +1 (those who agree/disagree with topic A may also agree/disagree with topic B), and 0 (no association between A and B). Then, we obtained the average of the values of the multiple workers. We exclude topics that do not exist in the data used in our study. Thus, we used 221 topic pairs as evaluation targets. We calculated Spearman’s rank correlation coefficient (ρ) between manually created scores and sim-ilarities of feature vectors for topic pairs. Table 3 shows the result. The result of the proposed method was are lower than that of matrix factorization. This is probably because the proposed method encourage the model to utilize feature vectors corresponding to users’ posts. In other words, stances are repre-sented not only by vectors of topics but also by vectors of other variables. We would like to examine this phenomenon in more detail in the future.
5 Conclusion
In this work, we focused on posts of users on social media. In the evaluation, we confirmed that posts of users contribute to predicting stances of the users. This work dealt with 444,321 users on Twitter, approximately 70% of which do not express any stances for any topics. Using our proposed method, it is possible to target these users by considering their posts. Therefore, our method is useful for analyzing opinions, including those of the silent majority.
these with distributed representations. In recent years, multiple researchers have tried to build distributed representations of sentences (Logeswaran and Lee, 2018; Hill et al., 2016). These methods are known to demonstrate high performance in many tasks. By incorporating these methods into our proposed method, we will be able to express users’ posts more compactly, and this is expected to improve the accuracy of predicting users’ stances. In addition, FMs used in this work are advantageous because various types of features can be used simultaneously in an input matrix. Therefore, it is expected that social media specific features such as users’ follow-follower relationships, retweet relationships, or profile could be useful information for predicting stances.
Moreover, it is possible to overlook the public opinions including the silent majority for each topic with our proposed method. In the future, we hope to apply our proposed method to newly appearing topics. We can then construct a framework that can monitor public opinions on various topics simultaneously. The above system is expected to be one application of our proposed method.
Acknowledgments
This work was supported by JSPS KAKENHI Grant Number 15H05318, JST CREST Grant Number JPMJCR1301 and AIP Challenge Program, Japan.
References
Gediminas Adomavicius and Alexander Tuzhilin. 2015. Context-aware recommender systems. InRecommender systems handbook, pages 191–226. Springer.
Eytan Bakshy, Solomon Messing, and Lada A. Adamic. 2015. Exposure to ideologically diverse news and opinion on Facebook. Science, 348(6239):1130–1132.
Pete Burnap, Rachel Gibson, Luke Sloan, Rosalynd Southern, and Matthew Williams. 2016. 140 characters to victory?: Using Twitter to predict the UK 2015 general election. Electoral Studies, 41:230–233.
Daniel Gayo-Avello. 2012. “I wanted to predict elections with Twitter and all I got was this lousy paper” - A balanced survey on election prediction using Twitter data. CoRR, abs/1204.6441.
Wei Gong, Ee-Peng Lim, and Feida Zhu. 2015. Characterizing silent users in social media communities. In
Proceedings of the 9th International AAAI Conference on Web and Social Media, pages 140–149.
Wei Gong, Ee-Peng Lim, Feida Zhu, and Pei Hua Cher. 2016. On unravelling opinions of issue specific-silent users in social media. InProceedings of the 10th International AAAI Conference on Web and Social Media, pages 141–150.
Felix Hill, Kyunghyun Cho, and Anna Korhonen. 2016. Learning distributed representations of sentences from unlabelled data. InProceedings of the 2016 Conference of the North American Chapter of the Association for Computational Linguistics: Human Language Technologies, pages 1367–1377.
Sounman Hong and Daniel Nadler. 2012. Which candidates do the public discuss online in an election campaign?: The use of social media by 2012 presidential candidates and its impact on candidate salience. Government Information Quarterly, 29(4):455 – 461.
Kathleen Hall Jamieson and Joseph N. Cappella. 2008. Echo Chamber: Rush Limbaugh and the Conservative Media Establishment. Oxford University Press.
Taku Kudo, Kaoru Yamamoto, and Yuji Matsumoto. 2004. Applying conditional random fields to Japanese morphological analysis. InProceedings of the 2004 Conference on Empirical Methods in Natural Language Processing, pages 230–237.
Xuan Nhat Lam, Thuc Vu, Trong Duc Le, and Anh Duc Duong. 2008. Addressing cold-start problem in recom-mendation systems. InProceedings of the 2nd International Conference on Ubiquitous Information Manage-ment and Communication, pages 208–211.
David M. J. Lazer, Matthew A. Baum, Yochai Benkler, Adam J. Berinsky, Kelly M. Greenhill, Filippo Menczer, Miriam J. Metzger, Brendan Nyhan, Gordon Pennycook, David Rothschild, Michael Schudson, Steven A. Slo-man, Cass R. Sunstein, Emily A. Thorson, Duncan J. Watts, and Jonathan L. Zittrain. 2018. The science of fake news. Science, 359(6380):1094–1096.
Can Liu, Wen Li, Bradford Demarest, Yue Chen, Sara Couture, Daniel Dakota, Nikita Haduong, Noah Kaufman, Andrew Lamont, Manan Pancholi, Kenneth Steimel, and Sandra K¨ubler. 2016. IUCL at SemEval-2016 task 6: An ensemble model for stance detection in Twitter. InProceedings of the 10th International Workshop on Semantic Evaluation, pages 394–400.
Lajanugen Logeswaran and Honglak Lee. 2018. An efficient framework for learning sentence representations. In
Proceedings of the 6th International Conference on Learning Representations.
Saif Mohammad, Svetlana Kiritchenko, Parinaz Sobhani, Xiaodan Zhu, and Colin Cherry. 2016. Semeval-2016 task 6: Detecting stance in tweets. InProceedings of the 10th International Workshop on Semantic Evaluation, pages 31–41.
Akiko Murakami and Rudy Raymond. 2010. Support or oppose?: classifying positions in online debates from reply activities and opinion expressions. InProceedings of the 23rd International Conference on Computational Linguistics, pages 869–875.
Eli Pariser. 2011. The Filter Bubble: How the New Personalized Web Is Changing What We Read and How We Think. Penguin Books.
Isaac Persing and Vincent Ng. 2016. Modeling stance in student essays. InProceedings of the 54th Annual Meeting of the Association for Computational Linguistics, pages 2174–2184.
Steffen Rendle, Zeno Gantner, Christoph Freudenthaler, and Lars Schmidt-Thieme. 2011. Fast context-aware recommendations with factorization machines. InProceedings of the 34th international ACM SIGIR conference on Research and development in Information Retrieval, pages 635–644.
Steffen Rendle. 2010. Factorization machines. InProceedings of the 2010 IEEE International Conference on Data Mining series, pages 995–1000.
Akira Sasaki, Kazuaki Hanawa, Naoaki Okazaki, and Kentaro Inui. 2017. Other topics you may also agree or disagree: Modeling inter-topic preferences using tweets and matrix factorization. In Proceedings of the 55th Annual Meeting of the Association for Computational Linguistics, pages 398–408.
Andrew I Schein, Alexandrin Popescul, Lyle H Ungar, and David M Pennock. 2002. Methods and metrics for cold-start recommendations. InProceedings of the 25th annual international ACM SIGIR conference on Research and development in information retrieval, pages 253–260.
Andranik Tumasjan, Timm Oliver Sprenger, Philipp G Sandner, and Isabell M Welpe. 2010. Predicting elections with Twitter: What 140 characters reveal about political sentiment. InProceedings of the 4th International AAAI Conference on Weblogs and Social Media, pages 178–185.
Martin Tutek, Ivan Sekulic, Paula Gombar, Ivan Paljak, Filip Culinovic, Filip Boltuzic, Mladen Karan, Domagoj Alagi´c, and Jan ˇSnajder. 2016. TakeLab at SemEval-2016 task 6: Stance classification in tweets using a genetic algorithm based ensemble. InProceedings of the 10th International Workshop on Semantic Evaluation (SemEval-2016), pages 464–468.