Improving Hate Speech Detection with Deep Learning Ensembles
Steven Zimmerman, Chris Fox, Udo Kruschwitz
University of EssexWivenhoe Park, Colchester CO4 3SQ, United Kingdom {szimme, foxcj, udo}@essex.ac.uk
Abstract
Hate speech has become a major issue that is currently a hot topic in the domain of social media. Simultaneously, current proposed methods to address the issue raise concerns about censorship. Broadly speaking, our research focus is the area human rights, including the development of new methods to identify and better address discrimination while protecting freedom of expression. As neural network approaches are becoming state of the art for text classification problems, an ensemble method is adapted for usage with neural networks and is presented to better classify hate speech. Our method utilizes a publicly available embedding model, which is tested against a hate speech corpus from Twitter. To confirm robustness of our results, we additionally test against a popular sentiment dataset. Given our goal, we are pleased that our method has a nearly 5 point improvement in F-measure when compared to original work on a publicly available hate speech evaluation dataset. We also note difficulties encountered with reproducibility of deep learning methods and comparison of findings from other work. Based on our experience, more details are needed in published work reliant on deep learning methods, with additional evaluation information a consideration too. This information is provided to foster discussion within the research community for future work.
Keywords:Hate Speech, Reproducibility, Text Classification
1.
Introduction and Motivation
Our research is focused on the development of better meth-ods for protection of freedom of expression in the web do-main and social media while simultaneously reducing ille-gal discrimination. Motivation is provided by the funda-mental human rights (as outlined in articles 19 and 20 of (The United Nations, 1948) and (The United Nations Gen-eral Assembly, 1966)) which simultaneously provide rights to freedom of expression and prevent censorship and illegal discrimination. Automated take down approaches poten-tially infringe upon rights to freedom of expression, such as when a text classifier incorrectly flags a page or post as something to be taken down. Hate speech classifiers are based on annotation methods that are very difficult to de-fine, with questionable reliability (Ross et al., 2017). Even a manual take down approach, such as that used by Face-book, is a challenging task1.Censorship is a potential risk when addressing these issues with automated text classification methods, thus all options should be considered (Benesch, 2017). Actions to filter and block content (e.g. recently implemented laws in Germany and by platforms such as Twitter and Facebook) deemed to be hateful and / or threatening to the online community and society as whole have been taken, which is having negative consequences2.
The goal of our work is to discover simple but effective methods to improve upon existing research in the area of hate speech classification. These methods will be useful in our broader research which tests mechanisms that provide users with feedback about their consumption of potentially
1
See example of task: https://www.nytimes.com/interactive/ 2017/10/13/technology/facebook-hate-speech-quiz.html
2as demonstrated by the recently implemented law in
Germany https://www.economist.com/news/europe/21734410- new-social-media-law-causing-disquiet-germany-silencing-hate-speech-cannot-define-it
hateful material, with the intent of changing their behavior through awareness as a possible alternative to regulation. We include an initial investigation of existing methods for classification of abusive and hateful speech in the domain of Twitter. Additionally, we look into methods from the domain of sentiment analysis, as the classification task is similarly subjective and provides a larger body of research. Our contributions are as follows.
• Experimental results for a deep learning ensemble method that improves F-measure 2% over non-ensemble approaches and a nearly 5% increase over hand crafted methods from authors of a hate speech dataset.
• We provide recommendations for future work by the research community on text classification problems such as hate speech and suggestions for researchers us-ing deep learnus-ing approaches. The recommendations are motivated by discovery of inconsistencies in eval-uation methods and a lack of detail for methods used in previous research that was reviewed for our work.
In the following sections, we provide related background work, methods of implementations, results and analysis of findings.
2.
Background
While lookup of hateful terms in a dictionary is one pos-sible approach (Tulkens et al., 2016) to filter hateful con-tent, such methods are deemed insufficient (Saleem et al., 2016). Text classification methods demonstrate much bet-ter results.
stacking and bagging, are commonly used approaches (Ag-garwal and Zhai, 2012; Xia et al., 2011). In the area of so-cial media, simple but effective ensemble approaches have been used for sentiment classification of Tweets (Hagen et al., 2015). Most relevant to our experiments with neural networks and Twitter data are hybrid models (Badjatiya et al., 2017; Park and Fung, 2017) which combine outputs from different neural networks.
In recent years, efficient algorithms were produced (Mikolov et al., 2013b; Mikolov et al., 2013a; Pennington et al., 2014) that have allowed the use of word embeddings as features for neural networks and other algorithms (e.g. Logistic Regression). There are multiple pre-trained word embedding models available, trained in domains such as news articles (Mikolov et al., 2013b) and Twitter (Godin et al., 2015; Pennington et al., 2014). These unsupervised methods and models have produced significant improve-ments in downstream supervised NLP and text classifica-tion tasks.
These new approaches have allowed for significant im-provements against previous SemEval3message level Twit-ter sentiment analysis test sets (Severyn and Moschitti, 2015; Stojanovski et al., 2015; Vosoughi et al., 2016; Yang and Eisenstein, 2017). Similar improvements have been shown (Badjatiya et al., 2017; Gamb¨ack and Sikdar, 2017; Park and Fung, 2017) using the recently published hate speech datasets (Waseem and Hovy, 2016; Waseem, 2016)4
and note two of the three methods mentioned fail to pro-vide a direct comparison to original findings as test sets were split in a different manner. For all methods reviewed, limited information (if any) was provided regarding net-work weight initialization schemes, which our experiments demonstrate as important information for reproducibility purposes. Similar concerns regarding details of neural net-work configurations have recently been raised in the infor-mation retrieval community as well (Fuhr, 2017). Nonethe-less, use of neural networks and embedding methods is worth exploration by NLP and text mining researchers, as the work of (Badjatiya et al., 2017; Gamb¨ack and Sikdar, 2017; Park and Fung, 2017; Severyn and Moschitti, 2015; Stojanovski et al., 2015; Vosoughi et al., 2016; Yang and Eisenstein, 2017) are just some examples demonstrating strong improvements on previous work that made use of traditional features (e.g. n-grams, part of speech tags, etc.).
3.
Methods
Due to challenges encountered with our own work when tuning and replicating previous work using neural net-works, such as inconsistencies with weight initialization of networks, we decided to take a different approach. Know-ing that neural networks are not guaranteed to find a global
3SemEval is an annual shared task event where researchers
compare methods on various semantic tasks, such as sentiment analysis, sarcasm detection and word sense disambiguation
4
These are two frequently cited hate speech datasets, but only provide limited coverage in the domain of racism and sexism. We note the limited number of test sets currently available for this im-portant task, and note that non-English datasets are further under-resourced
minimum (Goodfellow et al., 2016), coupled with difficul-ties of parameter tuning of networks and having limited computational resources to perform an extensive set of con-figurations, we recalled research in 2015 which produced robust results for Twitter sentiment classification utilizing a simple ensemble method (Hagen et al., 2015). In their work, logistic regression was used to produce 3 models based upon a diverse set of features. The probabilistic out-put for each sentiment classification (positive, negative or neutral) was summed and averaged, with the highest av-erage chosen as the winning classification, which resulted in the best performing solution for the SemEval sentiment classification task in 2015. Similar success with these methods was found with different Twitter sentiment clas-sification tasks by (Balikas and Amini, 2016; Sygkounas et al., 2016) and (Zimmerman and Kruschwitz, 2017). Based on previous successes with this method for classification tasks in Twitter, we hypothesize that similar ensemble methods with neural networks using different weight ini-tializations could also produce improvements for the tasks of hate speech detection in Twitter.
The ensemble model is created in the following manner. First we take soft-max results from each underlying model and sum them together. Then we average the sum of soft-max results, by dividing by the number of models (10 total in our case). With the average soft-max score of all models, the class with highest average is chosen as winning class similar to methods in previous work (Hagen et al., 2015).
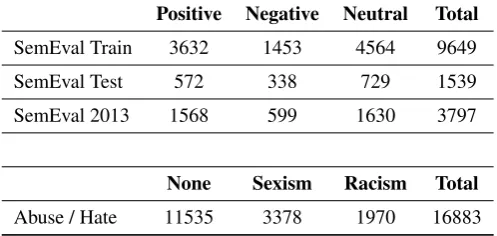
We evaluate our method on two Twitter classification datasets, abusive speech (Waseem and Hovy, 2016) and SemEval 2013 sentiment analysis (Nakov et al., 2013) dataset (Table 1). For the abusive speech dataset, we ini-tially perform experiments on an 85/15 fixed random split on dataset to determine best parameters, then run final ex-periments in the same manner as (Waseem and Hovy, 2016) which evaluated results with 10-fold cross validation. This choice was made to allow for consistent comparison be-tween evaluation scores for each run of our experiments. Additionally, we build ensemble models on the SemEval training and development sentiment test sets and evaluate against the SemEval 2013 test set. We performed this addi-tional experiment to determine if ensemble methods were robust enough to improve results for a different classifica-tion task.
Positive Negative Neutral Total
SemEval Train 3632 1453 4564 9649
SemEval Test 572 338 729 1539
SemEval 2013 1568 599 1630 3797
None Sexism Racism Total
Abuse / Hate 11535 3378 1970 16883
3.1.
Experimental Setup
For our experiments we utilize Python neural network and machine learning libraries. Specifically, Scikit-Learn (Pe-dregosa et al., 2011) is used to create feature representa-tions for input to machine learning algorithms. For the neural network model training, the Keras library (Chol-let, 2015) with Tensorflow (Abadi et al., 2015) back-end was initially used, but switched to Theano (Theano De-velopment Team, 2016) back-end due to a discovery that weight initialization cannot be reproduced, as functionality is currently not available with TensorFlow and Keras. We note that many authors do not publish libraries used in their work, however the lack of reproducibility of results with a Theano and Tensorflow back-end are one important exam-ple demonstrating why this information should be included.
Preprocessing Tweets- Prior to the embedding lookup, all Tweets were preprocessed in the same manner (i.e. tok-enization and normalization of text) to the original texts used to create the embedding model. The raw Tweets are passed through a Tweet tokenizer5assumed to produce out-put similar to tokenizers used by (Godin et al., 2015) to cre-ate an embedding model. Additionally, all URLs, mentions and numbers were normalized to URL , MENTION and NUMBER respectively with the case of the Tweets left unchanged per original methods used for the embedding model (Godin et al., 2015).
Feature Extraction- A benefit of convolutional neural net-work (CNN) classifiers and word embeddings is the ability to consume sequential tokens through concatenation of to-ken embeddings into a matrix(Goldberg, 2016), in contrast to n-gram features which lose the notion of position in a text (aside from immediate neighboring terms for bi/tri-grams). CNN classifiers, in theory, can consume variable length documents. In practice, the choice of software library may make the task of variable length document ingestion impos-sible. As Python Keras was used for experiments, we found it necessary to set the number of tokens into the CNN to a fixed length. It is noted that the mean number of tokens in our datasets was 17 and 22 for hate speech and senti-ment respectively. A pre-experisenti-mental comparison of 30, 50 and 70 tokens as the window length showed 50 tokens having better performance. With this setting, only 5 Tweets for all datasets had tokens cutoff. Investigation of the best window length is a consideration for future work. Each Tweet is represented as a matrixT ⊂Rm×n, wherem=
length of embedding vector andn= maximum tokens taken from Tweet. In cases where tokens in Tweets are<thann, dummy embedding vectors with zeros are used. For the em-bedding model used, a 50 token by length 400 emem-bedding matrix is the output.
Machine Learning Classifier- For the CNN, we consider a very minimal network inspired by previous work (Kim, 2014). The convolution layer has a single 3 token window and 150 filters. Padding is set to ’same’, thus the input and output of convolution layer match in length. The output of the convolution layer is fed into a global max-pooling layer for feature reduction. The max pooling layer feeds into a single hidden layer with 250 units. Glorot uniform
distri-5
Python NLTK Tweet Tokenizer was used
bution is used for weight initialization, which is the default for Keras, with fixed seed settings for reproducibility6. No
regularization is used for the abusive speech dataset, how-ever a dropout rate of 0.2 is applied after the max pooling layer for the SemEval dataset. Beyond pooling and dropout layer are the hidden (250 nodes with ReLu activation) and output (3 nodes with sigmoid activation). The weights are learned with a binary cross-entropy loss function and the adam optimizer.
Evaluation settings- For comparison of the SemEval and abusive speech datasets, we evaluate the configuration with 3 different seed weight initializations chosen arbitrarily. A pre-experiment investigation into parameters demonstrated that improvements in model accuracy generally leveled off around 10 epochs, with small gains and reductions in evalu-ation metrics for epochs beyond this value, thus we focused on 3 epoch settings (3, 5 and 10) not exceeding 10. Batch size had degrading effects on accuracy and time for model convergence as it was increased, notably beyond 100, with similar effects below 10. As such, we chose 4 batch size values within the range of 10 - 100 (10, 25, 50, 100). Re-sources were a limiting factor to perform a more detailed parameter search within these ranges.
We use the best settings (10 epochs and batch size 10) and run 10-fold cross validation on our method to allow direct comparison with the findings of (Waseem and Hovy, 2016) (see cross validation results of these settings in Tables 4 and 5). For comparison of findings on the SemEval dataset, we use the F-1 average score for positive and negative classifi-cations as was done in the original competition.
4.
Results
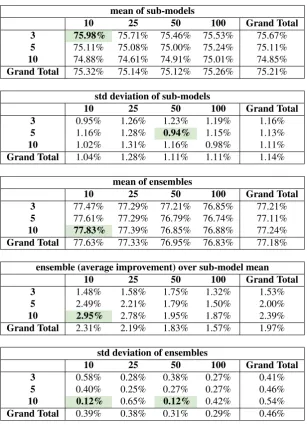
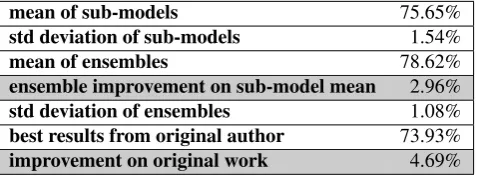
Results abusive speech test set - We review results for multiple ensemble models with variations in seed param-eters, number of epochs and batch size. Table 2 provides a summary of results for the 85/15 split set. In all cases, the ensemble performs better when combining sub-models, with an average of 1.97% gain on F-1. Using the best epoch and batch size settings from the 85/15 split, we ran the en-semble with 10-fold cross validation to directly compare findings with (Waseem and Hovy, 2016). In Table 4 the flattened version of confusion matrices is provided for all 10 ensemble folds, which is useful for researchers that may wish to compare their work using different evaluation met-rics (e.g. unweighted F-measure). Finally, Table 5 provides a direct comparison between the mean weighted macro F-1 measure for 10-fold model run with our ensemble method with the results from (Waseem and Hovy, 2016).
To confirm significance of findings, we produce 99% con-fidence intervals on each set of sub-models used to pro-duce ensemble (10 sub-models for each ensemble) and find only 2 sub-models of all 100 sub-models performs above confidence. Thus, we conclude that with 99% confidence, our ensemble method will perform better than an individual model 98% of the time.
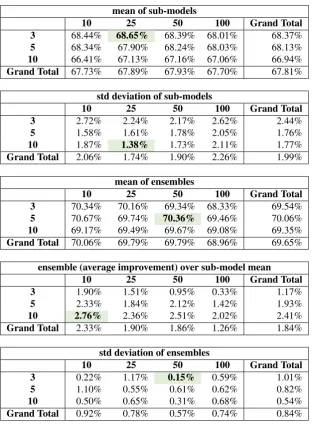
Results SemEval 2013 test set - Analysis and review of the results, in Table 3 further demonstrate the robustness
6Note to other researchers, at time of writing, fixed seed
mean of sub-models
10 25 50 100 Grand Total
3 75.98% 75.71% 75.46% 75.53% 75.67%
5 75.11% 75.08% 75.00% 75.24% 75.11%
10 74.88% 74.61% 74.91% 75.01% 74.85%
Grand Total 75.32% 75.14% 75.12% 75.26% 75.21%
std deviation of sub-models
10 25 50 100 Grand Total
3 0.95% 1.26% 1.23% 1.19% 1.16%
5 1.16% 1.28% 0.94% 1.15% 1.13%
10 1.02% 1.31% 1.16% 0.98% 1.11%
Grand Total 1.04% 1.28% 1.11% 1.11% 1.14%
mean of ensembles
10 25 50 100 Grand Total
3 77.47% 77.29% 77.21% 76.85% 77.21%
5 77.61% 77.29% 76.79% 76.74% 77.11%
10 77.83% 77.39% 76.85% 76.88% 77.24%
Grand Total 77.63% 77.33% 76.95% 76.83% 77.18%
ensemble (average improvement) over sub-model mean
10 25 50 100 Grand Total
3 1.48% 1.58% 1.75% 1.32% 1.53%
5 2.49% 2.21% 1.79% 1.50% 2.00%
10 2.95% 2.78% 1.95% 1.87% 2.39%
Grand Total 2.31% 2.19% 1.83% 1.57% 1.97%
std deviation of ensembles
10 25 50 100 Grand Total
3 0.58% 0.28% 0.38% 0.27% 0.41%
5 0.40% 0.25% 0.27% 0.27% 0.46%
10 0.12% 0.65% 0.12% 0.42% 0.54%
Grand Total 0.39% 0.38% 0.31% 0.29% 0.46%
Table 2: Summary metrics for abusive speech ensembles and sub-models - Provided here are summary metrics (evaluation was based on average F-1 measure of positive and negative classifications) based on batch size and epochs, there were 3 ensembles produced (each with different weight initializations) for each batch size (10, 25, 50 and 100) and epoch (3, 5 and 10) setting, with best highlighted. The standard deviation of ensemble models is reduced from 0.94% for individual model approach to 0.12% for ensemble approach, signaling a strong reduction in variability. We also note a nearly 2 point gain in F-1 score when comparing the mean of all ensembles to mean of sub-models.
of our ensemble method of joining soft-max results from 10 sub-models to produce final classification, with similar improvements. When considering all sentiment models en-sembles compared to individual models, there is an aver-age of 1.84% gain on F-1. We note that our best ensemble model tied the results (F-1 of 71.91) of a computationally complex social network approach produced by (Yang and Eisenstein, 2017).
Impressively, the simple method, when run on both datasets produces an increase of nearly 2% on the evaluation metric. Furthermore, in evaluation of test sets we note the standard deviation is reduced by more than half for the ensemble method, signaling a strong reduction in variability.
The following questions provided guidance for our investi-gation and results. These were addressed with descriptive statistics and direct comparison. Brief summaries of
find-ings are provided for each question.
• RQ 1: Based on experience with weightings and in-consistent results, how much variability in evaluation metrics is found between models with different weight initializations? Standard deviation is the chosen met-ric for variability, which is provided in Tables 2 and 5. Variability for individual model approach with best parameters is found to be +/- 0.94% of the median F-1 measure. For the ensemble approach, standard devia-tion is found to be +/- 0.12% of the median F-1 mea-sure and also improves nearly 2% over best individual model.
soft-mean of sub-models
10 25 50 100 Grand Total
3 68.44% 68.65% 68.39% 68.01% 68.37%
5 68.34% 67.90% 68.24% 68.03% 68.13%
10 66.41% 67.13% 67.16% 67.06% 66.94%
Grand Total 67.73% 67.89% 67.93% 67.70% 67.81%
std deviation of sub-models
10 25 50 100 Grand Total
3 2.72% 2.24% 2.17% 2.62% 2.44%
5 1.58% 1.61% 1.78% 2.05% 1.76%
10 1.87% 1.38% 1.73% 2.11% 1.77%
Grand Total 2.06% 1.74% 1.90% 2.26% 1.99%
mean of ensembles
10 25 50 100 Grand Total
3 70.34% 70.16% 69.34% 68.33% 69.54%
5 70.67% 69.74% 70.36% 69.46% 70.06%
10 69.17% 69.49% 69.67% 69.08% 69.35%
Grand Total 70.06% 69.79% 69.79% 68.96% 69.65%
ensemble (average improvement) over sub-model mean
10 25 50 100 Grand Total
3 1.90% 1.51% 0.95% 0.33% 1.17%
5 2.33% 1.84% 2.12% 1.42% 1.93%
10 2.76% 2.36% 2.51% 2.02% 2.41%
Grand Total 2.33% 1.90% 1.86% 1.26% 1.84%
std deviation of ensembles
10 25 50 100 Grand Total
3 0.22% 1.17% 0.15% 0.59% 1.01%
5 1.10% 0.55% 0.61% 0.62% 0.82%
10 0.50% 0.65% 0.31% 0.68% 0.54%
Grand Total 0.92% 0.78% 0.57% 0.74% 0.84%
Table 3: Summary metrics for ensembles and sub-models evaluated on the SemEval 2013 dataset - Provided here are summary metrics (evaluation was based on average F-1 measure of positive and negative classifications) based on batch size and epochs, there were 3 ensembles produced (each with different weight initializations) for each batch size (10, 25, 50 and 100) and epoch (3, 5 and 10) setting, with best and worst highlighted (best inbold). Overall the standard deviation of ensemble models is reduced to +/- 0.15%, a sharp reduction from standard deviation of individual models and a signal for reduction in variance. Similar to hate speech evaluations, we note a nearly 2 point gain in F-1 score when comparing the mean of all ensembles to mean of sub-models.
max predictions? We have set N = 10 in our exper-iment and are 99% confident that our ensemble ap-proach will significantly improve F-1 scores 98% of the time compared to results from a single model.
• RQ 3: With all model initialization parameters fixed, how do variations in batch size and number of epochs impact ensemble results? We answer this question with relative improvements in F-1 scores between mean of individual models and mean of ensemble models. As shown in Table 2 and discussed in Section 4., the greatest improvements are made with smaller batch sizes and larger number of epochs. Variabil-ity, as measured by standard deviation, consistently reduces for all parameters.
• RQ 4: How do methods compare with different clas-sification tasks (e.g. Abusive speech vs. Sentiment)? As outlined in results Section 4 and Table 3, the meth-ods produce similar results when run on a sentiment analysis test set.
5.
Discussion and Conclusions: Learnings
from Experiments
individ-True None None None Race Race Race Sex Sex Sex
Pred None Race Sex None Race Sex None Race Sex
Fold 1 1053 42 59 66 129 2 113 0 225
Fold 2 1054 52 48 48 148 1 122 1 215
Fold 3 1053 40 61 50 143 4 106 1 231
Fold 4 1066 29 59 58 136 3 106 0 232
Fold 5 1040 38 76 45 152 0 94 0 244
Fold 6 1032 46 75 49 147 1 106 4 228
Fold 7 1055 40 58 57 138 2 113 2 223
Fold 8 1055 37 61 55 142 0 122 1 215
Fold 9 1046 47 60 51 143 3 100 2 235
Fold 10 1064 44 45 50 147 0 113 1 223
Table 4: Confusion scores for all 10-fold ensembles (best in grey) on the (Waseem and Hovy, 2016) dataset. Gold standard and predicted classifications for the dataset are Sex = sexism, Race = racism and None = neither racism nor sexism.
mean of sub-models 75.65%
std deviation of sub-models 1.54%
mean of ensembles 78.62%
ensemble improvement on sub-model mean 2.96%
std deviation of ensembles 1.08%
best results from original author 73.93%
improvement on original work 4.69%
Table 5: Comparison of ensemble method on (Waseem and Hovy, 2016) dataset vs. results from original best method (Waseem and Hovy, 2016). Values are based upon F-1 Measure.
ual models have high variance when compared to the vari-ance of ensemble models. Thus, one might place lower confidence in their model when an ensemble approach is not used. Also, in all trials, we find that ensemble models perform better on test sets compared to the mean of sub-models. The ensemble approach appears to leverage the high variance as an advantage for final classification via the simple method of averaging soft-max output.
5.1.
Difficulties encountered
Several difficulties were encountered in our initial experi-ments due to weight initializations often not being reported by other authors coupled with the issue of a deep learn-ing library lacklearn-ing reproducibility due to seed settlearn-ing. In our case, we had originally used Keras with a TensorFlow back-end. Post experimentation, we investigated this matter more and found that the issue with reproducibility of weight initializations is resolved with use of a Theano back-end. Nonetheless, this painful experience not only demonstrates the need to publish more details, it also can lead to better solutions, such as a more robust ensemble approach.
5.2.
A request for future research
We note that in many papers reviewed for our work, re-searchers failed to publish their weight initialization meth-ods. There are many choices available for weight initial-ization of a neural network and it is one of many important
factors. Deep learning has many other considerations too, and the details provided in published work are frequently light in detail. When considering all of the parameters available (e.g. number of layers, embedding options, opti-mizers, weighting schemes, activation functions, libraries, etc.), neural networks can become very complex and there-fore more details should be recorded for reproducibility. As our work demonstrates, seemingly innocuous values such as batch size, can have significant impacts on results. Fill-ing in the missFill-ing details from published work is a time consuming task, which is best resolved through communi-cation with original authors that may no longer be available due to various factors. As such, it may be worthwhile to make every effort to include all parameter choices, includ-ing weight initialization methods, in future work7.
Additionally, a set of confusion matrices was provided in previous work on the abusive dataset (Gamb¨ack and Sik-dar, 2017). We have also provided confusion matrix results in Table 4. This information is useful for reproducibility, as you can compare many more evaluation metrics than the popular single aggregate measure F-1 macro weighted score. Reporting of confusion matrices opens the door to other metrics such as F-1 micro unweighted or F measure with different beta values. This information could easily be provided online, as publications often have space limita-tion, therefore it is worth consideration of a better approach.
5.3.
Future work
Future work would consider evaluation of ensemble meth-ods on additional test sets (e.g. SemEval 2014 and 2015 for example). Also, a comparison of different weighting schemes is likely useful to understand variations within this parameter. Beyond that, building models with different net-work configurations and embedding models are all consid-ered to be natural next steps. Different approaches, such as LSTM networks based on character representations (as opposed to word embeddings) should be considered. Re-producing the promising results using LSTM and Gradient
7
Boosted Decision Trees (Badjatiya et al., 2017) on addi-tional datasets is a worthwhile exercise too. Given knowl-edge that neural network performance improves as datasets become larger, it would be an interesting experiment to gain insight as to what amount of data is sufficient enough where ensemble methods do not provide a boost in performance. Therefore one possible next step for our work would be to try our methods on progressively larger datasets to empir-ically show that ensembles provide smaller improvements as training data increases.
6.
Acknowledgments
This work was supported by the Economic and Social Re-search Council grant number ES/M010236/1.
7.
Bibliographical References
Abadi, M., Agarwal, A., Barham, P., Brevdo, E., Chen, Z., Citro, C., Corrado, G. S., Davis, A., Dean, J., Devin, M., Ghemawat, S., Goodfellow, I., Harp, A., Irving, G., Is-ard, M., Jia, Y., Jozefowicz, R., Kaiser, L., Kudlur, M., Levenberg, J., Man´e, D., Monga, R., Moore, S., Mur-ray, D., Olah, C., Schuster, M., Shlens, J., Steiner, B., Sutskever, I., Talwar, K., Tucker, P., Vanhoucke, V., Va-sudevan, V., Vi´egas, F., Vinyals, O., Warden, P., Wat-tenberg, M., Wicke, M., Yu, Y., and Zheng, X. (2015). TensorFlow: Large-scale machine learning on heteroge-neous systems. Software available from tensorflow.org. Aggarwal, C. C. and Zhai, C. (2012). A survey of text
clas-sification algorithms. Mining text data, pages 163–222. Badjatiya, P., Gupta, S., Gupta, M., and Varma, V. (2017).
Deep learning for hate speech detection in tweets. In Proceedings of the 26th International Conference on World Wide Web Companion, pages 759–760. Interna-tional World Wide Web Conferences Steering Commit-tee.
Balikas, G. and Amini, M.-R. (2016). Twise at semeval-2016 task 4: Twitter sentiment classification. Proceed-ings of SemEval, pages 85–91.
Benesch, S. (2017). Civil society puts a hand on the wheel: Diverse responses to harmful speech. Harmful Speech Online, page 31.
Chollet, F. (2015). Keras. https://github.com/ fchollet/keras.
Fuhr, N. (2017). Some common mistakes in ir evaluation, and how they can be avoided. In ACM SIGIR Forum, volume 51, pages 32–41. ACM.
Gamb¨ack, B. and Sikdar, U. K. (2017). Using convolu-tional neural networks to classify hate-speech. In Pro-ceedings of The First Workshop on Abusive Language Online, pages 85–90. Association for Computational Linguistics.
Godin, F., Vandersmissen, B., De Neve, W., and Van de Walle, R. (2015). Multimedia lab @ acl w-nut ner shared task: Named entity recognition for twitter mi-croposts using distributed word representations. In Pro-ceedings of the ACL 2015 Workshop on Noisy User-generated Text (ACL-IJCNLP), volume 2015, pages 146– 153.
Goldberg, Y. (2016). A primer on neural network models for natural language processing. Journal of Artificial In-telligence Research(JAIR), 57:345–420.
Goodfellow, I., Bengio, Y., and Courville, A. (2016). Deep Learning. MIT Press. http: //www.deeplearningbook.org.
Hagen, M., Potthast, M., B¨uchner, M., and Stein, B. (2015). Webis: An ensemble for twitter sentiment detec-tion. InProceedings of the 9th International Workshop on Semantic Evaluation (SemEval 2015), pages 582– 589.
Kim, Y. (2014). Convolutional neural networks for sen-tence classification. In In: Proceedings of the 2014 Conference on Empirical Methods in Natural Language Processing (EMNLP), pages 1746–1751. Association for Computational Linguistics.
Mikolov, T., Chen, K., Corrado, G., and Dean, J. (2013a). Efficient estimation of word representations in vector space.arXiv preprint arXiv:1301.3781.
Mikolov, T., Sutskever, I., Chen, K., Corrado, G. S., and Dean, J. (2013b). Distributed representations of words and phrases and their compositionality. In Advances in Neural Information Processing Systems(NIPS), pages 3111–3119.
Molteni, F., Buizza, R., Palmer, T. N., and Petroliagis, T. (1996). The ecmwf ensemble prediction system: Methodology and validation. Quarterly journal of the royal meteorological society, 122(529):73–119.
Nakov, P., Rosenthal, S., Kozareva, Z., Stoyanov, V., Ritter, A., and Wilson, T. (2013). Semeval-2013 task 2: Sen-timent analysis in twitter. InProceedings of the 7th In-ternational Workshop on Semantic Evaluation (SemEval 2013), pages 312–320.
Park, J. H. and Fung, P. (2017). One-step and two-step classification for abusive language detection on twitter. In Proceedings of The First Workshop on Abusive Lan-guage Online, pages 41–45. Association for Computa-tional Linguistics.
Pedregosa, F., Varoquaux, G., Gramfort, A., Michel, V., Thirion, B., Grisel, O., Blondel, M., Prettenhofer, P., Weiss, R., Dubourg, V., Vanderplas, J., Passos, A., Cour-napeau, D., Brucher, M., Perrot, M., and Duchesnay, E. (2011). Scikit-learn: Machine learning in Python. Jour-nal of Machine Learning Research, 12:2825–2830. Pennington, J., Socher, R., and Manning, C. D. (2014).
Glove: Global vectors for word representation. In In: Proceedings of the 2014 Conference on Empirical Meth-ods in Natural Language Processing (EMNLP), pages 1532–1543. Association for Computational Linguistics. Ross, B., Rist, M., Carbonell, G., Cabrera, B., Kurowsky,
N., and Wojatzki, M. (2017). Measuring the reliability of hate speech annotations: The case of the european refugee crisis.preprint arXiv:1701.08118.
Saleem, H. M., Dillon, K. P., Benesch, S., and Ruths, D. (2016). A web of hate: Tackling hateful speech in online social spaces. In Proceedings of the Workshop on Text Analytics for Cybersecurity and Online Safety (TA-COS 2016), LREC 2016, pages 1–10.
analysis with deep convolutional neural networks. In Proceedings of the 38th International ACM SIGIR Con-ference on Research and Development in Information Retrieval, pages 959–962. ACM.
Stojanovski, D., Strezoski, G., Madjarov, G., and Dimitro-vski, I. (2015). Twitter sentiment analysis using deep convolutional neural network. InInternational Confer-ence on Hybrid Artificial IntelligConfer-ence Systems, pages 726–737. Springer.
Sygkounas, E., Rizzo, G., and Troncy, R. (2016). Senti-ment polarity detection from amazon reviews: an exper-imental study. InSemantic Web Evaluation Challenge, pages 108–120. Springer.
The United Nations General Assembly. (1966). Interna-tional covenant on civil and political rights. Treaty Se-ries, 999:171, December.
The United Nations. (1948). Universal Declaration of Hu-man Rights. December.
Theano Development Team. (2016). Theano: A Python framework for fast computation of mathematical expres-sions. arXiv e-prints, abs/1605.02688, May.
Tulkens, S., Hilte, L., Lodewyckx, E., Verhoeven, B., and Daelemans, W. (2016). A dictionary-based approach to racism detection in dutch social media. InProceedings of the Workshop on Text Analytics for Cybersecurity and Online Safety (TA-COS 2016), LREC 2016, pages 11– 17.
Vosoughi, S., Vijayaraghavan, P., and Roy, D. (2016). Tweet2vec: Learning tweet embeddings using character-level cnn-lstm encoder-decoder. In Proceedings of the 39th International ACM SIGIR conference on Research and Development in Information Retrieval, pages 1041– 1044. ACM.
Waseem, Z. and Hovy, D. (2016). Hateful symbols or hate-ful people? predictive features for hate speech detection on twitter. InProceedings of NAACL-HLT, pages 88–93. Waseem, Z. (2016). Are you a racist or am i seeing things? annotator influence on hate speech detection on twitter. In Proceedings of the 1st Workshop on Natural Lan-guage Processing and Computational Social Science, pages 138–142.
Xia, R., Zong, C., and Li, S. (2011). Ensemble of feature sets and classification algorithms for sentiment classifi-cation. Information Sciences, 181(6):1138–1152. Yang, Y. and Eisenstein, J. (2017). Overcoming
lan-guage variation in sentiment analysis with social atten-tion. Transaction of the Association for Computational Linguistics (TACL).