A-Rectroscopic Review - Optimization of Abrasive Water Jet
Machining
(a) Prof.(Dr)AVNL sharma, (b)Indrajeet kumar, (c)Nibendu mishra, (d) Khirod chandra pandey
(a) Professor, Department of Mechanical Engineering, G.I.E.T, Gunupur, Rayagada ,odisha (b,c,d) Student, B.tech, Department of Mechanical Engineering, G.I.E.T,Gunupur, Rayagada, odisha
Abstract-The Abrasive Water jet machining (AWJM) is a non-conventional machining process in which a abrasive particles are made to eject on the work material at a high velocity. The jet velocity of abrasive particles is carried by pressurised water. This high velocity stream of abrasive is generated by converting the pressure energy of the water to its kinetic energy. There are many process parameter affect quality of machined surface cut by AWJM. Important process parameters which affect the metal removal rate are:-Abrasive type, Abrasive size, Mass flow rate–abrasive flow rate (AFR), Nozzle characteristics including nozzle diameter, System operational parameters i.e., (a) Pressure (b) Standoff distance (c) Feed or Nozzle traverse rate (d) Angle of cutting, which influence Performance parameters like (a) Depth of cut (DOC) (b) Material removal rate (MRR) (c) Kerf width (d) Surface roughness (e) specific power consumption.
In this paper a detailed analysis has been proposed on use of statistical DOE and Analysis of Variance (ANOVA).
Index Terms— AWJM, Kerf, Design of experiment (D.O.E), Metal removal rate(MRR), roughness, flow rate, stand off distance
(s.o.d), Taguchi method, Grey analysis.
1.INTRODUCTION
As we know this technology is most widely used compare to other non-conventional technology because of its various advantages. It is used for cutting a wide variety of materials ranging from soft to hard materials for example titanium, mild steel etc. This technique is especially suitable for very soft, brittle and fibrous materials which are used in aircrafts and ships etc. This technology is less sensitive to material properties as it does not cause chatter. This process is doesn’t cause much heat generation so machined surface is free from heat affected zone and residual stresses. AWJM is normally used for, Cutting of soft materials, Cutting frozen meat, Mass Immunization, removal of paint, Surgery operation, Cutting, Nuclear Plant Dismantling, Pocket Milling, Drilling, Turning, Textile, Leather industry. Materials which are cut by AWJM mainly are Steels, Non-ferrous alloys, Ti alloys, Ni- alloys, Polymers, Honeycombs, Metal Matrix Composite, Reinforced plastics, Metal Polymer Laminates, Ceramic Matrix Composite, Concrete, Stone – Granite, Wood, , Glass Fibre Metal Laminates etc.
2. LITERATURE SURVEY
In this section we will discussed the experimental analysis of Abrasivewater jet machining.
2.1) H Hocheng and K.R. Chang both of the scientist has carried out work on the formation of kerf of a ceramic plate cut by an abrasive water jet. By doing the experiment they find that kerf width increases with the increase of pressure,
traverse speed increase, abrasive flow rate increase and abrasive size increase. Taper ratio increases with traverse speed increases and decreases with pressure increases and abrasive size increases where as taper ratio has no effect with increase in abrasive flow rate.
orifice and focusing nozzle is not much effect the surface quality but larger size of orifice produce a better surface finish on cut surface.
2.3) J. Wang and, W.C.K. Wong had done study of abrasive water jet cutting of metallic coated sheet steels based on a statistically designed experiment. They discussed relationships between kerf characteristics and process parameters. They produce empirical models for kerf geometry and quality for the prediction and optimization of AWJ cutting performance. The top and bottom kerf widths increase as the water pressure increase. The top and bottom kerf widths increase as the standoff distance increase but the rate of increase for the bottom kerf width is smaller. The traverse speed produces a negative effect on both the top and bottom kerf widths but the kerf taper increase as the traverse speed increase. The surface roughness decreases with an increase in the abrasive flow rate. They show the burr height steadily decreases with a decrease in the traverse speed. Kerf width Increase Increase Not
significant Burr height Decrease Increase Not
significant
Increase
2.4) P K Ray and Dr A K Paul had investigated that the MRR increases with increase of air pressure, grain size and with increase in nozzle diameter. MRR increases with increase in stand off distance (SOD) at a particular pressure. They found after work that initially MRR increases and then it is almost constant for small range and after that MRR decreased as SOD increases. They introduced a material removal factor (MRF). MRF is a non-dimensional parameter and it gives the weight of material removed per gram of abrasive particles. MRF decreases with increase in pressure that means the quantity of material removed per gram of abrasives at a lower pressure is higher than the quantity of material removed per gram of abrasives at a higher pressure. This is happened because at higher air pressure more number of abrasive particles are carried through the nozzle so more number of inter particle collisions and hence more loss of energy. 3. ANALYSIS OF EXPERIMENTAL WORK
It was conducted to study MRR on hard materials at different parameters of AWJM. Different parameters are pressure, thickness of materials and stand off distance. Parameters are selected on the basis on the literature review of some of the studies. Under this we will study about design of experiments
(DOE) in which we will in which purposeful changes are made to the input variables of a system or process and the effects on response variables are measured.
4. DESIGN OF EXPERIMENT
Design of experiments, is also know as experimental design, it deals with conducting, analyzing planning, and interpreting controlled tests to evaluate the factors which control the value of a parameter or a group of parameter. The reason to use experimental design to implement valid and efficient experiments which will produce sound decision making and quantitative results. A good experimental design must be done in such a way that it avoid systematic error, be précised, allow estimation of error and have a broad validity. Some common DOE terms and concepts include are controllable and uncontrollable input factors, responses, hypothesis testing, blocking, replication and interaction which have been discussed below :-
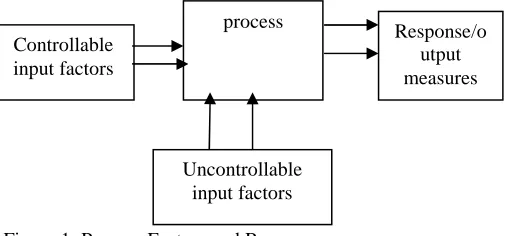
4.1) Controllable input factors, which is also known as x factors, are those input parameters which can be modified in an experiment or process.
4.2) Uncontrollable input these factors used to recognized and to understand how they may affect the response.
4.3) Responses, or output measures, are the elements of the process outcome which have the desired effect.
The controllable input factors can be modified to
optimize the output. The relationship between the factors and responses is shown in Figure 1.
Figure 1: Process Factors and Response
4.4) Hypothesis testing helps determine the significant factors using statistical methods. There are two possibilities in a
order to get an estimate for the amount of random error that could be part of the process.
4.6)Interaction: When an experiment has three or more variables, an interaction is a situation in which the simultaneous influence of two variables on a third is not additive.
The effect of many different parameters on the performance characteristic in a condensed set of experiments can be examined by using the orthogonal array
experimental design proposed by Taguchi. Knowing the number of parameters and the number of levels,
the proper orthogonal array can be selected. Using the array selector table shown below, the name of the appropriate array can be found by looking at the column and row corresponding to the number of parameters and number of levels. Once the name has been determined (the subscript represents the number of experiments that must be completed), the predefined array can be looked up. Links are provided to many of the predefined arrays given in the array selector table. These arrays were created by using an algorithm Taguchi developed, and allows for each variable and setting to be tested equally. For example, if we have three parameters (voltage, temperature, pressure) and two levels (high, low), it can be seen the proper array is L4. Clicking on the link L4 to view the L4 array, it can be seen four different experiments are given in the array. The levels designated as 1, 2, 3 etc. should be replaced in the array with the actual level values to be varied and P1, P2, P3 should be replaced with the actual parameters (i.e. voltage, temperature, etc.) 5. ARRAY SELECTOR
5.1) Analyzing the experimental data
Once the experimental design has been determined and the trials have been carried out, the measured performance characteristic from each trial can be used to analyze the relative effect of the different parameters. To demonstrate the data analysis procedure, the following L9 array will be used, but the principles can be transferred to any type of array.In this array, it can be seen that any number of repeated observations (trials) may be used. Ti,j represents the different trials with i = experiment number and j = trial number. It should be noted that the Taguchi method allows for the use of a noise matrix including external factors affecting the process
outcome rather than repeated trials, but this is outside of the scope of this article.
To determine the effect each variable has on the output, the signal-to-noise ratio, or the SN number, needs to be calculated for each experiment conducted. The calculation of the SN for the first experiment in the array above is shown below for the case of a specific target value of the performance characteristic. In the equations below, Yi is the mean value and Si is the variance. yi is the value of the performance characteristic for a given experiment.
For the case of minimizing the performance characteristic, the following definition of the SN ratio should be calculated:
maximizing the performance characteristic, the following definition of the SN ratio should be calculated:
6. ANOVA
Analysis of variance (ANOVA) is a collection of statistical models used to analyze, to develop and to confirm an explanation for the observed data of the varience. It is computationally elegant and relatively robust against violations of its assumptions. ANOVA provides industrial strength (multiple sample comparison) statistical analysis. It has been adapted to the analysis of a variety of experimental designs.
Anova is used in the analysis of comparative experiments, those in which only the difference in outcomes is of interest. The statistical significance of the experiment is determined by a ratio of two variances. This ratio is independent of several possible alterations to the experimental observations: Adding a constant to all observations does not alter significance. Multiplying all observations by a constant does not alter significance. So ANOVA statistical significance result is independent of constant bias and scaling errors as well as the units used in expressing observations. The determination of statistical significance also required to access to tables of the F function which were supplied by early statistics texts.
7. LOGIC OF ANOVA
The calculations of ANOVA can be characterized as computing a number of means and variances, dividing two variances and comparing the ratio to a handbook value to determine statistical significance.
6.1.1) Partitioning of the sum of squares
ANOVA uses traditional standardized terminology. The definitional equation of sample variance
is,
where the divisor is called the degrees of freedom (DF), the summation is called the sum of squares (SS), the result is called the mean square (MS) and the squared terms are deviations from the sample mean.
ANOVA estimates 3 sample variances: a total variance based on all the observation deviations from the grand mean, an error variance based on all the observation deviations from their appropriate treatment means and a treatment variance. The treatment variance is based on the deviations of treatment means from the grand mean, the result being multiplied by the number of observations in each treatment to account for the difference between the variance of observations and the variance of means.
The fundamental technique is a partitioning of
the total sum of squares SS into components related to the effects used in the model. For example, the model for a simplified ANOVA with one type of treatment at different levels.
The number of degrees of freedom DOF can be partitioned in a similar way: one of these components (that for error) specifies a chi-squared distribution which describes the associated sum of squares, while the same is true for "treatments" if there is no treatment effect.
6.2) The F-test
The F-test is used for comparing the factors of the total deviation. For example, in one-way, or single-factor ANOVA, statistical significance is tested for by comparing the F test statistic
where MS is mean square, = number of treatments
and = total number of cases to the
Using the F-distribution is a natural candidate because the test statistic is the ratio of two scaled sums of squares each of which follows a scaled chi-squared distribution.
The expected value of F is:-
(where n is the
treatment sample size) which is 1 for no treatment effect. As values of F increase above 1, the evidence is increasingly inconsistent with the null hypothesis. Two apparent experimental methods of increasing F are increasing the sample size and reducing the error variance by tight experimental controls.
There are two methods of concluding the ANOVA hypothesis test, both of will give the same result:
numerator and the denominator and the significance level (α). If F ≥ FCritical, the null hypothesis is rejected.
The computer method calculates the probability (p-value) of a value of F greater than or equal to the observed value. The null hypothesis is rejected if this probability is less than or equal to the significance level (α).
The ANOVA F-test is known to be nearly optimal in the sense of minimizing false negative errors for a fixed rate of false positive errors (i.e. maximizing power for a fixed significance level.
8. CONCLUSION
Quality of cutting surface of any material by Abrasive Water jet Machining is depends on various process parameters like Stand off distance (s.o.d), types of abrasive material used (like silica sand), size of abrasives, abrasive flow rate, nozzle diameter, orifice size, and traverse speed. Quality of cutting surface is measured by material removal rate, surface roughness, kerf width, kerf taper ratio. From the literature review we would come to know that above all mentioned parameter traverse speed is most effective parameter for MRR. Abrasive flow rate is also an important parameter for increasing MRR. But beyond some limit with increase in abrasive flow rate and traverse speed the surface roughness decreases. Increasing traverse speed also increase the kerf geometry. So it is required to find optimum condition for process parameter to give better quality of cutting surface. Traverse speed is directly proportional to productivity and should be selected as high as possible without compromising kerf quality and surface roughness.
REFERENCES
[1] Hocheng and K.R. Chang, “Material removal analysis of abrasive water jet cutting of ceramic plates “Journal of Materials Processing Technology, 40(1994) 287-304 [2] J. John Rozario Jegaraj and N. Ramesh Babu “A strategy
for efficient and quality cutting of materials with abrasive water jets considering the variation in orifice and focusing nozzle diameter” International Journal of Machine Tools & Manufacture 45 (2005) 1443–1450
[3] J. Wang, W.C.K. Wong, “A study of abrasive water jet cutting of metallic coated sheet steels” International Journal of Machine Tools & Manufacture 39 (1999) 855– 870
[4] Some Studies on Abrasive Jet Machining by P K Ray, Member A K Paul, Fellow Department of Mechanical Engineering Regional Engineering College Rourkela UDC 621.921 page no 27 to 29.
[5] R. Kovacevic, Modeling of the influence of the abrasive waterjet cutting parameters on the depth of cut based on the fuzzy rules, International Journal of Machine Tools & Manufacture 34 (1994)
Table: Sample Anova table for a model