Abstract
Objectives: Wait times in Canada are increasingly being monitored as an indicator of quality health care delivery. We created a higher resolution picture of the wait experienced by urological surgery patients beginning with the initial referral. In doing so, we hoped to (a) identify potential bottlenecks and common delays at our centre, and (b) identify predictors of wait time.
Methods: The charts of 322 patients undergoing surgery from November 2007 to March 2008 were reviewed and specific dates, patient factors and delays were recorded. The data were used to detail the patient’s wait and to determine the patient factors which were predictive of wait time.
Results: The mean time from decision to operate to the day of operation was 75.87 days for all patients. This number accounts for 53% of the wait time, while the time from referral to decision to operate is 47%. Predictors of a decreased wait time include cancer cases, younger age, urgency score, repeat patients and female gen-der in multivariate analysis. Delays were experienced by 16.8% of patients; most common delays were operating room cancellations/ time constraints, patients requiring further optimization and delays in referral (4.7%, 3.4% and 3.1%, respectively).
Conclusions: The waiting process is complex; the actual waiting time that a patient must endure is much longer than the wait times traditionally recorded and reported by hospitals. As strategies are implemented to decrease wait times, it will become increasingly important to monitor the entire wait time from referral to opera-tion and to ensure that changes are being made that truly decrease wait times and not simply shift where and when the patient waits.
Cite as: Can Urol Assoc J 2011;5(1):13-7; DOI:10.5489/cuaj.09149
Résumé
Objectifs : Les temps d’attente au Canada sont de plus en plus mesurés à titre d’indicateur d’une prestation de soins de santé de qualité. Nous avons dressé un tableau plus complet des temps d’attente de patients devant subir une intervention chirurgicale de nature urologique à partir de la recommandation initiale. Ce faisant, nous espérions (a) identifier les goulots d’étranglement potentiels et les retards courants à notre centre, et (b) cerner des variables explicatives pour les temps d’attente.
Méthodologie : On a examiné les dossiers de 322 patients ayant subi une intervention chirurgicale entre novembre 2007 et mars
2008. Ont été consignés les dates précises, les facteurs liés aux patients et les retards. Les données ont servi à exposer en détail le temps d’attente du patient et à déterminer les facteurs liés au patient qui permettaient de prédire le temps d’attente.
Résultats : Le délai moyen entre la décision d’opérer et le jour de l’opération était de 75,87 jours pour tous les patients. Ce chiffre compte pour 53 % de la période d’attente, alors que le temps entre la recommandation initiale et la décision d’opérer comptait pour 47 %. Dans une analyse multivariée, les variables explicatives d’un temps d’attente moins long incluaient les cas de cancer, un âge moins avancé, un score d’urgence, un patient ayant déjà subi une opération et le sexe féminin. Des retards ont été signalés par 16,8 % des patients; la plupart des retards étaient attribuables à des annu-lations ou contraintes de temps en lien avec la salle d’opération, des patients ayant besoin d’une optimisation plus poussée et des retards en lien avec la demande de consultation (4,7 %, 3,4 % et 3,1 %, respectivement).
Conclusions : Le processus d’attente est complexe; le temps d’attente réel d’un patient est beaucoup plus long que les temps habituellement consignés et signalés par les hôpitaux. À mesure que sont mises en application des stratégies pour réduire les temps d’attente, il deviendra de plus en plus important de mesurer cette période d’attente au complet, à partir de la recommandation initiale jusqu’à l’intervention chirurgicale, et de s’assurer que des change-ments sont apportés permettant de réellement diminuer les temps d’attente, et non de simplement déplacer les temps d’attente d’une partie du processus à une autre.
Introduction
Wait times are an increasingly popular measure of health care delivery. In Canada, initiatives have been developed to ensure wait times experienced by patients are reasonable and do not adversely affect patients’ health.1,2 Cancer surgery
is one of 5 major areas that the Ontario Wait Times Strategy recognized as a critical area of medical care that requires
improved access.3 Canadian hospitals monitor patients’ wait
times and use these times as a barometer to determine how well they are delivering care. Previous studies have shown that wait times for cancer surgery in Ontario are increasing, and urological surgeries have not been exempt from these increases.4,5,6
Delaying treatment has unfavourable effects on patient
Eric Cole,
*Wilma Hopman, MA;
†Jun Kawakami, MD, FRCSC
±outcome for certain urological malignancies. Increased wait time for muscle invasive bladder cancer treatment has been
demonstrated to detrimentally affect tumour stage.7 Waiting
up to 3 months for radical nephrectomy does not appear to affect outcome, however there may be a bias towards
treating more ominous-looking tumours sooner.8 Although
the data are less clear regarding prostate cancer,9 waiting
for such surgeries has negative effects on a patient’s quality of life.10
Currently, ‘surgical wait time’ often refers to the time from the decision to operate to the operation itself, however, this definition only accounts for a fraction of the actual wait time
experienced by the patient.11 A more realistic model might
begin at a patient’s first visit to a health care provider fol-lowed by their referral to urology, first clinic visit, diagnosis and ultimately only the last component would be the deci-sion to operate and the operation itself (Fig. 1).
This type of “higher resolution” analysis is important as it allows for a more detailed and complete picture of wait times. Saint-Jacques and colleagues reported that when using a high- and low-resolution analysis of the care inter-vals, both detected an increase in wait times over the 2 time periods, but only the high-resolution analysis could pinpoint
where the increases were occurring.12 The complex nature of
wait times is demonstrated in a high-resolution analysis of non-small-cell lung cancer cases, which showed that delays
in referrals were often “made up for” by quicker consults.13
The effective use of administrative databases for determin-ing time from decision to operate to the actual operation has
already been established,14 but to our knowledge its
accu-racy for assessing other time points has not. When a 2-week urgent referral policy for breast cancer was implemented in the United Kingdom, a follow-up study showed that while the time from referral to appointment was reduced, the time from referral to surgery did not change; the patient just
waited elsewhere in the queue.15 Another study examining
urological oncology referrals and the 2-week rule identified barriers to meeting the UK’s Department of Health guide-lines, including funding as well as accurate referral letters.16
Methods
We reviewed the charts of all patients who underwent surgery at the Department of Urology from November 1, 2007 to March 31, 2008 at the Kingston General Hospital, Kingston, Ontario, Canada. For new patients, dates of refer-ral to urology, first clinical visit, diagnosis, decision to oper-ate and the operation were recorded. For repeat patients, date seen, diagnosis, decision to operate and operation were recorded. Any delay documented in the chart was noted and categorized.
The electronic booking software AdapCS (AdapCS, Marin, CA) is used to book all of our non-emergency operations.
To assess the accuracy of the timing information in AdapCS, we took the information recorded in the chart as the gold standard and compared it to the dates previously entered into AdapCS. Patient characteristics, including sex, age, can-cer versus non-cancan-cer cases, inpatient versus out-patient procedures, new or repeat patients and urgency score, were recorded.
Data were entered into an Excel (Microsoft Canada, Mississauga, ON) spreadsheet and imported into SPSS (ver-sion 16.0 for Windows, SPSS Inc., Chicago, IL) for statisti-cal analysis. The time between each date of interest was calculated, and the results were plotted to assess normality. Following the descriptive analysis, the association between the time points and the patient characteristics were assessed by means of t-tests and the Mann-Whitney U, as well as one-way analysis of variance (ANOVA) and the Kruskal-Wallis. Time between referral and surgery was log-transformed, and linear regression was used to evaluate the association between the patient factors and both the transformed and non-transformed outcome.
Results
Three hundred twenty-two patients underwent urological surgery between November 1, 2007 and March 31, 2008. Age ranged from 0.4 to 92.8 years with a mean of 60.8 ±18.6. Patient characteristics are shown in Table 1.
The wait times experienced by patients are listed in Table 2, both overall and by group (new vs. repeat). Overall, the time period from the decision to operate to the date of sur-gery was 75.9 days for all patients. Time from referral to
Fig. 1. Typical scope of wait time experienced by urology patient.
Referral
Table 1. Patient characteristics (n = 322)
first visit (37.6 ± 44.1) and time from first visit to decision to operate (34.8±53.7) were only available for new patients (present for 190 of 201 new patient charts, 94.5%). The mean wait for the new patients (referral to operation) was 155.1 ± 121.6 days (median 124.5 days).
Not all charts contained the information regarding referral dates and date seen, but where the data were available, the discrepancies between the chart and the database was larger at earlier time points. The greatest variation was seen at the referral stage (n = 83, mean difference 43.0 ± 86.4 days). The date seen differed by an average of 35.0 ± 72.3 days (n = 90), while the decision to operate or list date differed by 10.5 ± 42.2 days (n = 322). The date of surgery was a perfect match in all cases.
All time data were somewhat skewed. However, the para-metric (t-test and one-way ANOVA) and non-parapara-metric tests (Mann-Whitney U and Kruskal-Wallis) produced equivalent results, therefore the parametric test results are produced for ease of interpretation. Presence of a cancer flag decreased the average wait time for all 5 waiting time segments (Table 3), which attained statistical significance for 3 of them. None of the segments differed significantly by gender or by in/ out-patient procedure status.
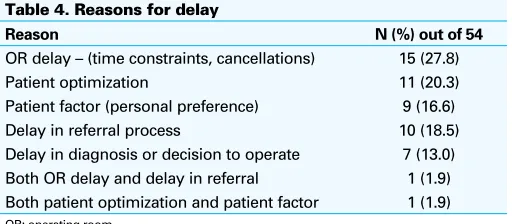
Fifty-four of the 322 cases experienced some type of delay in receiving their care (Table 4). New patients were more
likely to experience a delay (20.4% vs. 11.6%, p = 0.041)
than repeat patients. The delayed group waited longer at all intervals, and this difference was statistically significant for all time intervals except for the time between the initial visit (date seen) and diagnosis.
In multivariable linear regression, using time from referral to date of surgery as the dependent variable, it was found that in/outpatient procedure status was not significant. Therefore, the most parsimonious model was found to be the one pre-sented in Table 5. Sex and age fell just short of statistical significance, but were retained in the model as they did have clinically significant impact on wait times. The regres-sion for the log-transformed waiting time produced similar results, other than both the sex and age did attain statistical
significance (p= 0.007 and p= 0.003, respectively), so the
regression for the untransformed outcome is produced for ease of interpretation of the parameter estimates.
Discussion
Wait time initiatives have traditionally focused on “time to surgery,” however the entire wait period experienced by the patient begins with referral to a specialist.17 We found that
while the lengthiest period of waiting is from the decision to operate to the actual operation date, the rest of the waiting period still accounts for 47% of the wait time experienced by new patients (referral date to decision to operate) – a significant portion of the waiting the patient must endure.
The AdapCS software proved to be accurate in recording the wait time from decision to operate to the operation; it would not have been accurate, however, if the wait time began at the date of referral. While the software has the ability to record this information, it was often not properly inputted as their capture is not currently mandated.
Cancer cases were operated on significantly faster than non-cancer cases (mean 55 days vs. 93 days). Our study did not stratify based on the type of urological malignancy, and we considered the cancer cases as a whole to maintain power. In future studies it may be useful to stratify based on cancer type as there are significant differences in the urgency of treating different types of urological cancer.
Of the 322 cases reviewed, 54 (16.8%) experienced some type of delay. The most common delay being an operat-ing room cancellation/time restraint problem and the least
Table 2. Length of time for various segments of the waiting process
Time patient New Repeat patient All
Date referred to date seen, n=190
37.6 ± 44.1 n/a n/a
Date seen to decision to operate, n=200
34.8 ± 53.7 n/a n/a
Decision to operate to date of surgery, n=201, 121 and 322 respectively
81.6 ± 86.0 66.3 ± 58.9 75.9 ± 77.2
Table 3. Mean ± standard deviation values for time segments for those with and without the cancer flag
Differences between the two time points (in days)
Cancer:
No Cancer: Yes p-value
Date referred to
Date seen to decision to operate (new only)
37.2±58.8 29.4±39.8 0.340
Decision to operate to date of operation
93.5±97.8 55.0±39.7 0.003
Date referred to date of operation (new only)
180.5±132.3 107.7±74.6 <0.001
Results of significance testing using the Mann-Whitney U roduced equivalent results.
Table 4. Reasons for delay
Reason N (%) out of 54
OR delay – (time constraints, cancellations) 15 (27.8) Patient optimization 11 (20.3) Patient factor (personal preference) 9 (16.6) Delay in referral process 10 (18.5) Delay in diagnosis or decision to operate 7 (13.0) Both OR delay and delay in referral 1 (1.9) Both patient optimization and patient factor 1 (1.9)
common being a delay in diagnosis or decision to oper-ate. Repeat patients were significantly less likely (11.6% vs. 20.4%) to experience a delay. This difference is likely because (1) the patient is familiar with the hospital surgi-cal process and (2) because the urologist is able to predict potential delays and avoid these delays with more familiar patients. Delays were less common in the cancer patients (13.1% as compared to 19.1% of non-cancer patients), although the difference was not statistically significant. It may be beneficial for institutions to monitor which type of delays its patients are experiencing and how or if these delays translate into wait time changes.
Urgency scores are assigned at the time when the deci-sion to operate is made. As expected, the more urgent the score, the shorter the wait time from decision to operate to operation date. Interestingly, higher scores also corre-sponded to a shorter wait time from referral to first visit. This difference suggests that we are triaging appropriately when we first receive the referral.
While we did not identify any major bottlenecks in the process, we were able to create a model for new patients that would predict wait times (referral to surgery). Women are seen an average of 35 days sooner than men, and the wait increased by 7.4 days for every 10-year increase in age. This may be in part because women represent a smaller proportion of benign urologic practice, and therefore may have more cancer diagnoses proportionately. Multivariable regression analysis demonstrated that sex had borderline sig-nificance when cancer status and other variables were taken into account. In addition, the wait increased by an average of 41 days for each level of urgency, and if the cancer flag was positive, the wait decreased by an average of 64 days.
There are other identified weaknesses of our study. The time period we looked at was from November to March and excluded the summer which is often the slowdown period in the operating room, which may translate into longer wait times. Additionally, the issue of external validity and the extent to which our findings can be generalized to other hospital sys-tems are not clear given that the Kingston General Hospital is one of the smaller tertiary care hospitals in Canada. Future studies may want to take into account such seasonal
variabil-ity and differences in hospital models and their implication on wait times. Finally, comparing the wait times of those who are referred but not operated on to those who undergo an operation is another potential area of future study.
Conclusions
The waiting process is complex and the actual wait time a patient must tolerate is much longer than the wait time tra-ditionally recorded and reported by hospitals. The real-time surgical booking software used at our institution is accurate in reporting wait times; however, to change our points of interest, recording practices must change accordingly as the software is only as accurate as the data inputted. As strate-gies are implemented to decrease wait times, it will become increasingly important to monitor the entire wait time from referral to operation because (1) the time prior to the deci-sion to operate represents a significant portion of the wait time and (2) when current wait times are compared to those in the future, it will be useful to see which component of the wait is increasing/decreasing and how this is related to the wait time strategies implemented at the provincial and institutional level. Interestingly, we found that repeat patients were more likely to experience a shorter wait time. Importantly, cancer cases are also experiencing shorter wait times indicating that efforts to prioritize cancer cases are having effect.
Urology Resident, Department of Urology, McMaster University Hamilton ON; †Statistician,
Department of Community Health and Epidemiology, Kingston General Hospital, Kingston, ON;
±Associate Professor, Department of Urology, Queen’s University, Kingston, ON
Competing interests: None declared.
This paper has been peer-reviewed.
References
1. Canadian Surgical Wait Times (SWAT) Initiative. Consensus document: Recommendations for optimal surgical wait times for patients with urological malignancies. Can J Urol 2006;13(Suppl 3):62-4. 2. Eggertson L. Wait time alliance first to set benchmarks. CMAJ 2005;172:1277.
3. Hudson AR. Ontario wait time strategy. Can J Urol 2006;13(Suppl 3):14-5.
4. Simunovic M, Gagliardi A, McCready D, et al. A snapshot of waiting times for cancer surgery provided by surgeons affiliated with regional cancer centres in ontario. CMAJ 2001;165:421-5.
5. Mahmud SM, Fong B, Fahmy N, et al. Effect of preoperative delay on survival in patients with bladder cancer undergoing cystectomy in Quebec: A population based study. J Urol 2006;175:78-83. 6. Kawakami J, Hopman WM, Smith-Tyron R, et al. Measurement of surgical wait times in a universal health
care system. Can Urol Assoc J 2008;2:597-603.
7. Fradet Y, Aprikian A, Dranitsaris G, et al. Canadian surgical wait times (SWAT) initiative. Does prolonging the time to bladder cancer surgery affect long-term cancer control: A systematic review of the literature.
Can J Urol 2006;13(Suppl 3):37-47.
8. Stec AA, Coons BJ, Chang SS, et al. Waiting time from initial urological consultation to nephrectomy for renal cell carcinoma-does it affect survival? J Urol 2008;179:2152-7.
Table 5. Linear regression model for time from referral to time of surgery (new patients only)
Variable Parameter estimate (95% CI) Significance
Constant 67.0 (-24.1, 158.2) 0.149 Sex (male=1, female=2) -35.4 (-72,3, 1.4) 0.059 Urgency code (1=most
urgent)
41.2 (22.3, 60.1) <0.001
Cancer flag (0=no, 1=yes) -64.1 (-102.5, -25.8) 0.001 Age (for every 10 years) 7.4 (-1.6, 15.9) 0.090
9. Saad F, Finelli A, Dranitsaris G, et al. Canadian surgical wait times (SWAT) initiative. Does prolonging the time to prostate cancer surgery impact long-term cancer control: A systematic review of the literature.
Can J Urol 2006;13(Suppl 3):16-24.
10. Salinas-Sánchez AS, Hernández-Millán I, Lorenzo-Romero JG, et al. Quality of life of patients on the waiting list for benign prostatic hyperplasia surgery. Qual Life Res 2001;10:543-53.
11. Sanmartin C, Shortt SE, Barer ML, et al. Waiting for medical services in canada: Lots of heat, but little light. CMAJ 2000;162:1305-10.
12. Saint-Jacques N, Younis T, Dewar R, et al. Wait times for breast cancer care. Br J Cancer 2007;96:162-8. 13. Saint-Jacques N, Rayson DFRCP, AlFayea TBS, et al. Waiting times in early-stage non-small cell lung cancer
(NSCLC). J Thorac Oncol 2008;3:865-70.
14. De Coster C, Luis A, Taylor MC. Do administrative databases accurately measure waiting times for medical care? evidence from general surgery. Can J Surg 2007;50:394-6.
15. Robinson D, Bell CMJ, Møller H, et al. Effect of the UK government’s 2-week target on waiting times in women with breast cancer in southeast england. Br J Cancer 2003;89:492-6.
16. Coxon JP, Harris HJ, Watkin NA. A prospective audit of the implementation of the 2-week rule for assess-ment of suspected urological cancers. Ann R Coll Surg Engl 2003;85:347-50.
17. Unfinished business: Report on wait times in Canada. Wait Time Alliance for Timely Access to Health Care. June 2009. http://www.waittimealliance.ca/June2009/Report-card-June2009_e.pdf. Accessed January 7, 2011.