Rupture process of the 2007 Noto Hanto earthquake: waveform inversion
using empirical Green’s function
Atsushi Nozu
Independent Administrative Institution, Port and Airport Research Institute, 3-1-1 Nagase, Yokosuka 239-0826, Japan
(Received June 22, 2007; Revised November 27, 2007; Accepted December 5, 2007; Online published November 7, 2008)
A waveform inversion study was conducted to reveal the rupture process of the 2007 Noto Hanto, Japan, earthquake using near-source strong ground motion records. To avoid uncertainty in the subsurface structure in and around the source region when calculating Green’s functions, I used the aftershock records as empirical Green’s functions. To ensure that the path and the site effects are shared between the ground motions from the mainshock and those from aftershocks, the mainshock fault plane was divided into four domains, each of which was allocated to one of the aftershocks used as the empirical Green’s function events. The result of the inversion indicated that the rupture process included the break of two asperities. The first asperity, located close to the JMA hypocenter, was broken soon after the rupture started. This was followed by an extension of the rupture and the subsequent break of the second shallow asperity. The total moment of the mainshock was estimated to be 1.96E+19 N m, which is roughly consistent with the moment estimated by the F-net (1.36E+19 N m). Agreement between the observed and synthetic ground motions is quite satisfactory.
Key words:The 2007 Noto Hanto earthquake, rupture process, empirical Green’s function.
1.
Introduction
A large shallow crustal earthquake occurred on March 25, 2007 in Noto Hanto, Japan. According to the Japan Meteorological Agency (JMA), the hypocentral parameters are: origin time=09:41:57.9 JST; epicenter =37.220N, 136.685E; depth = 11 km; magnitude (MJ) =6.9. The earthquake caused serious damage to the Noto region, in particular to buildings and transportation facilities. Es-timations of the rupture process of an earthquake is im-portant both for estimating mainshock ground motions at sites where mainshock records are not available and for constructing realistic source models of future large crustal earthquakes for prediction of the strong motion. Conse-quently, a waveform inversion was conducted in this study to reveal the rupture process of the Noto Hanto earthquake. Some of the mainshock records obtained at several K-NET (Kinoshita, 1998) near-source strong motion stations are characterized by the predominance of later phases (as shown later in this article). In addition, site amplification factors estimated for some of the stations are characterized by large amplification at low frequencies. These obser-vations may indicate the existence of complicated two- or three-dimensional effects of surface geology in and around the source region. To avoid uncertainty in the surface ge-ology, aftershock records were used as empirical Green’s functions in the inversion. In addition, to assure that the path and the site effects are shared between the mainshock and aftershocks, the mainshock fault plane was divided into four domains, and four aftershocks were selected and
allo-Copyright cThe Society of Geomagnetism and Earth, Planetary and Space Sci-ences (SGEPSS); The Seismological Society of Japan; The Volcanological Society of Japan; The Geodetic Society of Japan; The Japanese Society for Planetary Sci-ences; TERRAPUB.
cated to the respective domains.
2.
Data and Method
In the empirical Green’s function method, it is important to use small events that share the path and the site effects with the large event. Because the mainshock fault plane of the 2007 Noto Hanto earthquake is relatively large and some of the stations which recorded the earthquake are lo-cated relatively close to the fault plane (Fig. 1), it might not be appropriate to represent the contributions from the entire fault plane with the records of only one aftershock. Thus, the mainshock fault plane was divided into four domains as shown in Fig. 1. The four aftershocks listed in Table 1 were selected to be used in the analysis, with each being allocated to one of the domains. These aftershocks were se-lected by paying particular attention to the resemblance of the Fourier phase of the mainshock and aftershock ground motions (Nozu, 2005, 2007). An examination of the Fourier phase indicted that the mainshock fault plane should be di-vided into at least four domains. The boundaries of the do-mains were determined by taking the locations of the after-shocks into consideration. Figure 1 shows the epicenters of the aftershocks determined by the Japan Meteorological Agency (JMA). Aftershock 4 is located very close to the mainshock hypocenter.
Five K-NET (Kinoshita, 1998) stations were selected for use in the analysis, as shown in Fig. 1 (solid triangles in-dicate the locations of these stations). These stations are located relatively close to the source region and recorded all of the four aftershocks as well as the mainshock. Al-though the stations indicated by open triangles (Fig. 1) also recorded all of the five events, records at these stations were not included in the analysis because the effects of soil
1030 A. NOZU: RUPTURE PROCESS OF THE 2007 NOTO HANTO EARTHQUAKE
Table 1. Source parameters for the mainshock and aftershocks.
Date∗ Altitude∗ Longitude∗ Depth∗ MJ∗ M0 Strike∗∗ Dip∗∗ Rake∗∗
(◦) (◦) (km) (N m) (◦) (◦) (◦)
Mainshock 2007/03/25 9:41:57.9 37.220 136.685 11.0 6.9 1.36E+19∗∗ 58 66 132
Aftershock 1 2007/03/25 15:43:30.5 37.293 136.772 9.0 4.5 1.25E+15∗∗ 40 48 137 Aftershock 2 2007/03/25 18:23:17.0 37.297 136.852 12.0 4.2 3.13E+14∗∗∗ — — — Aftershock 3 2007/03/28 10:51:2.6 37.175 136.612 10.0 4.6 1.29E+15∗∗ 60 80 150 Aftershock 4 2007/04/02 2:51:44.3 37.210 136.688 12.0 4.2 2.11E+14∗∗ 49 80 95 ∗JMA,∗∗F-net (www.fnet.bosai.go.jp),∗∗∗estimated from the spectral ratio between the aftershocks 1 and 2.
Fig. 1. The fault plane of the mainshock assumed for the inversion (large rectangle), the K-NET stations used for the inversion (solid triangles), the mainshock epicenter reported by JMA (small solid rectangle) and the epicenters of the aftershocks used in the analysis (small open rectan-gles). The fault plane was divided into four domains. Four aftershocks were selected, each of which is close to one of the four domains. Open triangles indicate K-NET stations that were not used in the analysis be-cause the effects of soil nonlinearity are anticipated at these stations.
linearity are anticipated at these stations.
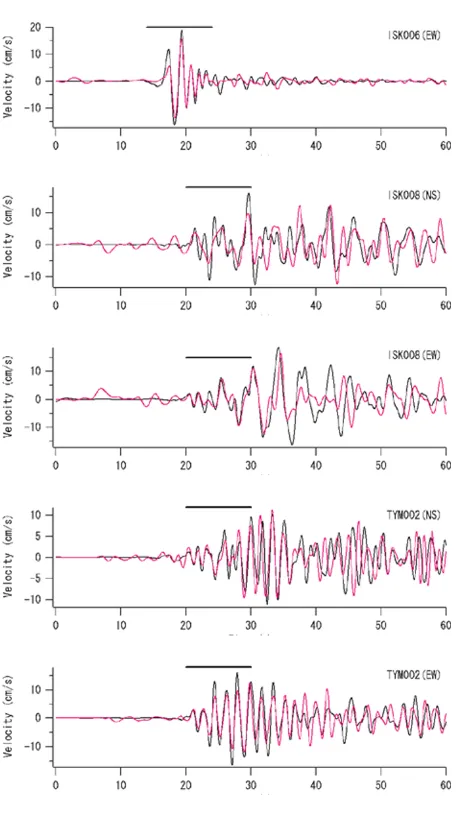
Figure 2 shows the mainshock velocity waveforms (0.2– 1 Hz) at five stations; these were obtained by integrating the accelerograms in the frequency domain. The waveforms at ISK003, ISK008 and TYM002 are characterized by the pre-dominance of later phases with a long duration (except for the NS component at ISK003). In addition, the site am-plification factors at ISK003, ISK008 and TYM002, which were estimated using a spectral inversion technique (Nozu et al., 2007), are characterized by large amplification at low frequencies (Fig. 3). These observations may indicate the existence of complicated two- or three-dimensional effects of surface geology at these sites. The effects due to the propagation path may be another reason for the later phases at ISK003, ISK008 and TYM002 because these are rela-tively long-distant sites. The use of empirical Green’s func-tions is thus encouraged to avoid uncertainty in the path and site effects.
The least-squares linear waveform inversion (Nozu,
Fig. 2. Comparison of the observed (black traces) and synthetic (red traces) mainshock velocities (0.2–1.0 Hz) as a result of the waveform inversion. The thick horizontal bars indicate the portions of data used for the inversion.
Fig. 2. (continued).
radially at a constant velocity of 3.4 km/s. The effect of this choice in velocity will be discussed in the following sec-tion. At each fault element, the moment rate function after passage of the rupture front is expressed as a convolution of an impulse train with the moment rate function of the af-tershock allocated to that particular element (Nozu, 2007). The impulse train spans 3.0 s and consists of 12 impulses at equal time intervals of 0.25 seconds. Thus, the height of each impulse corresponds to the ratio of the moment release during each 0.25-s interval in terms of the moment of the af-tershock. The ratio is determined through the inversion.
Velocity waveforms from the aftershocks (0.2–1 Hz) were obtained by integrating the accelerograms in the fre-quency domain and used as the empirical Green’s functions. Conventional corrections for the geometrical spreading and time shifts (Irikura, 1983) were applied to the Green’s func-tions to represent arrivals from each fault element (Nozu, 2007). The radiation coefficient is not corrected in this anal-ysis. The shear wave velocity in the source region was as-sumed to be 3.4 km/s based on the work by Kamata and Takemura (1999). Absolute time information for both the mainshock and the aftershock recordings was used (Nozu, 2007).
Fig. 3. Site amplification factors estimated by using the spectral inversion technique at stations used for the analysis (Nozuet al., 2007).
1032 A. NOZU: RUPTURE PROCESS OF THE 2007 NOTO HANTO EARTHQUAKE
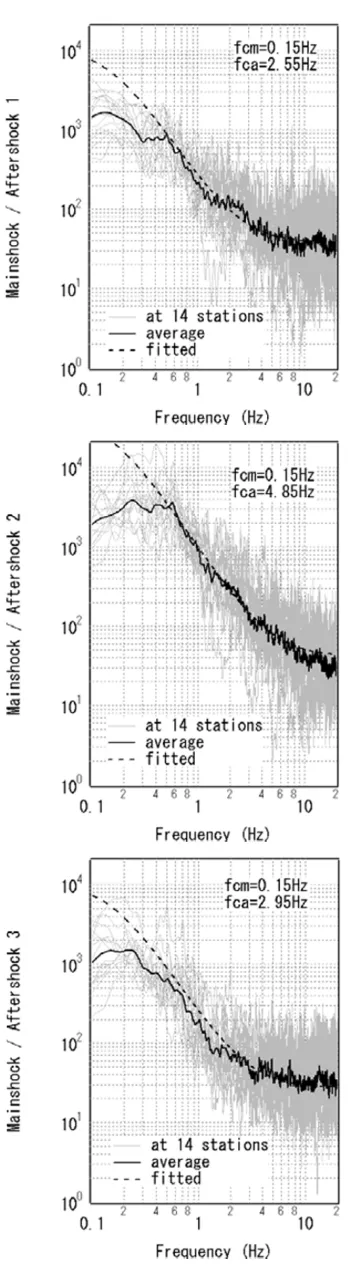
Fig. 4. Fourier spectral ratio of the mainshock and the aftershock records at 14 K-NET stations (gray lines) and their average (black lines). Also plotted are the spectral ratios obtained from theω−2 spectral model (dotted lines) for which the moment ratios are determined based on Table 1. The corner frequencies are determined to be consistent with the observed spectral ratio. The determined corner frequencies are shown at the top-right corner of each panel.
Fig. 4. (continued).
Fig. 5. Final slip distribution for the 2007 Noto Hanto earthquake ob-tained as a result of the waveform inversion. The star indicates the JMA hypocenter, i.e., the rupture starting point assumed for the waveform inversion. The absolute value of the slip was obtained assuming the af-tershock moments listed in Table 1. The total moment of the mainshock is estimated to be 1.96E+19 N m, which is roughly consistent with the moment estimated by the F-net (1.36E+19 N m).
Fig. 6. Slip for each time window of 2 s during the 2007 Noto Hanto earthquake obtained as a result of the waveform inversion.
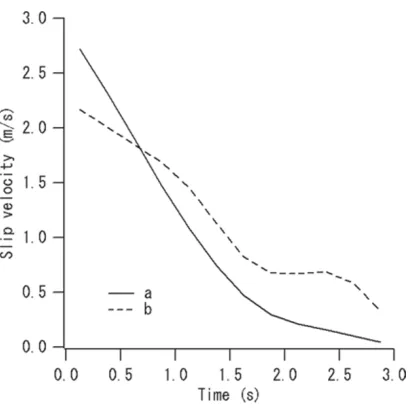
Fig. 7. Slip velocity time functions at asperities (a and b in Fig. 5) as a result of the waveform inversion. The abscissa indicates the time after passage of first-time window-triggering front. The time functions correspond to the fault elements with largest final slip in the asperities a and b.
than 1 Hz are used in the analysis.
Non-negative least-square solutions were obtained using the algorithm of Lawson and Hanson (1974). In the analy-sis, constraints were imposed to minimize the second order derivative of the slip on the rupture area (Nozu, 2007). At boundaries of regions allotted to different aftershocks, the absolute moment from each element is assumed to be con-tinuous. The moments of the aftershocks 1, 3 and 4 were determined by the F-net (Fukuyamaet al., 1996), as listed in Table 1. The moment of Aftershock 2, which was not determined by the F-net, was estimated from the averaged spectral ratio of Aftershocks 1 and 2 at low frequencies at the K-NET stations (Table 1).
3.
Results and Discussion
The synthetic mainshock velocities (0.2–1 Hz) as a result of the inversion are compared with the observed ones in Fig. 2. Agreement between the observed and synthetic waves is satisfactory.
Fig. 8. Relation between the first-time window-triggering velocity and VR defined in Eq. (1) and averaged for the ten components (five sites×two components). VR increases with the increase of the triggering velocity.
1034 A. NOZU: RUPTURE PROCESS OF THE 2007 NOTO HANTO EARTHQUAKE
rupture and then by the break in the second shallow asperity, labeled as ‘b’ in Fig. 5.
Figure 7 shows the slip velocity time functions at the as-perities (labeled a and b in Fig. 5) as a result of the wave-form inversion (The time functions at the fault elements with largest final slip in asperities a and b). These time func-tions are preferable because they are more or less similar to those obtained from dynamic fault models (e.g., Nakamura and Miyatake, 2000), in a sense that the slip velocity is large at the beginning and then gradually slows down.
Figure 8 shows the relation between the first-time window-triggering velocity and the goodness of fit. Here the goodness of fit is evaluated by introducing variance re-duction (VR), defined by observed wave. The integration is taken over the same time window as that used for the inversion (Fig. 2). As can be seen in Fig. 8, VR increases with increasing triggering velocity. Thus, the triggering velocity of 3.4 km/s was employed in this analysis, under the assumption that the rupture velocity does not exceed the shear wave velocity.
4.
Conclusion
A waveform inversion was conducted to reveal the rup-ture process of the 2007 Noto Hanto, Japan, earthquake us-ing strong ground motion records of the K-NET. To avoid uncertainty in the subsurface structure in and around the source region, aftershock records were used as empirical Green’s functions. To ensure that the path and the site ef-fects are shared between the mainshock and aftershocks, the mainshock fault plane was divided into four domains, each of which was allocated to one of the aftershocks used as the empirical Green’s function events. The result indicates that the rupture process included the break of two asperi-ties. The first asperity, located close to the JMA hypocen-ter, was broken soon after the rupture starting time. The rupture then extended, and the second shallow asperity was broken. The total moment of the mainshock is estimated to be 1.96E+19 N m, which is roughly consistent with the mo-ment estimated by the F-net (1.36E+19 N m). The obtained slip velocity time functions at the asperities are preferable
because they are more or less similar to those obtained from dynamic fault models—i.e., the slip velocity is large at the beginning and then gradually slows down. Agreement be-tween the observed and synthetic ground velocities is quite satisfactory.
Acknowledgments. The author is grateful to the National Re-search Institute for Earth Science and Disaster Prevention, Japan, for providing strong motion data of the K-NET and CMT solutions by the F-net. The manuscript was significantly improved based on the comments from Dr. Yoshiaki Shiba, Central Research Institute of Electric Power Industry, and an anonymous reviewer.
References
Fukuyama, E., M. Ishida, S. Hori, S. Sekiguchi, and S. Watada, Broadband seismic observation conducted under the FREESIA Project,Rep. Natl. Res. Inst. Earth Sci, Disas. Prev.,57, 23–31, 1996.
Fukuyama, E., M. ishida, D. S. Dreger, and H. Kawai, Automated seismic moment tensor determination by using on-line broadband seismic wave-forms,Zisin,51, 149–156, 1998 (in Japanese with English abstract). Hartzell, S. H. and T. H. Heaton, Inversion of strong ground motion and
teleseismic waveform data for the fault rupture history of the 1979 Imperial Valley, California, earthquake,Bull. Seismol. Soc. Am.,73, 1553–1583, 1983.
Irikura, K., Semi-empirical estimation of strong ground motions during large earthquakes,Bull. Disaster Prevention Res. Inst., Kyoto Univ.,32, 63–104, 1983.
Kamata, M. and M. Takemura, Source depth and focal mechanism of the 1993 Noto-Hanto-Oki earthquake and subsurface structures in and around Noto Peninsula derived from Rayleigh waves observed at local stations,Zisin,52, 255–270, 1999 (in Japanese with English abstract). Kinoshita, S., Kyoshin Net (K-net),Seimol. Res. Lett.,69, 309–332, 1998. Lawson, C. L. and R. J. Hanson,Solving Least Squares Problems,
Prentice-Hall, Inc., Englewood Cliffs, New Jersey, 1974.
Nakamura, H. and T. Miyatake, An approximate expression of slip velocity time function for simulation of near-field strong ground motion,Zisin, 53, 1–9, 2000 (in Japanese with English abstract).
Nozu, A., Variable-slip rupture model for the 2004 Mid Niigata Prefecture (Niigata-ken Chuetsu) earthquake—waveform inversion with empirical Green’s functions—,Zisin,58, 329–343, 2005 (in Japanese with En-glish abstract).
Nozu, A., Variable-slip rupture model for the 2005 West Off Fukuoka Pre-fecture, Japan, earthquake—waveform inversion with empirical Green’s functions—,Zisin,59, 253–270, 2007 (in Japanese with English ab-stract).
Nozu, A., T. Nagao, and M. Yamada, Site amplification factors for strong-motion sites in Japan based on spectral inversion technique and their use for strong-motion evaluation,J. Jpn. Assoc. Earthq. Eng.,7, 215–234, 2007 (in Japanese with English abstract).