CSEIT16125 | Received: 17 September 2016 | Accepted: 25 September 2016 | September-October-2016 [(2)5: 33-45]
International Journal of Scientific Research in Computer Science, Engineering and Information Technology © 2016IJSRCSEIT | Volume 1 | Issue 2 | ISSN : 2456-3307
33
Spatial Distribution of Terrorists Attacks in Selected
Local Governments in Borno State, Nigeria
Ayorinde Kappo
1*, Maruf Orewole
2, Toyosi Adedoja
1, Adamu, O., Amos,I.
1, Alaga, A.
1Corresponding Author’s email: duchilocks@gmail.com
1
Cooperative Information Network, National Space Research and Development Agency, Mathematics Building, Obafemi Awolowo University, Ile- Ife, Nigeria
2
National Center for Technology Management,, Ile- Ife, Nigeria
ABSTRACT
Nigeria has witnessed an unprecedented increase in terrorist attacks in the last five years especially in the North eastern part by the Boko haram sect. This has culminated into thousands of deaths and displacement of hundreds of thousands from their towns and villages. However, despite the military efforts to curtail the insurgency, the terrorist attacks still occur abated in the region. Hence there is need to study the spatial distribution of the attacks and generate spatial information that would be useful in implementing effective counter insurgency strategies. Spatial data of terrorist attacks obtained from national emergency management agency (NEMA) and global terrorism database (GTD) in addition other ancillary data were analysed using geospatial techniques. These data were integrated into a geodatabase and spatial analysis carried out to determine the spatial characteristics of the terrorist attacks. The result shows that the pattern of the terrorist attacks is clustered and its orientation towards the north east of the study area. The hotspot of the terrorist attacks are Gwoza and Bama while central feature of attacks is Baga town; Maiduguri has the highest number of IDPS of 14,000 while Konduga has the lowest number of IDPS; Kalga has the highest number of fatalities. The attack hotspots is close to the border indicating transborder movement of the terrorists. Hence, more military force should be deployed to the Gwoza and Bama to counter the insurgent attacks.
Keywords: Terrorist Attacks, GIS, Hotspots, Spatial Analysis, Insurgency.
I.
INTRODUCTION
The term “Terrorism” is any form of violence or threat meant to coerce an individual, group or entity to act in a manner in which the individual, group or entity could not otherwise lawfully force them to act (1). This means that these acts are intended to intimidate individuals or group of people collectively to coerce change in government conduct through the use of mass destruction, assassination or kidnapping.. The psychological impacts generated in the mind of people matter more to the terrorist than the physical attack on the victims. Some activities of the terrorists include aircraft hijacking, suicide attacks, mass murder and insurgency with transmit national borders. Consequently, terrorism has attracted global interest and is subject of international discourse. The thinking of policy formulators and law enforcement agents is
increasingly shaped by the need to respond appropriately to the threats or terrorism. Terrorism threatens fundamental nation’s law and order, human rights and it is the enemy of mankind. It has been
regime, feeling of insignificance, weak government, separation, oppression and inequality (1). Terrorism is fuelled by various factors. These include the openness of free societies, the easy access to technologies by means of violence and a radical and global ideology.
Conflicts in some countries particularly in the Middle East have inevitably formed a global issue and solidarity among terrorists. This global issue has become a unifying factor to share the suffering and establish a sense of togetherness based on religious brotherhood among the believers to resist against the oppressor. Nigeria has witnessed an unprecedented increase in terrorist attacks in the last five years especially in the North eastern part by the Boko haram sect culminating into thousands of deaths in both civilian population and military force and displacement of thousands from their towns and villages (2-4). Boko Haram has intensified its operation in the North-East of Nigeria despite the state of emergency that was declared by the federal government in the three states in the northern region where Boko Haram activities are concentrated. The activities of the sect have been of concern to scholars who have written various academic papers on the modus operandi of Boko Haram. Studies by (6) analyzed the origin and ideology of the sect, from their analysis they posit that Jama'atu Ahlis Sunna Lidda'awati Wal-Jihad better known as Boko Haram is an Islamic terrorist group that has a strong operational based in the northeast of Nigeria. The ideology of the sect according them is to bring to an end the secular system of government and introduce sharia law in Nigeria. However, (2) did not subscribe to the notion that the Boko Haram aim is to Islamize Nigeria through the introduction of sharia law. He argued that the foot soldiers of the sect are unemployed and disgruntled youths who have been paid by unscrupulous politicians to cause mayhem in the country because of their selfish ambitions.
The high rate of poverty, unemployment and political corruption has been blamed on the elongation of the conflict. Most of the foot soldiers of Boko Haram are youths that are frustrated because the lack employment, income and they have been disdained by politicians after being used by these politicians for their elections victory. Studies by (7-9) assert that the youths enlisted into Boko Haram because of the prevalence of poverty in the North. The poverty profile of Nigeria that was released in 2011 by the National Bureau of Statistics
(NBS) indicated that the northern region has more poor people than people in the south. Aside the killings, kidnapping and bombing of the sect, their activities constitute a hindrance to the socioeconomic development of the northeast where their operation is focused and Nigeria as a whole. Similarly, most researches on the Boko Haram insurgency agree that the sect heinous crimes hinder socio-economic development in Nigeria (6,10,11). In combating terrorism in the study area, it will be worthwhile to explore geospatial technology in minimizing the activities of the terrorists.
Geospatial techniques provide the means to collect and use geographic data which are spatially referenced to the earth. Geographic Information System (GIS) is capable of integrating, storing, editing, analysing, sharing and displaying geographically referenced data. It has been commonly said that whereas information is power, geographic information implies its might and speed” (5). This information provides a base for all intelligence operations, tactical decisions and operations, planning and execution of most battlefield activities. In order to successfully support current and future military operations in the study area, geospatial information must be rapidly integrated and analysed to meet on going force structure evolution and new mission directives.
1.1 Statement of the Problem
The frequency of insurgency, terrorism and other violent crimes by the militant Islamist group known as Boko Haram, has caused severe havoc in North-eastern Nigeria through suicide bombing, assassination and abductions claiming over and destruction of properties worth billions of naira (12). The internal displace monitoring center (IDMC) estimates that there are almost 2,000,000 internally displaced people (IDPs) in Nigeria as of 31 December 2015 as result of boko haram attacks (13).
1.2 Aim and Objectives of the study
This study is aimed at assessing the spatial distribution of terrorist attacks in selected local government areas in Borno State, Nigeria with the view of providing vivid description of attacks and its attendant effects to provide policy makers with information required for making decision.The specific objectives are to:
a. analyze the terrorist attacks in the study area; b. determine the distribution pattern of the terrorist
attacks in the study area and
c. identify the hotspot of the terrorist attacks in the study area.
1.3 The Study Area
The general study area is bounded by latitudes 100 30’ and 130 00’ N and longitudes 110 30’ and 140 40’ E in Borno State, North -eastern Nigeria. It has an area of about 12,100 square kilometres. The area is located in the semi-arid region and is made up of ten local government areas that are mostly affected by insurgency: Michika, Hong, Mubi South and North, Girei, Madagali, Damboa, Konduga, Maiduguri, Biu, Kaga, Bama, Dikwa, Jere, Mafa, Chibok, Magumeri, Hawul, Gwoza, Askira/Uba, Geidam, Damaturu, Gujba, Tarmua and Gulani.(Figure 1). The Southern and Eastern part of the study area is predominantly hilly, the geology which is underlying by the basement complex. The areas is characterized by mountains, plateau, ridges, escarpment and related features (14). The landscape developed on the young sedimentary rock on the Chad formation. The area features a variety of fluvial and Aeolian like fossil sand dunes, beach ridges, and interdunes ridges depression (15). The study area is drained by two rivers; one is towards the south draining to river Benue while the other is towards Lake Chad. The soil types are predominantly sandy at the surface and also low in organic matter content and low weatherable minerals, rapid oxidation of organic residue and frequent exposure of soil due to seasonal bush burning characterize these soils. The climate of the study area is semi-arid type with distinct seasonal and diurnal temperature ranges, a long dry season followed by a short wet season. The vegetation types falls within the transition zones of the Sudan and Sahel savannah type of vegetation. The distribution and character of the vegetation result from the interplay of climate, edaphic and biotic factors. Generally the natural vegetation consists of shrubs, short grasses and
scattered trees. The study area is agrarian with people engaged in farming, cattle rearing and fishing, important grown include millet, groundnut and beans.
II.
METHODS AND MATERIAL
This methodology adopted by this research was divided into three stages namely: data acquisition, processing and analysis as depicted in figure 2.
Figure 2 :
Flow Chart
2.1
Description of Data/Sources
Various forms of data from both primary and
secondary sources were used for this study. The
primary data used were direct field observations
carried out in affirming the insurgent activities and
GPS coordinates of some geographic features
recorded in the study area. The secondary data
consists of Geo-Eye satellite image, boundary
feature from OSGOF, population data from NPC,
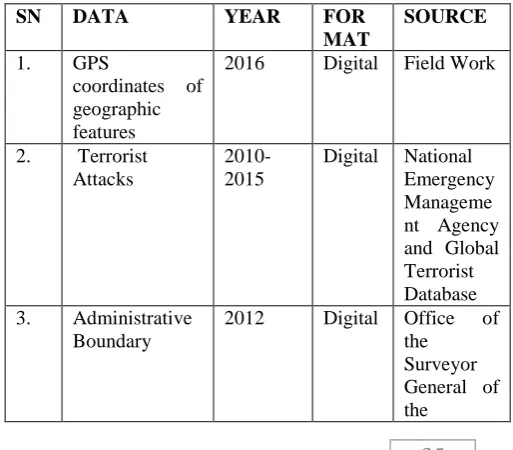
NEMA and GTD terrorist attacks data (Table 1).
Table 1:
Data Characteristics and their Sources
Federation (OSGOF). 4 Population Data 2006 Digital National
Population
The population density and current population was determined from the population data. The road network was extracted from the Geo-Eye satellite images. The terrorist attacks was imported as point feature while the population data was imported as polygon feature. The administrative boundary was used to delineate the study area. All data were converted to geodatabase format and organized in different thematic layers.
2.3 Assessment of the Spatial Pattern of Terrorist Attacks
The modelling of the spatial pattern provides the distribution and pattern of the terrorist attacks in the study area. The spatial patterns are geo-statistical operations that identify the mean centre, median centre, mean central feature, directional distribution, density, standard distance and pattern of attacks in the study area. The coordinates of terrorist attack data obtained from NEMA was used to determine the spatial pattern. Attribute information on the spatial distribution of other features include the total number of people, number of internally displaced people, number of lives loss, frequency of attacks, number of houses, shops, schools, churches and vehicles destroyed in the study area. The road network in the study area was also used to evaluate the proximity of the terrorist attacks.
This identifies the most centrally located feature within a set of features in a geographic boundary. The central feature tool identifies the most centrally located feature in a point, line, or polygon feature class. Distances from each feature centroid to every other feature centroid in the dataset are calculated and summed. Then the feature associated with the shortest accumulative distance to all other features (weighted if a weight is specified) is selected and copied to a newly created output feature class. The Central Feature tool is useful for finding the center when you want to minimize distance (Euclidean or Manhattan distance)
for all features to the center. The central feature of the terrorist attacks in the study area was calculated to identify the area that is most prone to the attacks in the region and recommend fortifying the town defenses.
2.3.1 Mean Centre of the Terrorist Attacks
The mean centre is the average x- and y-coordinate of all the features in the study area. It's useful for tracking changes in the distribution or for comparing the distributions of different types of features. The mean centre was calculated using formula 1 in the in spatial analyst of ArcGis. The mean centre of the terrorist attacks in the study area was calculated to suggest a central place for sitting a military command that can deploy troops and machineries to counter terrorist attacks within a reasonable time frame.
where x and y are the coordinate for features and n equal to the number of features.
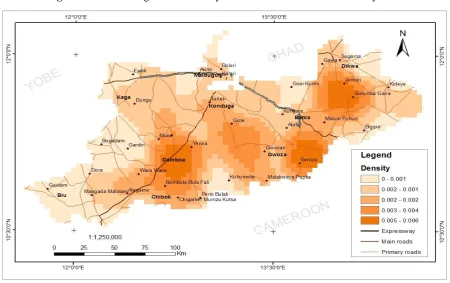
2.3.2 Density of Attacks
The kernel density tool calculates the density of features in a neighbourhood around those features. It can be calculated for both point and line features. Kernel Density calculates the density of point features around each output raster cell. Conceptually, a smoothly curved surface is fitted over each point. The surface value is highest at the location of the point and diminishes with increasing distance from the point, reaching zero at the Search radius distance from the point. Only a circular neighbourhood is possible. The density map created is sometimes called heat map or dot density map. The density map of the terrorist attacks was created to show areas where the attacks were more intense in the study area.
2.3.3 Standard Distance of Terrorist Attacks
the radius equal to the standard distance value. The Standard Distance tool creates a circle polygon. The standard distance was calculated to determine the dispersion of the terrorist attacks around the mean centre in the study area.
2.3.4 Distribution Pattern of Terrorist Attacks
This distribution pattern describes the pattern of the clusters of the terrorist attacks and shows whether the occurrence of the attacks are clustered, random or dispersed in the study area. The spatial autocorrelation tool in ArcGis spatial analyst tool was used to determine the distribution pattern of the terrorist attacks. This measure spatial autocorrelation for a series of distances and optionally creates a line graph of those distances and their corresponding z-scores. When values for neighbouring features are either both larger than the mean or both smaller than the mean, the cross-product will be positive. When one value is smaller than the mean and the other is larger than the mean, the cross-product will be negative. In all cases, the larger the deviation from the mean, the larger the cross-product result. If the values in the dataset tend to cluster spatially (high values cluster near other high values; low values cluster near other low values), the Moran's Index will be positive. When high values repel other high values, and tend to be near low values, the Index will be negative. If positive cross-product values balance negative cross-product values, the Index will be near zero. The numerator is normalized by the variance so that Index values fall between -1.0 and +1.0. Z-scores reflect the intensity of spatial clustering, and statistically significant peak z-scores indicate distances where spatial processes promoting clustering are most pronounced. These peak distances are often appropriate values to use for tools with a distance band or distance radius parameter.
2.3.4 Directional Distribution of Terrorist Attacks
Directional distribution measures the trend for a set of points or areas by calculating the standard distance separately in the x- and y-directions. These two measures define the axes of an ellipse encompassing the distribution of features. The ellipse is referred to as the standard deviational ellipse, since the method calculates the standard deviation of the x-coordinates and y-coordinates from the mean centre to define the axes of the ellipse. The ellipse allows you to see if the
distribution of features is elongated and hence has a particular orientation. The directional distribution was determined using directional distribution tool in spatial analyst of ArcGis and shows the direction which the terrorist attacks are occurring in the study area.
√∑ ( ̅) Kernel Density calculates the density of point features around each output raster cell. Conceptually, a smoothly curved surface is fitted over each point. The surface value is highest at the location of the point and diminishes with increasing distance from the point, reaching zero at the Search radius distance from the point. Only a circular neighbourhood is possible. The density map created is sometimes called heat map or dot density map. The density map of the terrorist attacks was created to show areas where the attacks were more intense in the study area.
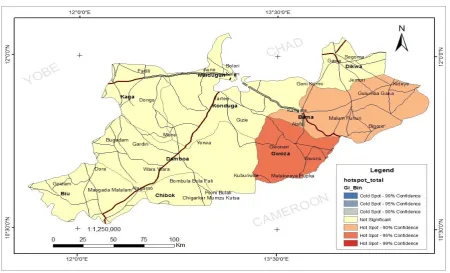
2.4: Hotspot Analysis
when the local sum is very different from the expected local sum, and that difference is too large to be the result of random chance, a statistically significant z-score results. In determining the hotspot of the terrorist attacks, data on terrorist attacks obtained from the National Emergency Management Agency, Abuja containing information on the coordinates of attacks areas, total number of persons affected by the attacks, number of internally displaced people, number of death recorded, frequency of attacks, number of schools, churches, shops, houses and vehicles affected the terrorist attacks in the North East, Nigeria. The hotspot of the terrorist attacks was determined using the hotspot analysis tool in ArcGis software and hotspot areas identified using the frequency of attacks.
III.
RESULTS AND DISCUSSION
3.1 Spatial Analysis of Terrorist Attacks
The terrorist attacks were analysed and spatial characteristics determined include the mean centre,
median centre, central feature, directional distance and standard distance of the terrorist attacks in the study area. The population density, internally displaced people, fatalities and frequency of attack was also determined. The mean centre and median attacks are located the Goneri, north-eastern part of Damboa local government area between Yamtaji and Bullaulm but with different geographic coordinates (fig 3). The close proximity of both the mean and median centre indicate minimal presence of outliers and almost binomial distribution of the data. The central feature of attack is also located at Goneri in between Damboa and mulgwe Mayirirna along the highway road network towards the north-eastern part of the study area. The central feature is surrounded by the most frequently attacked areas and equidistant to all other places of the attacks. However, this does not imply that the central feature of attack is the most frequently attacked. The close proximity of the central feature, median centre to mean centre of attacks validates the selection of Goneri as potential site for establishing a response centre to rapidly deploy resources against insurgent attacks.
Figure 3. Mean Centre and Standard Distance of Attacks in the Study Area
The standard distance is represented by a circle with the mean centre of attack as its centre. The radius of
encompassed other places of attacks and covers Gwoza, Maiduguri and part of Chibook, Damboa, Konduga, Kaga and Bama local government areas. The area coverage of the standard distance is 424km2.
The estimated population calculated using the NPC 2006 census growth rate of 3.4% in the study area is 549,180. The UNPFA 2015 population estimate for Borno state is 345,169 (16). The estimated population density of the different local government area varied from 55 to 341. However, the activities of the insurgents have created high number of IDPS and lead to thousands of fatalities. Hence, the estimated population was recalculated taking into account the number of IDPS and fatalities recorded in the region. An estimated population of 452,231 was derived with the population density ranging from 45 to 452 in the different local government areas (Fig 5). Maiduguri,
Gwoza, Bama and Dikwa were the most densely populated areas.
Figure 4. Number of IDPs in the Study Area
Similarly, fatalities data obtained from both NEMA and GTD reveal a total of 23,456 fatalities and ranged from 456 to 15,600 across the local government areas (fig 5). According to IDMC, over 20,000 lives have been lost due to terrorist attacks in Borno state (13). Though the actual figure of fatalities is not known, the figure determined is a close estimate of the number of fatalities recorded in the study area.
The frequency of attacks data show that Bama, Gwoza and Maiduguri were most frequently attacked local government areas while Dikwa, Kaga and Biu were the least attacked local government areas as seen in figure 8. Bama, Gwoza and Maiduguri are densely populated and this could account for the frequent attacks in these areas.
Figure 6. Frequency of Terrorist Attacks in the Study Area
3.2 Spatial Distribution of Terrorist Attacks
Figure 7. Nearest Neighborhood Analysis of Terrorist Attacks in the Study Area
Figure 8. Density of Terrorist Attacks in the Study Area
Figure 9. Directional Distribution of Terrorist Attacks in the Study Area
3.3 Hotspot of Terrorist Attacks
Figure 10. Hotspot of Terrorist Attacks in the Study Area
IV.CONCLUSION
This study examined the spatial distribution of terrorist attacks in selected local government areas in Borno state, Nigeria from 2010 to 2015. Geo-statistical information generated from terrorist attacks data reveal that the mean center of terrorist attacks was located in Goneri, Damboa local government area. Hence, response and relief center can be established in area to service other areas in the region. The distribution pattern of the attacks is clustered with most of the attacks concentrated in Damboa, Gwoza and Maiduguri, the administrative capital of the state. These attacks originate from the borders areas in east towards the areas in south and state capital. Consequently, a high number of fatalities and even higher number of IDPs has been recorded in the region. The geographical representation of attacks, fatalities and IDPs provide vivid information on locations which will be valuable for decision and policy makers charged with managing the terrorist menace. The location of the terrorist hotspot areas identified as Gwoza and Bama confirmed the linear and transnational movement of the terrorists. Therefore, effectively counter terrorist measures and transnational collaboration should be embarked upon to curtail the terrorist activities in the region.
V.
REFERENCES
[1] Arvind, S. (2014).Impact of Terrorism on Social Economic and Legal Structure of the Countries Obstacle to Global Peace.
[2] Adibe, J. 2013. "What do we really Know about Boko Haram?" In Boko Haram: Anatomy of a Crisis, edited by I. Mantzikos, 9-15. Bristol, UK: e-International Relations.
[3] Crowley, R. and H. Wilkinson. 2013. “Boko Haram: A New Threat in West Africa.” In Conflict over Resources and Terrorism: Two Facets of Insecurity, edited by M. Tremolieres, 100-108. OECD Publishing.
[4] Oarhe, O. 2013. “Responses of the Nigerian Defense and Intelligence Establishments to the Challenge of Boko Haram.” In Boko Haram: Anatomy of a Crisis, ed. I. Mantzikos, 85-91. Bristol: e-International Relations.
[5] Nagy, P. (2004).“GIS in the army of 21st century” AARMS 3(4) 587-600
[6] Eme, O. I. &Ibietan, J. (2012).The Cost of Boko Haram Activities in Nigeria. Arabian Journal of Business and Management Review. Vol. 2, No.2. 10-32.
[8] Awojobi, O.N., 2014. The Socio-Economic Implications of Boko Haram Insurgency in the North-East of Nigeria. International Journal of Innovation and Scientific Research, 11(1), pp.144-150
[9] Onuoha, F. C. (2014). Why Do Youth Join Boko Haram? United States Pace Institute. 2301 Constitution Ave., NW •Washington, DC 20037 • 202.457.1700 • fax 202.429.6063.
[10] Ogochukwu, E. O. (2013). Socio-Economic Implications of the Boko Haram Insugence in Nigeria: 2009-2013. Unpublished Thesis. Department of Political Science Caritas University, Amorji-Nike, Enugu.
[11] Odita, A. O. & Akan, D. (2014).Boko Haram Activities: A Major Set Back to Nigerian Economic Growth. IOSR Journal of Economics and Finance. Volume 3 (5): 1-6.
[12] Ovaga, O. 2015. The Socio-Economic Implications of Book-Haram Activities in Northern Nigeria. Review of Public Administration & Management. Vol.1 (2): 10-14. [13] Internal Displacement Monitoring Center (IDMC). 2015. “Nigeria IDP Figures Analysis.” Accessed October 20, 2014. http://www.internal-
displacement.org/sub-saharan-africa/nigeria/figures-analysis.
[14] Udo, R.K., 1970. Geographical regions of Nigeria. Univ of California Press.
[15] Thiemeyer, H., 1992. ON THE AGE OF THE BAMA RIDGE-A NEW C-14 RECORD FROM KONDUGA AREA, BORNO STATE, NE NIGERIA. Zeitschrift fur Geomorphologie, 36(1), pp.113-118.
[16] United Nations Population Fund (UNFPA). 2014. “UNFPA Nigeria: State’s Population Projection.” Accessed October 20, 2014. http://nigeria.unfpa.org/populationanddevelopme nt.html.
[17] Spindler, W. 2014. “On-going Violence in Nigeria Continues to Displace People to Neighboring Countries.” Press Briefing, from Palais des Nations, Geneva, 17 October 2014. [18] Medina, R. M. and G. F. Hepner. 2013. The
Geography of International Terrorism: An Introduction to Spaces and Places of Violent Non-State Groups. CRC Press.
[19] Siebeneck, L.K., Medina, R.M., Yamada, I. and Hepner, G.F., 2009. Spatial and temporal analyses of terrorist incidents in Iraq, 2004–
2006. Studies in Conflict & Terrorism, 32(7), pp.591-610.