CSEIT1722208 | Received : 28 March 2017 | Accepted : 08 April 2017 | March-April-2017 [(2)2: 699-703]
International Journal of Scientific Research in Computer Science, Engineering and Information Technology © 2017 IJSRCSEIT | Volume 2 | Issue 2 | ISSN : 2456-3307
699
An Automated Method based on Image Processing for Grading of
Harvested Mangoes
Tabbu Mulani
*, Shahin Khan,
Nazneen Shaikh
,
Poonam Lalge
Department of computer engineering, Trinity Academy of Engineering , Pune, Mahrashtra, India
ABSTRACT
The proper grading of fruits is very important to increase the profitability in agricultural and food industry . In this paper, a scheme for automated grading of mango (Mangifera Indica L.) according to maturity has been proposed. The proposed scheme grades the mangoes in four different categories, which are determined on the basis of market distance and market value. The image of mango is given to the system thereafter several preprocessing algorithms like Grey-Scaling, Blurring, Thresholding are applied followed by RGB to HSV conversion algorithm and K-means algorithm are applied to get the final result.
Keywords : Maturity, Quality, Grading, Days-to-rot, Grey scaling , Blurring.
I.
INTRODUCTION
Because of flavor and taste Mangoes is popular fruit. Mangoes cultivation is carried out in different favorable regions. During summer mangoes are harvested from gardens and then transported to various markets by distributors. According to distance and demand of market quality, the distributors demand batches of homogeneous quality and maturity. The variations become much wider due to variation in variety, location and weather condition at the time of harvesting. The grading of mangoes is thus an essential step; however it is a tedious job and it is difficult for the graders to maintain constant vigilance. If this task could be performed automatically , the result would be more objective; it would also save labor and enhance output.
In past, much research work has been carried for automated grading of fruits through analyzing aroma using electronic nose, in order to predict the ripeness of fruit [1]. In another work, a spectroscopy based fiber-optic and micro-fiber-optic device is presented for testing the quality and safety of foods [2]. Recently peach maturity prediction has been performed by estimating the fruit flesh firmness using multivariate retrieval techniques applied to the reflectance spectra acquired with the
spectrometer [3] . The application of machine vision in agriculture has increased considerably in recent years. There are many fields in which computer vision is involved, including terrestrial and aerial mapping of natural resources, crop monitoring [4], quality control in food and agriculture [5]–[7].
No such system still proposed for prediction of actual-days-to-rot, which is essential during transportation from one place to another and it also helps to select the market distance and market demand for sending fresh fruits (before start rotten). In most of the work, practical purpose of grading and the automated system for the purpose have not been taken into account. In the proposed work authors developed an automated system for grading of harvested mangoes based on actual-days-to-rot and quality level. The necessity, the key innovation of this proposed work and also the main concern of this paper is clearly summarized in the following:
The main contribution of the present work is, development of a real time automated for grading of harvested mangoes according to maturity level in terms of actual-days-to-rot and the quality attributes like color of the fruit. The prediction of actual-days-to-rot is more important than the maturity level, in decision making on the account of transportation delay.
II.
METHODS AND MATERIAL
A. Overview
The system aims in the automatic grading of mangoes based on the color of the mangoes. The color of the fruit gives us idea about the ripeness of the fruit. There are different maturity levels of the fruit based on its color.
The system takes the images of mangoes as input and then performs several pre processing techniques like gray scaling, blurring and thresholding after which the actual processing of the system begins.
The whole image of the mango is divided into blocks of size 16 x 16 pixels and each block is examined for black surface . The system is first trained with the training data set to which input will be compared. The training data set's each block's RGB values are converted into HSV values and stored into an array. The centroids of each HSV values of the training data set is calculated using K-means algorithm.
After the centroids of each array of hue ,saturation and value is calculated the input image's HSV values will be compared to the trained values that are stored in the database. The database contains the values for good as well as bad blocks of mangoes. The difference of centroid of a block of input image is calculated with the training data set. The block is graded based on the difference of centroid. The blocks are graded into the category from which the centroid distance is minimum. The data set will have values for the following categories: Excellent,Good,Average and Bad. Each block will be graded into these categories. The whole mango will be graded into a single category based on the grade that the majority of blocks have eg : If the majority of blocks are graded into good then whole mango will be graded under 'good' category.
B. Grey Scaling
Grayscale is a range of shades of gray without apparent color. The darkest possible shade is black, which is the total absence of transmitted or reflected light. The lightest possible shade is white, the total transmission or reflection of light at all visible wavelength s. Intermediate shades of gray are represented by equal brightness levels of the three primary colors (red, green and blue) for transmitted light, or equal amounts of the three primary pigments (cyan, magenta and yellow) for reflected light.In the case of transmitted light (for example, the image on a computer display), the brightness levels of the red (R), green (G) and blue (B) components are each represented as a number from decimal 0 to 255, or binary 00000000 to 11111111. For every pixel in a red-green-blue ( RGB ) grayscale image, R = G = B. The lightness of the gray is directly proportional to the number representing the brightness levels of the primary colors. Black is represented by R = G = B = 0 or R = G = B = 00000000, and white is represented by R = G = B = 255 or R = G = B = 11111111. Because there are 8 bit s in the binary representation of the gray level, this imaging method is called 8-bit grayscale.In the case of reflected light (for example, in a printed image), the levels of cyan (C), magenta (M), and yellow (Y) for each pixel are represented as a percentage from 0 to 100. For each pixel in a cyan-magenta-yellow (CMY) grayscale image, all three primary pigments are present in equal amounts. That is, C = M = Y. The lightness of the gray is inversely proportional to the number representing the amounts of each pigment. White is thus represented by C = M = Y = 0, and black is represented by C = M = Y = 100.
In some systems that use the RGB color model, there are 2 16 , or 65,636, possible levels for each primary color. When R = G = B in this system, the image is known as 16-bit grayscale because the decimal number 65,536 is equivalent to the 16-digit binary number 1111111111111111. As with 8-bit grayscale, the lightness of the gray is directly proportional to the number representing the brightness levels of the primary colors. As one might expect, a 16-bit digital grayscale image consumes far more memory or storage than the same image, with the same physical dimensions, rendered in 8-bit digital grayscale.
misnomer. In true black and white, also known as halftone, the only possible shades are pure black and pure white. The illusion of gray shading in a halftone image is obtained by rendering the image as a grid of black dots on a white background (or vice-versa), with the sizes of the individual domagenta (M), and yellow (Y) for each pixel are represented as a percentage from 0 to 100. For each pixel in a cyan-magenta-yellow (CMY) grayscale image, all three primary pigments are present in equal amounts. That is, C = M = Y. The lightness of the gray is inversely proportional to the number representing the amounts of each pigment. White is thus represented by C = M = Y = 0, and black is represented by C = M = Y = 100.
In some systems that use the RGB color model, there are 2 16 , or 65,636, possible levels for each primary color. When R = G = B in this system, the image is known as 16-bit grayscale because the decimal number 65,536 is equivalent to the 16-digit binary number 1111111111111111. As with 8-bit grayscale, the lightness of the gray is directly proportional to the number representing the brightness levels of the primary colors. As one might expect, a 16-bit digital grayscale image consumes far more memory or storage than the same image, with the same physical dimensions, rendered in 8-bit digital grayscale.
In analog practice, grayscale imaging is sometimes called "black and white," but technically this is a misnomer. In true black and white, also known as halftone, the only possible shades are pure black and pure white. The illusion of gray shading in a halftone image is obtained by rendering the image as a grid of black dots on a white background (or vice-versa), with the sizes of the individual dots determining the apparent lightness of the gray in their vicinity. The halftone technique is commonly used for printing photographs in newspapers.
In some cases, rather than using the RGB or CMY color models to define grayscale, three other parameters are defined. These are hue, saturation and brightness . In a grayscale image, the hue (apparent color shade) and saturation (apparent color intensity) of each pixel is equal to 0. The lightness (apparent brightness) is the only parameter of a pixel that can vary. Lightness can range from a minimum of 0 (black) to 100 (white).
C. Blurring
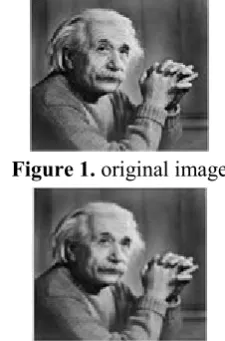
In blurring, we simple blur an image. An image looks more sharp or more detailed if we are able to perceive all the objects and their shapes correctly in it. For example. An image with a face, looks clear when we are able to identify eyes, ears, nose, lips, forehead e.t.c very clear. This shape of an object is due to its edges. So in blurring, we simple reduce the edge content and makes the transition form one color to the other very smooth.Types of filters
Blurring can be achieved by many ways. The common type of filters that are used to perform blurring are.
Mean filter
Weighted average filter Gaussian filter
1) Mean Filter
Mean filter is also known as Box filter and average filter. A mean filter has the following properties.
It must be odd ordered
The sum of all the elements should be 1 All the elements should be same
If we follow this rule, then for a mask of 3x3. We get the following result.
Since it is a 3x3 mask, that means it has 9 cells. The condition that all the element sum should be equal to 1 can be achieved by dividing each value by 9. As 1/9 + 1/9 + 1/9 + 1/9 + 1/9 + 1/9 + 1/9 + 1/9 + 1/9 = 9/9 The result of a mask of 3x3 on an image is shown below
Figure 1. original image
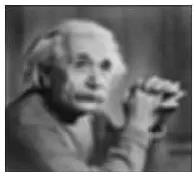
Figure 2. blurred image 3x3 mask
the mask, the more is the blurring. Because with greater mask, greater number of pixels are catered and one smooth transition is defined The result of a mask of 5x5 on an image is shown below
Figure 4. Original image 5x5 mask
Figure 5. Blurred image 5x5 mask
Same way if we increase the mask, the blurring would be more and the results are shown below.
Figure 6. Original image 7x7 mask
The result of a mask of 7x7 on an image is shown below.
Figure 7. Blurred image 7x7 mask
D. Thresholding
The simplest thresholding methods replace each pixel in an image with a black pixel if the image intensity is less than some fixed constant T , or a white pixel if the image intensity is greater than that constant. In the example image on the right, this results in the dark tree becoming completely black, and the white snow becoming completely white.
To make thresholding completely automated, it is necessary for the computer to automatically select the threshold T. We can categorize thresholding methods into the following six groups based on the information the algorithm manipulates :
Histogram shape-based methods, where, for
example, the peaks, valleys and curvatures of the smoothed histogram are analyzed
Clustering-based methods, where the gray-level samples are clustered in two parts as background and foreground (object), or alternately are modeled as a mixture of two Gaussians
Entropy-based methods result in algorithms that use the entropy of the foreground and background regions, the cross-entropy between the original and binarized image, etc.
Object Attribute-based methods search a measure of similarity between the gray-level and the binarized images, such as fuzzy shape similarity, edge coincidence, etc.
Spatial methods [that] use higher-order probability distribution and/or correlation between pixels Local methods adapt the threshold value on each
pixel to the local image characteristics. In these methods, a different T is selected for each pixel in the image.
III.
RESULTS AND DISCUSSION
For the experimental works five different varieties of mangoes locally termed as “Kumrapali” (KU), “Amrapali” (AM), “Sori” (SO), “Langra” (LA) and
“Himsagar” (HI) were collected from different places
The whole automated mango grading system was conducted for the five different varieties of mango and the performance accuracy of the proposed system obtained was 84%.
IV.CONCLUSION
In this research we built a proposed model of a mango fruit grading system. The software system analyzes the input image, preprocessing of image, features extraction and finally gradation. Proposed grading system grades the mango into four grades (though actual gradation can be extended up to sixteen) based on experts perception. Results show that the mango grading algorithm is designed viable and accurate. The actual days-to-rot prediction accuracy is 84% and the accuracy for measurement of surface defect is over 90%. The average time to grade one mango is approximately 0.4 second.
The limitation of this proposed system is that in the proposed system we have considered one side of mango
V.
REFERENCES
[1]. J. Brezmes et al., "Evaluation of an electronic nose to assess fruit ripeness," IEEE Sensors J., vol. 5, no. 1, pp. 97–108, Feb. 2005.
[2]. A. G. Mignani et al., "EAT-by-LIGHT: Fiber-optic and micro-Fiber-optic devices for food quality and safety assessment," IEEE Sensors J., vol. 8, no. 7, pp. 1342–1354, Jul. 2008.
[3]. M. Stefania, D. Marco, M. Rossano, C. Giovanni, and R. Dami-ano, "A spectroscopy-based approach for automated nondestructive maturity grading of peach fruits," IEEE Sensors J., vol. 15, no. 10, pp. 5455–5464, Oct. 2015.
[4]. G. Q. Jiang, C. J. Zhao, and Y. S. Si, "A machine vision based crop rows detection for agricultural robots," in Proc. IEEE Int. Conf. Wavelet Anal. Pattern Recognit., Qingdao, 2010, pp. 114–118. [5]. K. K. Patel, A. Kar, S. N. Jha, and M. A. Khan,
"Machine vision sysrem: A tool for quality inspection of food and agricultural products," J. Food Sci. Technol., Apr. 2012, vol. 49, no. 2, pp. 123–14
[6]. C. McCarthy, "Practical application of machine vision in australian agricultural research at NCEA," IEEE RAS TC Agricult. Robot. Autom. Webinar, Mar. 27–28, 2014