R E S E A R C H
Open Access
An optimized aggregate marker
algorithm for bandwidth fairness
improvement in classifying traffic networks
Ameen M. Alkharasani
1, Mohamed Othman
1,2*, Azizol Abdullah
1and Kweh Yeah Lun
1Abstract
The quality of service (QoS) requirements do not define a marker algorithm for service classes and managing network traffic to provide fair bandwidth sharing among aggregate flows. Additionally, the assured service is designed for applications relying on the Transmission Control Protocol (TCP). This article analyses and evaluates a new time sliding window traffic marker algorithm called the Optimized time sliding window Three Colour Marker (OtswTCM). The new design of the OtswTCM algorithm depends on the adaptability of the gamma (γ) concept in the Improved time sliding window Three Colour Marker (ItswTCM), the Double Improved time sliding window Three Colour Marker (I2tswTCM) and the Double Modified Double Improved time sliding window Three Colour Marker (M2I2tswTCM) algorithms to affect fairness and multiple protocols in classifying network traffic. This is achieved through separating marker TCP and User Datagram Protocol (UDP) and extending the marking probability for injecting more green and yellow traffic into the network. The marking probability mechanism was also studied to check how parameters in the traffic rate affect fairness. Extensive simulations were carried out to implement the algorithm using the NS2 simulator and compare the proposed marker algorithm with several other algorithms. The results show that the proposed marker algorithm is not affected by the number of flows and outperforms the previous marker algorithms in terms of fairness.
Keywords: Classifying network traffic, Quality of service, Aggregate marker algorithm, Fairness
1 Introduction
The world is now in the early stages of a wired and wire-less network revolution that can provide communication access for people, wherever they are. It is expected that the Internet and telecommunication networks would be com-bined into a new field that would challenge both engineers and computer programmers. The current requirements of the Internet and telecommunications would need to be studied to enable them to work in harmony. Consider this instead: the Internet does not provide a guaranteed qual-ity of service (QoS) for traditional data applications [1–3]. However, for real-time applications such as for telecom-munications, QoS demands are important in the networks and need to be given adequate representation [2, 4–6].
*Correspondence: [email protected]; [email protected]. 1Department of Communication Technology and Network, Universiti Putra Malaysia, 43400 UPM, Serdang, Selangor D.E., Malaysia
2Computational Science and Mathematical Physics Lab., Institute of Mathematical Research (INSPEM), Universiti Putra Malaysia, 43400 UPM Seri Serdang, Selangor D.E., Malaysia
Other challenges for the enhancement of QoS delivery in the telecommunication networks have been problems related to unfairness; the differentiated services (DiffServ) network is one of the networks affected by this problem.
The rapid growth in network communication systems has led to an increase in the cost of communication services, as well as the inability to control available band-width and maximum utilization of the network’s capacity. Therefore, application services have been proposed to provide higher QoS solutions to support the backbone infrastructure in wired and wireless networks. DiffServ has the most important feature, which is a mechanism to optimize the available bandwidth through efficient management of the current corporate network resources order to support end-to-end QoS. For example, a com-bination using Reverse Beacon Networks (RBNs) [7–10] could provide convertible wired roadside network solu-tions for vehicle-to-vehicle (V2V) or vehicle-to-roadside (V2R). Using the existing wired infrastructure in cities, it could also be used to display safety messages in the
traffic network to overcome several of traffic congestion problems or avoid accidents.
Morever, the traffic classification, presented in this work, can be extended by several research areas such as security policies [11, 12], cloud computing services [13] and sensor networks [14, 15].
The Internet Engineering Task Force (IETF) defined two network architecture approaches to meet the QoS requirements for applications communicating in data net-works, the integrated service (IntServ) [16] and DiffServ [17, 18] networks. The IntServ network’s main goal is a guaranteed QoS on the individual connection; but in the DiffServ approach, the QoS is guaranteed at the individual router [1, 2, 19, 20]. In addition, the IETF provided a per-hop behaviour (PHB) mechanism for service classes to optimize QoS in the DiffServ network [21, 22]. The first of these classes was the expedited forwarding (EF), in which the queue of the EF class maintained delay sensitivity for real time traffic flows. The second class, the assured for-warding (AF), was intended to provide a scale of reliable traffic flows [2, 23–25].
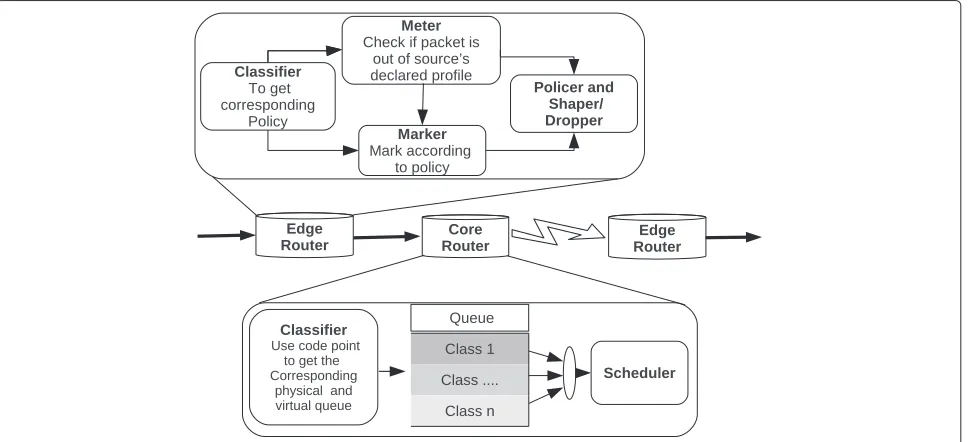
The DiffServ architecture has two main routers, namely the core and the edge routers. Figure 1 shows flows in the edge router that is classified as meter or marked traf-fic, which are placed into various levels of priority, as well as traffic shaping and dropping in the forwarding classes. The core router processes traffic on the basis of their service class, which depends on the marker and queu-ing algorithm [26, 27]. The traffic is marked with three different levels of agreement or colours such as red, yel-low or green. The higher level gives a higher or equal probability than the lower level [21, 22, 26], such as in
the time sliding window Three Colour Marker (tswTCM). This mechanism is performed at the core router by means of a queuing algorithm, such as weighted round robin (WRR), weighted fair queuing (WFQ), weighted ran-dom early detection (WRED) and ranran-dom early detection (RED), with an input and output queue (RIO) [26, 27]. Together with the unfairness problem of sharing band-width among flow aggregates, there are several causes for the locking of QoS in the DiffServ network [28–30]. Therefore, more marker algorithms have been designed to find the optimal solution for fair sharing of the TCP flow aggregates.
However, the marker algorithms were not designed to investigate the unfairness problem or responsive and non-responsive fairness in the aggregate and their causes [28]. This article proposes a new efficient marker algorithm to find the optimal solution for the unfairness of sharing bandwidth, responsive and non-responsive fairness, and studies the performance measurement for the causes of the number of TCP flows. The contribution of the pro-posed marker algorithm is that it extends the guarantee of the service rate to inject more green and yellow traf-fic into the fair sharing of bandwidth among aggregates, including taking into consideration the responsive and non-responsiveness of the aggregate. This is achieved by means of a new definition of the value of the constant (C) and the value ofγ, as used in Improved time sliding win-dow Three Colour Marker (ItswTCM), Double Improved time sliding window Three Colour Marker (I2tswTCM) and Double Modified Double Improved time sliding win-dow Three Colour Marker (M2I2tswTCM). Additionally, a traffic marking probability equation was developed using
the traffic average rate classification of the proposed algo-rithm which was approximated through a rate estimator.
Section 2 of the article gives an overview of work con-cerning the analysis of the mechanisms of marker algo-rithms and marking probability. The proposed marker algorithm and marking probability model is described in Section 3. Section 4 discusses design issues of simulation and the effect of the main parameter settings used in the simulation. Section 5 presents the numerical results, and the conclusions of the research on fairness of the marker algorithm techniques are presented in Section 6.
2 Related work
The QoS architecture in Diffserv depended on traffic marking that allows traffic to be prioritized through times of congestion to manage V2V or V2R for large num-bers of source flows. This has resulted in high priority traffic being satisfied more than low priority traffic. The classification in the network was dividing traffic into three components, that is policy, edge router and core router, to provide good QoS [17, 18, 31]. This section provides a review of algorithms based on traffic markers, as well as a description of the marker algorithms and their analysed mechanisms.
2.1 Marker algorithms of traffic probability
The time sliding window Three Colour Marker (tswTCM) was originally proposed to take advantage of the time sliding window (TSW) [32] and to mark traffic of an IP traffic stream as red, yellow and green. It used an average rate to estimate the bandwidth over a sliding window and depended on a comparison of the average rate of traffic with two parameters, namely the committed information rate (CIR) and the peak information rate (PIR), through marking them as red, yellow and green.
In [33], an Improved time sliding window Three Colour Marker (ItswTCM) algorithm was proposed for the treat-ment of unfair sharing of bandwidth aggregates, with the main idea being to inject more yellow traffic in proportion to the CIR. This worked on the basis that a large service subscriber would have more yellow traffic markers than a small service subscriber. The marking of traffic through the classification of red, yellow and green in the ItswTCM was dependent on a comparison of the average_rate with parameters of the CIR and a constant value ofC, with the condition thatCwas greater than one. The main variation between ItswTCM and tswTCM was when average_rate was greater than the CIR and when a constant value C
was used forCand cases were marked green, which was different from tswTCM.
In [34], the authors presented the Double Improved time sliding window Three Colour Marker (I2tswTCM) algorithm where the main idea was to find a new method of calculating theCvalue obtained in Eq. (1) as
C = (Bandwidth Link Capacityn )
The algorithm was focused on a comparison of two parameters, namely the CIR and the constant value C, with the average_rate. TheCvalue allowed marking more yellow traffic in the aggregates. This meant that the I2tswTCM algorithm would change the portion marker for the C value without impacting the concept of the ItswTCM algorithm and where theCvalue was defined by the equation instead of being a constant value as in ItswTCM.
In [2], the Double Modified Double Improved time sliding window Three Colour Marker (M2I2tswTCM) ensured additional injected yellow traffic through a new definition for the adaptive factor γ. It ensured that the additional yellow traffic was injected in proportion to the CIR by using the adaptive new factorγ that is not con-stant, as in the I2tswTCM marker algorithm. The value ofγ would modify the marking probability to allow the aggregate to inject more traffic as yellow, thus enhanc-ing the aggregate efficiency to achieve a proportional fair share of the excess bandwidth. The use of logarithms for the summation of the PIR (SPIR) with a link capacityX
in the adaptive factorγ would provide large subscribers with the ability to inject more traffic as yellow than small subscribers. The value ofγ is shown in Eq. (3) [2].
γ = log(1/(SPIR+X)) (3)
The M2I2tswTCM marker algorithm used the logarithm for the summation of the PIR and the bottleneck band-width in Eq. (3) to extend the portion limit of the constant valueCto help the aggregates inject more yellow traffic into the network.
2.2 Classifying traffic probability
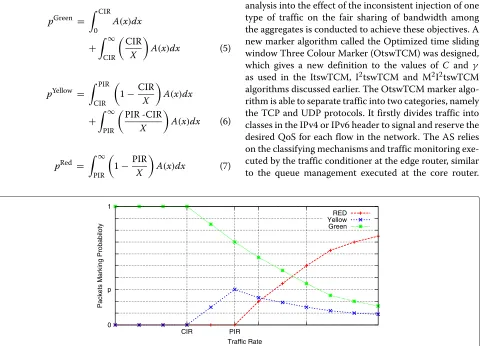
in Fig. 2. In the first part, all traffic were marked green when the traffic average rate was less than the CIR. In the second part, when average rate was greater than the CIR, traffic were marked red, yellow and green according to the classifying traffic probability given by the marker algorithm.
In the tswTCM algorithm, traffic marking probabil-ity was divided according to two components: the first component was a probability density function (PDF), an estimator average rate, while the second component was determined by the marker traffic based on the rate calcu-lated by the PDF [32]. Equation (4) describes the estimated average arrival rate according to the tswTCM algorithm where the traffic classified probability as red, yellow and green. Equation (5) was used for the green probability traf-fic while Eq. (6) was used for the yellow traftraf-fic and Eq. (7) for the red traffic [35]:
Ak =
A(k−1)W+S W+Tk
(4)
whereSis packet size,Wis window size andTkis the time between the currentkth and the previous(k−1)th traffic arrivals. and a gamma function(.)is used instead of a factorial sincenand the value of(.)function are not necessarily integer values [35].
3 Proposed classifying probability and marker
algorithm
3.1 Problem and description
Traffic in the same bottleneck link is not only influenced at the edge router by the marking algorithm but also by the sharing of flows. Therefore, the main objectives of this article are (i) to find an optimization treatment for the unfairness problem; (ii) to find a traffic marking probabil-ity equation by using the distribution of the time sliding window traffic average rate approximated through the estimator rate; and (iii) to provide an enhanced fairness bandwidth between aggregates using the TCP protocol and also between TCP and UDP protocol aggregates. An analysis into the effect of the inconsistent injection of one type of traffic on the fair sharing of bandwidth among the aggregates is conducted to achieve these objectives. A new marker algorithm called the Optimized time sliding window Three Colour Marker (OtswTCM) was designed, which gives a new definition to the values of C andγ as used in the ItswTCM, I2tswTCM and M2I2tswTCM algorithms discussed earlier. The OtswTCM marker algo-rithm is able to separate traffic into two categories, namely the TCP and UDP protocols. It firstly divides traffic into classes in the IPv4 or IPv6 header to signal and reserve the desired QoS for each flow in the network. The AS relies on the classifying mechanisms and traffic monitoring exe-cuted by the traffic conditioner at the edge router, similar to the queue management executed at the core router.
0
The OtswTCM also ensures that the aggregate traffic that is generated complies with the traffic profiles specified between the flow and the network.
3.2 Proposed OtswTCM model
The OtswTCM model studied five different impact fac-tors on offering expected bandwidth assurance services, namely the number of flows in an aggregate, the target rate, the TCP/UDP interaction, the CIR and the PIR.
In the TCP protocol, the main advantage of the algo-rithm was that it was expected to inject a greater amount of traffic coloured proportionally, which preserved the DiffServ network in the QoS mode. The OtswTCM algo-rithm consisted of three tasks. When the traffic had an average_rate of less than the CIR, the OtswTCM algo-rithm would mark the traffic green to guarantee the ser-vice rate. In the second portion, when the average_rate was between the CIR and (C×CIR), the traffic was clas-sified green with a probability of(γaverage_rate×C×CIR) or yellow with a probability of (1 − P1). Finally, when the aver-age_rate was greater than (C × CIR), the traffic were
classified red with a probability P2 = average_rateC×CIR 2 or classified yellow with a probability of (1 − P2). It was this mechanism that made it more efficient than the other algorithms.
In truth, however, a higher drop in priority level is expe-rienced when mapping UDP flows and TCP flows of the same AF class. This issue is tackled in the OtswTCM because of the design of OtswTCM in which the difference between TCP and UDP is taken into account.
The UDP protocol was similar to the TCP protocol in that the first portion for traffic arriving using the OtswTCM algorithm would be marked green when the average_rate was less than the CIR. If the average_rate was between the CIR and (C×CIR), the traffic would be marked yellow. Finally, when the average_rate was greater than the C × CIR, the traffic would be classified red with a probability(γaverage_rate×C×CIR) or classified yellow with a probability(1−P3). These portions are summarized in Algorithm 1.
3.3 Algorithm analysis
Previous marker algorithms for classifying the service of TCP traffic does not have enough consideration of the effect of UDP traffic and the average target rate of flows. The OtswTCM was proposed to improve the fairness index of TCP flows based on the average transmit rate and the dynamic classifying policy that allocates bandwidth in proportion to transmission rates of flows.
This article proposed an equation to determine the clas-sifying probability of the OtswTCM algorithm for study-ing the behaviour of TCP flows and aggregates subject to AF PHB. The classifying probability of the OtswTCM
Algorithm 1OtswTCM
average_rate←Estimated rate.
X←Link Capacity.
SCIR← For probability P1 marker is green For probability (1 - P1) marker is yellow else
P2 =(C×CIR)/average_rate2
For probability P2 marker is red
For probability (1−P2) marker is yellow end if For probability P3 marker is green For probability (1−P3) marker is red end if
end if
algorithm depended on three parameters that determined the status information of the TCP flows, namely the CIR,
C and γ. The parameter C was defined by (bandwidth
link capacity / N
i=0
CIRi). In the ItswTCM algorithm, C
was defined as a constant value and in the I2tswTCM algorithm, it was redefined by Eq. (2). The parame-ter γ was defined in the M2I2tswTCM algorithm by Eq. (3).
The OtswTCM was presented in Algorithm 1. The traf-fic was marked green at two parts, if the estimated rate was less than CIR and between the CIR and (C× CIR) with a probability of
(γ×C×CIR)
marked green in Eq. (9), yellow in Eq. (10) or red in Eq. (11) as follows:
PGreen =
CIR
0
A(x)dx
+
C×IR
CIR
γ ×
C×CIR
x
A(x)dx (9)
PYellow =
C×CIR
CIR 1−
γ ×
C×CIR
x
2
A(x)dx
+
∞
C×CIR 1−
C×CIR
x
2
A(x)dx (10)
PRed =
∞
C×CIR
C×CIR
x
2
A(x)dx (11)
The parameter A(x) for the pGreen, pYellow and pRed is stated in Eq. (8).
4 Performance evaluation and simulation setup
This section describes the simulation topology and per-formance criteria employed to analyse the fairness of the OtswTCM algorithm developed in the previous section. The proposed marker algorithm was evaluated using the
NS2 simulator [36].
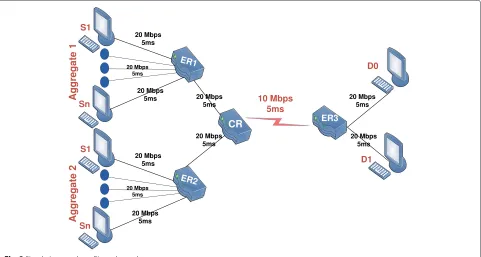
In this study, the simulation topology used is depicted in Fig. 3. The network accepted input sources from aggre-gates 1 and 2. In fact, the DiffServ network was divided between two routers, namely the core router (CR) and the
edge router (ER). Aggregate 1 sent traffic through ER1 to destination D0, while aggregate 2 sent traffic through ER2 to destination D1. In the simulation network topol-ogy, three routers (ER1, ER2 and ER3) were attached to the CR. Aggregates 1 and 2 contained a number of flows from different source nodes. ER1 and ER2 were respon-sible for monitoring and marking traffic for aggregates 1 and 2, respectively. The CR router used active queue management and provided a service comparison between aggregates for ER1 and ER2.
The MRED queue management algorithm scheme was used in all the simulations. Table 1 shows the MRED queue configuration parameters, the notation (minth, maxth, maxp) used to represent the minimum threshold, maximum threshold and weight parameter. The parame-ters of the red, yellow and green virtual queues were (0, 40, 0.2), (40, 80, 0.10) and (80, 120, 0.02), respectively, and were specified in the simulation files of DiffServ inNS2 [27, 37].
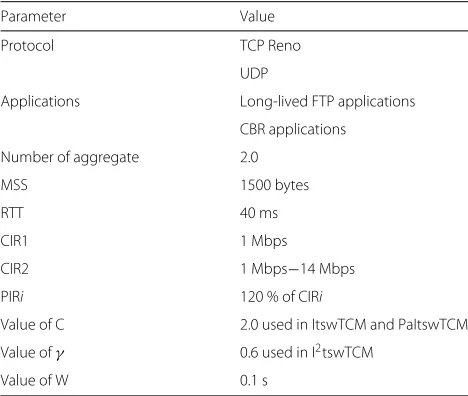
The simulation parameters are shown in Table 2 where the FTP/TCP Reno and CBR/UDP are used. The TCP aggregates or TCP and UDP aggregates fed into a con-gestedCRrouter with a service differentiation ability, for all TCP and UDP flows running as long-lived FTP appli-cations, with a round trip time (RTT) of 40 ms and a MSS of 1500 bytes. All TCP and UDP flow start times were consolidated and distributed. UDP connections were used in Experiment 2 and UDP flows were used in CBR traffic with a sending rate that was set at 1.5 Mbps and a packet size of 512 bytes. ThePIRfor all marker algorithms was
Table 1MRED queue configuration parameters
Traffic Red Yellow Green
Minimum threshold 0 40 80
Maximum threshold 40 80 120
Minimum probability 0.20 0.10 0.02
set to 1.2 CIR. Simulation parameters were similar to that used in [2, 33, 34].
The simulation used representative or
non-representative aggregate protocols to evaluate the TCP performance, namely TCP and UDP protocols. However, experiment 1 only used the TCP protocols while Experi-ment 2 used TCP and UDP protocols for two aggregates to evaluate and compare their efficiency in the DiffServ network. The DiffServ dictated that each aggregate was allocated a considerable amount of arrival traffic at any time interval. This study used the standard Fairness Index (FI) rate to evaluate the performance between flow bandwidth aggregates. This meant that it related to the ratio among the flow bandwidth of aggregates that was successfully received at the destination. The simulation target was the utilization of equal share fairness rather than weighted fairness to measure the fairness of the simulation marker algorithms and compare them with the OtswTCM marker algorithm. The Fairness Index formula in [38] was used, as defined in Eq. (12).
FI =
N
i=1Xi
2
N×Ni=1Xi2 (12)
where, 0<FI<1,Xi = Excess bandwidth obtained by aggregateCIR of aggregate i i andN=number of aggregates.
Table 2Parameters of the analytical and simulation
Parameter Value
Protocol TCP Reno
UDP
Applications Long-lived FTP applications
CBR applications
Number of aggregate 2.0
MSS 1500 bytes
RTT 40 ms
CIR1 1 Mbps
CIR2 1 Mbps−14 Mbps
PIRi 120 % of CIRi
Value of C 2.0 used in ItswTCM and PaItswTCM
Value ofγ 0.6 used in I2tswTCM
Value of W 0.1 s
5 Results and discussion
This section presents and analyses the results from this study using a sophisticated version of the tswTCM algorithm. In the proposed algorithm, traffic types are assumed to be proportionally injected into the network by the marker algorithm that allocated the bandwidth fairly. The analysis also showed the fairness behaviour of the proposed marker algorithm to be between the simulation and analytical marking probability. The simulation results verified that the fairness behaviour of the new marker algorithm was related with the other algorithms, such as the ItswTCM [33], I2tswTCM [34], MI2tswTCM [39], M2I2tswTCM [2], PaItswTCM [40] and PAPTCM [29] by verifying the CIR for the aggregate. In aggregate 1, the CIR was a constant value at 1 Mbps but the value increased from 1 to 14 Mbps in aggregate 2. Thus, it was possible to determine the network provision level in all experiments and scenarios by describing the ratio summation of the provisioned bandwidth with the bandwidth of the bottle-neck link, making the range network provision level to be between 20 and 150 %.
5.1 Analytical model of marking probability
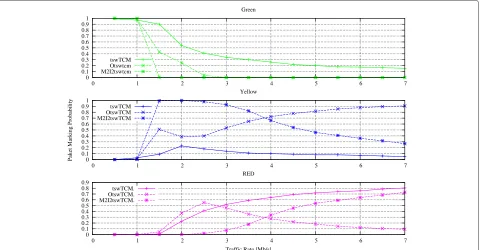
In the analytical model, three results of the traffic marker probability (green, yellow, red) in Fig. 4 were conducted using various amounts of marking probabil-ity offered by the AF bandwidth in the core router for the tswTCM, M2I2tswTCM and OtswTCM algorithms. Figure 4 represents the results of the measurements in green, yellow and red probability traffic, respectively, that the description of excess bandwidth sharing and the total bandwidth sharing were specific for three colours. The total amount of marking probability was always between 0 and 1. If the probability traffic was perfectly achieved, the colour would have a good balance and total amounts would equal to 1. Three results of the traffic marker probability in Fig. 5 are supported by simula-tion. Figures 4 and 5 show the colour area of the prob-ability of the committed rate and excess rate for each algorithm.
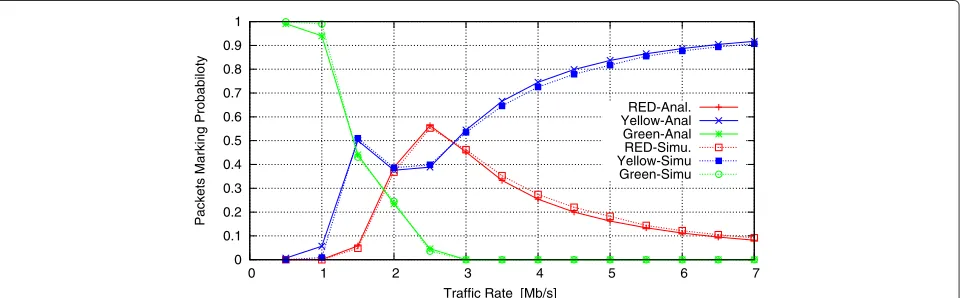
Figure 6 shows a comparison between the analytical model and the simulation results for the marking proba-bility of the tswTCM algorithm. It presents the marking probability for traffic type when the average arrival traf-fic rate was less than the CIR and the traftraf-fic was marked green, and when the average arrival traffic rate was greater than the CIR. Otherwise, traffic was marked green, yellow or red according to the determined probability.
0
Fig. 4Analytical marking probability. Represents the analytical results of the measurements in green, yellow and red probability traffic for the tswTCM, M2I2tswTCM and OtswTCM algorithms
greater than the CIR, the marker algorithm classified and marked the traffic as red, yellow or green according to the probability marking of the aggregates. The basic idea to avoid problems using this algorithm was to extend the area limit to allow both aggregates to inject more yellow
traffic into the network. The most accurate description was that the aggregate small service subscribers would inject yellow traffic more than the aggregate large service subscribers, and this is discussed further in the following section.
0 0.1 0.2 0.3 0.4 0.5 0.6 0.7 0.8 0.9 1
0 1 2 3 4 5 6 7
Packets Marking Probabiloty
Traffic Rate [Mb/s]
RED-Anal. Yellow-Anal Green-Anal RED-Simu. Yellow-Simu Green-Simu
Fig. 6tswTCM marking probability. Comparison between the analytical model and the simulation results for the tswTCM probability
5.2 The simulation experiment
The first experiment with homogeneous traffic aggregates verified the performance of fairness behaviour for the algorithms among TCP aggregates. The second experi-ment with heterogeneous traffic aggregates, on the other hand, verified the performance of fairness behaviour for the algorithms among TCP and UDP aggregates.
5.2.1 Experiment 1: homogeneous traffic aggregates
In experiment 1 with only TCP traffic, the proposed marker algorithm studied the performance of fairness behaviour for the different marker algorithms for three different scenarios.
Scenario 1: Both aggregates had the same number of flows (16 flows). This scenario explained the concept of competing for excess bandwidth with an equal number of flows, among larger service subscribers as that used in aggregate 2 compared with a small service subscriber as that used in aggregate 1.
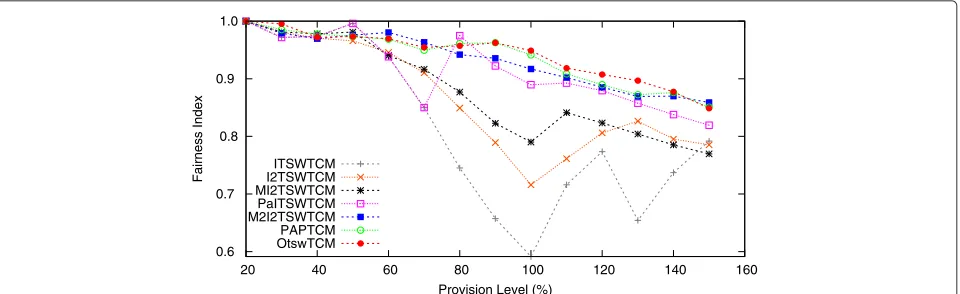
The results of the performance of fairness behaviour versus provision levels of the proposed algorithms are clarified in Fig. 8. The performance was better when
compared with other marker algorithms, especially in long-range network provisions of above 90 %. However, the performance of the PAPItswTCM was better than the PaItswTCM and M2I2tswTCM above the 70 % for net-work provision, while the OtswTCM performed better than the M2I2tswTCM at a network provision of between 80 and 140 %. The M2I2tswTCM performed better than the PaItswTCM at a network provision of between 60 and 70 % and between 90 and 150 %. The reason for the per-formance results was that the smallest service subscriber achieved a higher bandwidth than a larger service sub-scriber, by injecting more green and yellow traffic in the excess bandwidth among aggregates, this being identical to the fact that the TCP congestion control algorithms preferred small flows [32]. In addition, the characteris-tics of the proposed traffic marker algorithm probabilities depended on the CIR, PIR and the values of γ and the value of C. This indicated that the proposed OtswTCM algorithm was optimum for the provision level, to operate with an optimum fairness index close to the value of one.
Scenario 2: The aggregates had different numbers of flow. Scenario 2 explained the concept of competition
0 0.1 0.2 0.3 0.4 0.5 0.6 0.7 0.8 0.9 1
0 1 2 3 4 5 6 7
Packets Marking Probabiloty
Traffic Rate [Mb/s]
RED-Anal. Yellow-Anal Green-Anal RED-Simu. Yellow-Simu Green-Simu
0.6 0.7 0.8 0.9
1.0
20 40 60 80 100 120 140 160
Fairness Index
Provision Level (%) ITSWTCM
I2TSWTCM MI2TSWTCM PaITSWTCM M2I2TSWTCM PAPTCM OtswTCM
Fig. 8Scenario 1: The number of flow is equal 16. Performance of fairness behaviour when compared OtswTCM with other algorithms, the number of TCP flow is equal 16 at each aggregate
for the excess bandwidth among small service subscribers used in aggregate 1 with 16 flows compared with the larger service subscriber used in aggregate 2 with 32 flows.
Figure 9 illustrates the fairness index versus the range network provision levels where aggregates 1 and 2 share the excess bandwidth in terms of the number of flows. The performance evaluation of the proposed algorithm and the marker algorithms confirmed the preference of the OtswTCM algorithm over the other algorithms. The fairness index was optimum for provision levels in the proposed OtswTCM algorithm as it was almost one. As the OtswTCM algorithm injected extra green and yel-low traffic into the network, the larger subscriber injected sufficient red traffic and the small subscriber invested in increasing the flow. In Fig. 9, the curve of proposed algorithm also shows higher true fairness than ItswTCM, I2tswTCM and M2I2tswTCM. Moreover, no matter how many numbers of flows when homogeneous traffic aggre-gates are available, so that the proposed algorithm effec-tively deals with traffic management for aggregate flows than other alternative algorithms.
Scenario 3: The aggregates in this scenario also had different numbers of flows and the same concept as in Sce-nario 2 (The number of flow is different), and the small service subscriber had 16 flows and the larger service subscriber had 32 flows.
Figure 10 interprets the sharing of the bottleneck link among aggregate 2 (with fewer flows) and aggregate 1 (with a larger number of flows). The figure also showed a large subscriber profit from the increasing flows, which was because the larger subscriber in the OtswTCM algo-rithm injected extra green and yellow traffic into the network but was able to drop more traffic. Likely, as high-lighted in Fig. 9, it is clear that in Fig. 10, the OtswTCM was not sensitive to the number of flows, while other algorithms are affected such as ItswTCM, I2tswTCM and M2I2tswTCM.
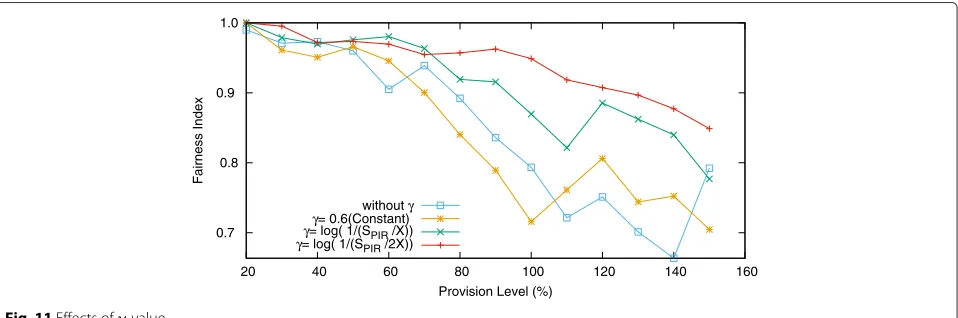
In order to expand the comparative evaluation, we com-pare the effect the different values of γ in OtswTCM. Figure 11 reveals that the fairness pattern was similar with different value of γ. However, OtswTCM achieves superior fairness by setting γ = log(1/(SPIR/2X)). The
0.6 0.7 0.8 0.9
1.0
20 40 60 80 100 120 140 160
Fairness Index
Provision Level (%) ITSWTCM
I2TSWTCM MI2TSWTCM PaITSWTCM M2I2TSWTCM PAPTCM OTSWTCM
0.6 0.7 0.8 0.9
20 40 60 80 100 120 140 160
Fairness Index
Provision Level (%) ITSWTCM
I2TSWTCM MI2TSWTCM PaITSWTCM M2I2TSWTCM PAPTCM OTSWTCM
Fig. 10Scenario 3: The number of flow is different. Performance of fairness behaviour when compared OtswTCM with other algorithms, the number of TCP flow is 32 at aggregate 1 and 16 at aggregate 2
performance of the examined algorithms was equiva-lent for the provision level between 20 and 70 %. How-ever, for the provision level between 80 up to 150 %, both M2I2tswTCM and OtswTCM show better fairness enhancement over other approaches due to the exploit of dynamicγ. More particularly, OtswTCM shows superior fairness. The reason behind that is the integration of a new parameter, namelyP1 in which dynamicγ was utilized to allow more packets to be injected to the network.
The bottleneck link is shared among aggregates in the network using different flows. This bottleneck is signif-icantly affected by number of parameters, namely CIR, PIR,Candγ for traffic sent. These parameters are used in the calculation of the probability of traffic classifica-tion. The ItswTCM organizes the traffic classification with the constantC value, i.e. it only supports homogeneous traffic. The I2tswTCM does not consider the heterogene-ity of the traffic types. Yet, it introduces a constant γ value to dynamically calculateC. M2I2tswTCM algorithm uses the dynamic γ to inject only yellow traffic. How-ever, neither homogeneous nor heterogeneous traffics are considered. On the other hand, the OtswTCM algorithm
efficiently organizes the probability traffic classification using a number of parameters, CIR, PIR,Candγ. Thus, the use of the value ofγ is redefined in this study and a new design of the OtswTCM in order to inject green and yellow traffics which efficiently optimizes the fairness. Hence, the homogeneous and heterogeneous traffics are considered.
The main reason for the different fairness index results for all scenarios in experiment 1, in a performance between the proposed OtswTCM algorithm with other marker algorithms, was that almost all the traffic from both aggregates had more traffic marked as green and yel-low at each of the provision level load. This was because of the limited area of arrival rates for green and yellow traffic, which allowed the injection of more green and yel-low traffic. It also showed the adaptability of the proposed OtswTCM marker algorithm with the change in traffic load, because the TCP aggregates were able to achieve a proportional fair share of the excess bandwidth. The simulation result also showed that the proposed marker algorithm was not affected by a change in the number of flows between homogeneous TCP traffic aggregates.
0.7 0.8 0.9 1.0
20 40 60 80 100 120 140 160
Fairness Index
Provision Level (%) withoutγ
γ= 0.6(Constant)
γ= log( 1/(SPIR /X))
γ= log( 1/(SPIR /2X))
0.6 0.7 0.8 0.9
1.0
20 40 60 80 100 120 140 160
Fairness Index
Provision Level (%)
ITSWTCM I2TSWTCM MI2TSWTCM PaITSWTCM M2I2TSWTCM PAPTCM OTSWTCM
Fig. 12Scenario 1: The number of flow is equal 16 (TCP and UDP aggregates)
5.2.2 Experiment 2: heterogeneous traffic aggregates
The three different scenarios for experiment 2 with het-erogeneous traffic aggregates was set to study the perfor-mance of behaviour fairness index for different marker algorithms.
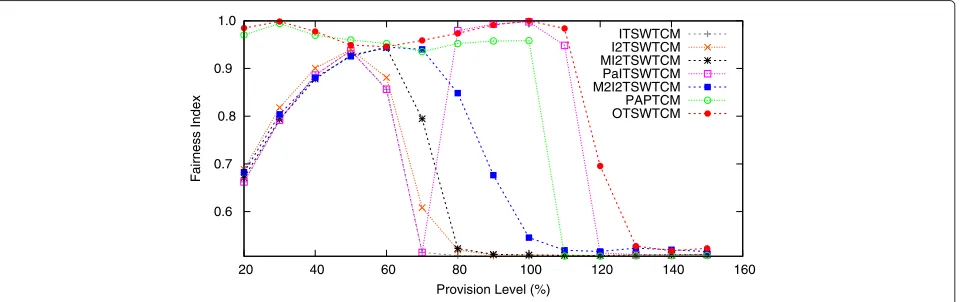
Scenario 1: The number of flows was equal to 16 as TCP flows using a small subscriber in aggregate 1 and UDP flows in aggregate 2 as a larger subscriber, which clearly showed the behaviour fairness index in the TCP and UDP flows as in Fig. 12. The results in the figure showed a high degree of unfairness when UDP flows were injected into the network. The reason was that the design of several marker algorithms did not take into account the presence of UDP flows. In this figure, the performance results of the proposal marker algorithm were better when compared to other marker algorithms, especially for the long-range network provisions between 30 and 40 % and between 90 and 130 %. However, the performance results of PaItswTCM were better than the OtswTCM and PAPItswTCM algorithms in the range of the provision level between 80 and 90 %. The OtswTCM, PAPTCM and PaItswTCM algorithms attempted to allocate tokens in
proportion to the incoming rate and showed greater fair-ness than the other algorithms. In general, the OtswTCM algorithm allocated approximately the same number of tokens to all UDP flows irrespective of their bandwidth.
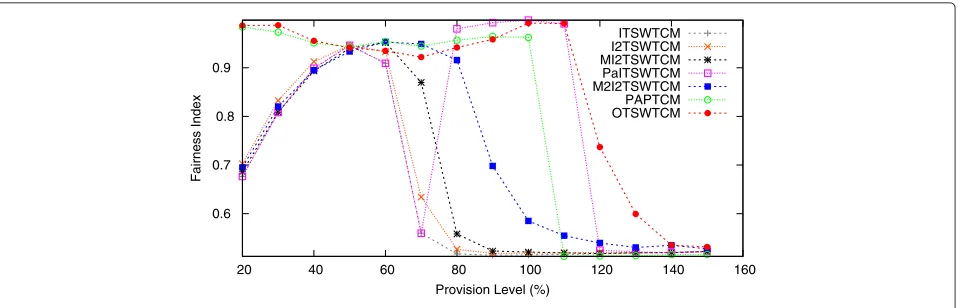
Scenario 2: Aggregates 1 and 2 had different flows which comprised 16 TCP flows using a small subscriber in aggregate 1 and 32 UDP flows in aggregate 2 using a large subscriber. Figure 13 plots the fairness index versus network provision levels, for which the results of the pro-posed marker algorithm were optimum for all provision levels, especially between 20 and 40 %, but also between 60 and 80 %, and between 90 and 130 %. However, the PAPTCM and PaItswTCM results were better than the M2I2tswTCM and MI2tswTCM algorithms for the pro-vision level between 80 and 110 %. The PAPTCM was better than all other algorithms between 50 and 60 % pro-vision level, and the PaItswTCM was better than the other algorithms at the 80 % provision level. The edge router in the OtswTCM was not more effective for the different flows between TCP flows for the small subscriber, while UDP flows for the large subscriber were also not effec-tive for the UDP traffic, as the design of the proposed
0.6 0.7 0.8 0.9
1.0
20 40 60 80 100 120 140 160
Fairness Index
Provision Level (%)
ITSWTCM I2TSWTCM MI2TSWTCM PaITSWTCM M2I2TSWTCM PAPTCM OTSWTCM
0.6 0.7 0.8 0.9
20 40 60 80 100 120 140 160
Fairness Index
Provision Level (%)
ITSWTCM I2TSWTCM MI2TSWTCM PaITSWTCM M2I2TSWTCM PAPTCM OTSWTCM
Fig. 14Scenario 3: The number of flow is different (32 TCP and 16 UDP aggregates)
marker algorithm had a special branch to deal with UDP traffic.
Scenario 3: Aggregates 1 and 2 had different flows com-prising 32 TCP flows using a small subscriber in aggregate 1 and 16 UDP flows using a larger subscriber in aggre-gate 2. The previous scenario using the bandwidth fairness index of the TCP and UDP flows is explained in Fig. 14, which showed the bandwidth fairness obtained by the different numbers of UDP flows. The proposed marker algorithm results were optimum for a provision level of between 20 and 40 %, and also between 110 and 150 %, but the PAPTCM results were optimum at between 80 and 110 %. However, the OtswTCM results for between 50 and 80 % were not better than the PAPTCM and M2I2tswTCM algorithms because the larger subscriber in OtswTCM injected extra traffic into the network but was able to drop more traffic.
The main reason for the scenarios in experiment 2 was to test a special branch to deal with UDP traffic in the design of the proposed marker algorithm, such that most traffic from both aggregates were largely marked as green and yellow at each provision level load. This obvi-ously showed the adaptability of the proposed OtswTCM marker algorithm with a change in traffic type. The simu-lation result showed that the proposed marker algorithm was not affected by a change in the number of flows between heterogeneous traffic aggregates.
Based on the results obtained, the simulation scenarios showed that the OtswTCM could achieve better fairness trade-off through guaranteeing a basic fairness level for satisfying the minimum application throughput demand in aggregates and increasing the resource share of the other aggregates to improve fairness in the excess band-width among different aggregates.
6 Conclusions
The goals of this article were to introduce an optimized treatment for the unfairness problem using time sliding
window Three Colour Marker, to find a traffic marking probability equation using distribution of the time slid-ing window traffic average rate approximated through the estimator rate and to provide an enhanced fairness band-width between aggregates using the TCP protocol and between TCP and UDP protocols aggregated. The goals were achieved by including the concept of separation of traffic protocols and an extended area limit to accept more traffic as green and yellow to inject into the network. The simulation results showed that the behaviour of the proposed marker algorithm demonstrated better fairness than the other marker algorithms for network provision levels between 40 and 150 % for TCP traffic aggregates. In addition, it also provided fairness for network provision levels between 20 and 130 % among TCP and UDP traffic aggregates. Finally, the proposed algorithm was affected not only by the number of flows but also among TCP and UDP traffic aggregates.
Competing interests
The authors declare that they have no competing interests.
Acknowledgements
This work was supported by the Fundamental Research Grant Scheme (FRGS Number: /FRGS/1/2014/ICT03/UPM/01/0), Malaysian Ministry of Education.
Received: 22 December 2015 Accepted: 24 February 2016
References
1. H Su, M Atiquzzaman, Comprehensive performance model of differentiated service with token bucket marker. IEE Proceedings -Communications.150(5), 347–53- (2003). doi:10.1049/ip-com:20030588 2. AM Alkharasani, M Othman, M2I2tswTCM: a new efficient optimization
marker algorithm to improve fairness bandwidth in DiffServ networks. J. Netw. Comput. Appl.35(4), 1361–1366 (2012)
3. P Li, S Guo, S Yu, AV Vasilakos, inINFOCOM, 2012 Proceedings IEEE. CodePipe: An opportunistic feeding and routing protocol for reliable multicast with pipelined network coding, (2012), pp. 100–108. doi:10.1109/INFCOM.2012.6195456
4. D Satoh, H Ueno, Marking algorithm of distinguishing three traffic load states with two encoding states for pre-congestion notification. Comput. Commun.36(10), 1209–1224 (2013)
6. J Zhang, C Chen, Y Xiang, W Zhou, AV Vasilakos, An effective network traffic classification method with unknown flow detection. Netw. Serv. Manag. IEEE Trans.10(2), 133–147 (2013)
7. S Adibi, Advances in wireless technologies and telecommunication. Information Science Reference (2010). https://books.google.com.my/ books?id=YUyswy1Q19kC. Accessed 24 Feb 2016
8. Y Chen, M Xu, Y Gu, P Li, L Shi, X Xiao, Empirical study on spatial and temporal features for vehicular wireless communications. EURASIP J. Wireless Commun. Netw.2014(1), 1–12 (2014)
9. X Wang, AV Vasilakos, M Chen, Y Liu, TT Kwon, A survey of green mobile networks: opportunities and challenges. Mobile Netw. Appl.17(1), 4–20 (2012)
10. Y Zeng, K Xiang, D Li, AV Vasilakos, Directional routing and scheduling for green vehicular delay tolerant networks. Wireless Netw.19(2), 161–173 (2013)
11. J Liu, Y Li, H Wang, D Jin, L Su, L Zeng, T Vasilakos, Leveraging
software-defined networking for security policy enforcement. Inform. Sci. 327, 288–299 (2016)
12. ZM Fadlullah, T Taleb, AV Vasilakos, M Guizani, N Kato, DTRAB: combating against attacks on encrypted protocols through traffic-feature analysis. IEEE/ACM Trans. Netw. (TON).18(4), 1234–1247 (2010)
13. G Wei, AV Vasilakos, Y Zheng, N Xiong, A game-theoretic method of fair resource allocation for cloud computing services. J. Supercomput.54(2), 252–269 (2010)
14. L Liu, Y Song, H Zhang, H Ma, AV Vasilakos, Physarum optimization: a biology-inspired algorithm for the Steiner tree problem in networks. Comput. IEEE Trans.64(3), 818–831 (2015)
15. Y Song, L Liu, H Ma, AV Vasilakos, A biology-based algorithm to minimal exposure problem of wireless sensor networks. Netw. Serv. Manag. IEEE Trans.11(3), 417–430 (2014)
16. R Braden, D Clark, S Shenker, Integrated services in the Internet architecture: an overview, RFC 1633 (1994). doi:10.17487/RFC1633. http:// www.rfc-editor.org/info/rfc1633. Accessed 24 Feb 2016
17. S Blake, D Black, M Carlson, E Davies, Z Wang, W Weiss, An architecture for differentiated services, RFC 2475 (1998). doi:10.17487/RFC2475. http:// www.rfc-editor.org/info/rfc2475. Accessed 24 Feb 2016
18. K Nichols, s Blake, F Baker, D Black, Definition of the differentiated services field (DS Field) in the IPv4 and IPv6 headers, RFC 2474 (1998). doi:10.17487/ RFC2474. http://www.rfc-editor.org/info/rfc2474. Accessed 24 Feb 2016 19. M Loudini, S Rezig, Y Salhi, Incorporate intelligence into the differentiated
services strategies of a web server: an advanced feedback control approach. J. Internet Serv. Appl.4(1), 1–16 (2013)
20. C Busch, R Kannan, AV Vasilakos, Approximating congestion + dilation in networks via quality of routing&# x201d; games. Comput. IEEE Trans. 61(9), 1270–1283 (2012)
21. J Heinanen, F Baker, W Weiss, J Wroclawski, Assured forwarding PHB group, RFC 2597 (1999). doi:10.17487/RFC2597. http://www.rfc-editor. org/info/rfc2597. Accessed 24 Feb 2016
22. B Davie, A Charny, J Bennet, K Benson, J Le Boudec, W Courtney, S Davari, V Firoiu, D Stiliadis, An expedited forwarding PHB (per-hop behavior), RFC 3246 (2002). doi:10.17487/RFC3246. http://www.rfc-editor.org/info/ rfc3246. Accessed 24 Feb 2016
23. W-H Hsu, Y-P Shieh, DiffServ-aware multicasting in a mobile IPv6 network. Telecommun. Syst.54(4), 373–386 (2013)
24. A Varela, T Vazão, G Arroz, Providing service differentiation in pure IP-based networks. Comput. Commun.35(1), 33–46 (2012) 25. Y Liu, N Xiong, Y Zhao, AV Vasilakos, J Gao, Y Jia, Multi-layer clustering
routing algorithm for wireless vehicular sensor networks. IET Commun. 4(7), 810–816 (2010)
26. C Chrysostomou, A Pitsillides, YA Sekercioglu, Fuzzy explicit marking: A unified congestion controller for best-effort and Diff-Serv networks. Comput. Netw.53(5), 650–667 (2009)
27. DD Clark, W Fang, Explicit allocation of best-effort packet delivery service. Netw. IEEE/ACM Trans.6(4), 362–373 (1998)
28. S Sudha, N Ammasaigounden, An aggregate marker for bandwidth fairness in DiffServ. J. Netw. Comput. Appl.35(6), 1973–1978 (2012) 29. M Looney, O Gough, A provision aware proportional fair sharing three
colour marker. J. Netw. Comput. Appl.36(1), 476–483 (2013) 30. T Meng, F Wu, Z Yang, G Chen, A Vasilakos, Spatial reusability-aware
routing in multi-hop wireless networks. Comput. IEEE Trans.65(1), 244–255 (2015)
31. C Li, L Wang, Y He, C Zhao, H Lin, L Zhu, A link state aware geographic routing protocol for vehicular ad hoc networks. EURASIP J. Wireless Commun. Netw.2014(1), 1–13 (2014)
32. W Fang, N Seddigh, B Nandy, A time sliding window Three Colour Marker (TSWTCM), RFC 2859 (2000). doi:10.17487/RFC2859. http://www.rfc-editor.org/info/rfc2859. Accessed 24 Feb 2016
33. H Su, M Atiquzzaman, ItswTCM: a new aggregate marker to improve fairness in DiffServ. Comput. Commun.26(9), 1018–1027 (2003) 34. M Elshaikh, M Othman, S Shamala, JM Desa, A new fair marker algorithm
for DiffServ networks. Comput. Commun.31(14), 3064–3070 (2008) 35. R Stankiewicz, A Jajszczyk, Performance modeling of DiffServ
meter/markers. Int. J. Commun. Syst.23(12), 1554–1580 (2010) 36. K Fall, K Varadhan, The NS manual (formerly NS notes and
documentation). The VINT project.47(2005)
37. P Pieda, J Ethridge, M Baines, F Shallwani, A network simulator differentiated services implementation open IP, Nortel Networks (2000). https://www-sop.inria.fr/members/Eitan.Altman/COURS-NS/DOC/ DSnortel.pdf. Accessed 24 Feb 2016
38. PND Bukh, R Jain, The art of computer systems performance analysis, techniques for experimental design, measurement, simulation and modeling. (JSTOR, 1992)
39. S Sudha, BS Rao, N Ammasaigounden, inIndustrial and Information Systems, 2008. ICIIS 2008. IEEE Region 10 and the Third international Conference on. A modified I2TSWTCM to improve bandwidth fairness in
DiffServ, (2008), pp. 1–4. doi:10.1109/ICIINFS.2008.4798430
40. Y Sani, M Othman, A provision-aware fair bandwidth distribution marker algorithm for DiffServ networks. J. Netw. Comput. Appl.34(2), 715–721 (2011)
Submit your manuscript to a
journal and benefi t from:
7 Convenient online submission 7 Rigorous peer review
7 Immediate publication on acceptance 7 Open access: articles freely available online 7 High visibility within the fi eld
7 Retaining the copyright to your article