ISSN(Online): 2319-8753 ISSN (Print): 2347-6710
International Journal of Innovative Research in Science,
Engineering and Technology
(An ISO 3297: 2007 Certified Organization)
Website: www.ijirset.com
Vol. 6, Issue 6, June 2017
Discovering Crowdedness
Spot in city
Transportation Using Mobility Based
Clustering
Vaishali Yashwantrao Chandurkar 1, Prof. Y. B. Gurav 2
M. E Student, Department of Computer Engineering, P.V.P.I.T. Bavdhan, Pune, Maharashtra, India1 Professor, Department of Computer Engineering, P.V.P.I.T. Bavdhan, Pune, Maharashtra, India2
ABSTRACT: Traffic congestion is one of the major troubles in multiple transportation systems. Which can increasing demand for mobility in urban area has resulted in increased traffic congestion and a multiple of troubles associated with it. This paper presents the method of discovering crowded areas, which known as ‘Crowdedness spot’ in terms of road traffic and analyses the impact of these ‘Crowdedness spot’ on traffic. The Global Positioning System (GPS) data is used for this purpose, as GPS has become a reliable, accurate and economically feasible positioning technology for probe vehicle. Crowdedness spot is nothing but crowded area which constitute of multiple instances. To find out the crowdedness area of mobile vehicle in particular area in city is essential for control the traffic condition. Initial step for this is to cluster the instance in that area to acquire the density information. The practical discovering crowdedness spots in city consisting of many unique features such as highly mobile surrounding, Greatest possible restricted size of sample objects, and biased samples which is not uniform, and all these features have to built new challenges due to which traditional density based clustering algorithms is deficient to retrieve the genuine clustering property of instances and produce output less meaningful. To provide proper solution to overcome these challenges a novel non density based technique also knows as mobility-based clustering can be used to discover the crowdedness spot.
KEYWORDS: Mobility-based clustering, vehicle, Crowdedness Spot, traffic congestion, intelligent transportation systems.
I. INTRODUCTION
Traffic congestion is one of the major troubles in multiple transportation systems. The sudden raise traffic volume through the world is leading to enormous congestions generate multiple social, environmental and economic bad situations. Congestions are often generating by various traffic incidents. Crowdedness Spots and road incident induced traffic congestion provide real threats to the mobility and safety of our daily travel. So that, crowdedness spot information is a key element for avoiding congestion as well as for making informed driving route decision. Therefore timely and appropriate discovery of Crowdedness spots is an essential factor of any successful advanced traffic management system. If Crowdedness spots are discovered instantly, they can be cleared swiftly, resulting in less traffic congestion, and then more appropriate traffic management strategies can be applied to provide better service to the road users. So it is desired that the Crowdedness Spots related traffic performance to be measured so that the traffic flow can be improved.
ISSN(Online): 2319-8753 ISSN (Print): 2347-6710
International Journal of Innovative Research in Science,
Engineering and Technology
(An ISO 3297: 2007 Certified Organization)
Website: www.ijirset.com
Vol. 6, Issue 6, June 2017
As we know that multiple people are shifted towards urban city for employment, education ,etc population of urban city get increase due to this multiple city are facing various crucial trouble such as traffic jam ,emergency event (such as accident) and even disaster. Multiple crucial trouble are occur due to crowded moving object such as trains, vehicle, bus, etc. discovery of city mobility patterns, urban Crowdedness spot, road network usage and general patterns of the crowd movement within the city is useful in many smart city project. Main work in the Smart City project is identifying general patterns of the crowd movement within the city [2]. Informally, general patterns of the crowd movement within the city can be defined as areas of high crowdedness of vehicles. The crowdedness spots with especially high crowdedness are usually the sites of traffic congestions [6].The crowdedness spots of measure high crowdedness are commonly the sites of traffic accumulated to excess. An immediate application for acquiring the information of dense multitude spot is that can use to predict vehicle speeds based on the crowdedness classification. Indeed, dense multitude spots are often the potential sites of legal concern due to the major probability of events and opportunities (e.g., traffic jam, exhibitions, and commercial promotions). Because of the security issue and equipment limitation it is difficult to accumulate the location info0rmation of all the vehicles in the city .The spatio-temporal dynamics data of mobility object , crowd movement within the city can be consider as general object of item clustering in mobile situation [1][2].
In late year, web related clustering, evolutionary clustering [5] in not attaining a high degree changeable environments, and inconstant data streams have also attract a lot of awareness (e.g.. micro clustering). In an application structure, whatever, some new unique features make prior algorithms is not applicable to express the original clustering property of moving vehicles. First main challenge is incomplete information. Existing algorithm (for static or dynamic) are all depend on density based approach that use the internodes distance as a censorious prescribed amount. They rely upon the particular place information of target object exploit the clustering property. In addition with, multiple practical applications, it is improbable to acquire such information from the overall population of vehicles. It is greatly to debase the effectiveness of density-based algorithms. The second major challenge is the extremely restricted samples. The sample object set is a definite type of vehicles. It has very restricted generality to represent usual vehicles. Furthermore, there are also some practical challenges and concerns, such as drastic dynamism and high mobility of the object. To provide solution on particular challenges, a novel non density-based approach known as mobility-based clustering. Mobility based clustering significantly goes around existing density based clustering for giving accuracy of item density [2]. Mobility based clustering model is used to develop the crowded spot of specific range, compatibly taking mobility and instance dynamism. By using the mobility based clustering we can locate various spot can be differentiated by using spot mobility and crowded spot dynamism, which can play very essential role for development of future smart city project it can be use by city organizers.
II. RELATEDWORK
Towards mobility-based clustering by Prof. S. Liu, Y. Liu, L. Ni, J. Fan, and M. Li, have proposed emphasize is on moving micro-clustering (MMC) algorithm. Since moving micro groups are used for finding some closely related mobile instances, the in statement of such micro- clusters requires the thought of the speed data as well as the beginning point of location data. Mobility-based clustering, a novel approach is use to sort out hot spots and hot regions in a highly mobile surrounding with extremely limited and biased samples. Mobility-based clustering is differentiated from other clustering because it uses the speed information to infer the crowdedness of moving objects [2].
Jing Yuan, Yu Zheng, Xing Xie, Guangzhong Sun propose a cloud-based cyber-physical system for estimating nearly speedy road for a particular user, using a huge number of GPS-fitted vehicles and the user’s GPS-allot phone. First, GPS-equipped vehicles are used as mobile sensors probing the traffic rhythm of a city in the physical world. Second, a Cloud in the cyber world is created to accumulate and supplies the facts from these vehicles as well as other sources from the Internet like weather forecast. The well knowledge consists of intelligence of vehicle drivers in selecting driving route and traffic patterns on road external side. Third, the knowledge in the Cloud is used in turn to serve Internet consumers and common drivers in the physical world. Fourth, a mobile consumer, basically operating in a user’s GPS-phone, accepts a user’s query, connect with the Cloud, and give the output to the user. The mobile client gradually study a user’s driving manner from the user’s driving road and guide the Cloud to design the hot route for the user [3].
ISSN(Online): 2319-8753 ISSN (Print): 2347-6710
International Journal of Innovative Research in Science,
Engineering and Technology
(An ISO 3297: 2007 Certified Organization)
Website: www.ijirset.com
Vol. 6, Issue 6, June 2017
The Discovering Robust Time-Referenced Segmentation of Moving Object Trajectories by Hyunjin Yoon and Cyrus Shahabi has introduced three robust time-referenced trajectory segmentation algorithms that recognize both spatial and temporal structures presented in trajectory. Trajectory segmentation is the method of disjoining a given trajectory into a small number of similar pieces by using some criteria [4].
Evolutionary Clustering by Deepayan Chakrabarti ,Ravi Kumar ,Andrew Tomkins have introduced a evolutionary clustering should rely upon on two principle at the equal periods: first, the clustering at any specific location in time should stay truthful to the ongoing statistics as much as possible; and second, the clustering should not modify dramatically from one time step to the next [5].
Recently, clustering moving objects that is the grouping of object has become a crowdedness research outcome. In the research work, Li et al. explained the clustering of moving objects and enlarge the approach of micro cluster. High-quality moving micro clusters are dynamically kept up, which deliver fastest and relevant to event clustering conclusion [6].
W. Liu, Y. Zheng, S. Chawla, J. Yuan, and X. Xing, propose a novel statistical methodology to predict the density on any edge of system. This method is focused around short- time perceptions of the traffic history. In this manner, information about the end of each one travelling individual is not essential. Rather, that expects the people will act judiciously and pick the most compressed way from their starting point to their target place [7].
The urban traffic modelling and prediction using large scale vehicle GPS traces by Prof. P. S. Castro, D. Zhang, and S. Li introduce another density based algorithm named Flow scan and also introduce a method to construct a model of traffic density based on vehicle traces. On the behalf of clustering the moving objects, road segments are clustered concentrate over the density of common traffic they allow. It actualized Flow scan and tried it under various situation and trials demonstrate that the framework is both productive and powerful at finding hot routes [9].
III.SYSTEM ARCHITECTURE
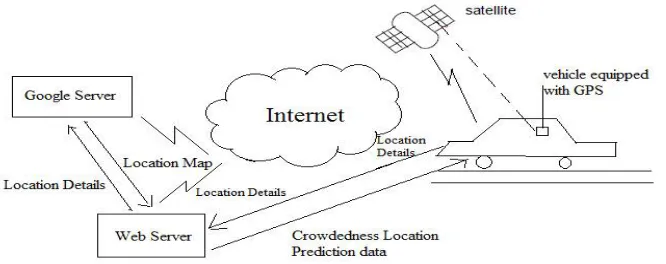
In following Fig.1 shows the system architecture of proposed system in which vehicles have been assembled with GPS receivers (one for each). By using GPRS link the GPS receivers periodically report their present states to a data centre. This reports consisting of current speed, geological region etc. In mobility based clustering statistics of vehicle speeds accumulated at each area. The spot crowdedness is then appropriate measurement related the current speed, maximum speed and minimum speed. Although if higher crowdedness represent smaller mobility, but a smaller mobility is not always caused by high crowdedness [1]. System architecture consists of Google server, web server and GPS which is assign to the vehicles.
ISSN(Online): 2319-8753 ISSN (Print): 2347-6710
International Journal of Innovative Research in Science,
Engineering and Technology
(An ISO 3297: 2007 Certified Organization)
Website: www.ijirset.com
Vol. 6, Issue 6, June 2017
Let vehicle user register with system and GPS location data i.e. Latitude and Longitude is sending to web server as input. Once user is register send location after every 5 sec from android application to web server. Web server receive the vehicle input data and GPS location data i.e. Latitude and Longitude this logic can be applied to nearby area to provide crowdedness spot and prediction output data to vehicle .At the same time other user in that area also send their location detail to web server. On web server we have Google APIs integrated in PHP code. When one of user want to display nearest user data on map in mobile PHP code will find nearest user using Google APIs and send required data back to mobile.
Required Data :- 1. Nearest user details
2. Average speed predicted
IV.MATHEMATICAL MODEL
Let S is the whole system consist of S= {I,P,O} Where
I = data input P = process O = output
Input – System get Vehicles data and GPS location information as input to find crowded spot consisting of data such as (Lat, Lon etc.). Where Lat is represent latitude and Lon is represent longitude
Let I be the Input consisting of attribute Vdt and GPSdt and it is represented as follow: I = {Vdt, GPSdt}
Vdt is the vehicle data can be represented as follow: Vdt= {VUid, VUnm, VUvhno., VUpass,dt, t} GPSdt is the GPS location data can be represented as: GPSdt= {Lat, Lon, Vspeed, Pdid}
Registration process for vehicles user required vehicle data and GPS location data (Lat, Lon etc.) is sending to the web server as an input data.
Process- vehicle input data and GPS location data is forwarded to web server for doing further steps, apply the logic for closely related areas and declared the crowded region and provide output data to vehicle user.
Let the P is process can be represented as: P= {Mapgen, Spred, Pveh}
Mapgen is the map generation: T = {Lat, Long, Pdid}
Spred is the prediction speed: T = {VUid, Vspd, Pdid}
Pveh is the population of the vehicles: T = {Pdid, Lat, Long}
In this process system can do the analysis of vehicle speed, crowdedness of other vehicles and then estimate the speed of the particular user’s vehicle. In same way it can estimate the crowdedness of other vehicles and show the crowdedness spot/areas.
Output - Extract relevant data from web server in particular interval corresponding to crowdedness spot and prediction speed of the vehicle.
Let O be Output can be represented as:
O = {Prediction data, Crowdedness spot, monitoring reports}
ISSN(Online): 2319-8753 ISSN (Print): 2347-6710
International Journal of Innovative Research in Science,
Engineering and Technology
(An ISO 3297: 2007 Certified Organization)
Website: www.ijirset.com
Vol. 6, Issue 6, June 2017
V. PRELIMINARY
The preliminary segment consists of characteristics of raw data which is created from city traffic, road network grid and observation and design principle of mobility based clustering.
I. Aspects of raw data
The raw data set is formed by using city traffic conditions which include the traces from register vehicles that have been assembled with GPS receivers. General packet radio service (GPRS) is use to regularly informed their present state to data centre by using GPS receivers. This report include information related with vehicles such as current speed, speed control, geographical region and also provide the information that the vehicles is full that is It consists of customer or not if it is empty means it does not have any person in vehicles.
The GPS is most probably applicable for civic application. As the cost of this application is not much, in that case the data report consists of multiple limitations. One of this is dataset is not compete. Also the statistics of vehicles may be incomplete. If GPRS signal is weak due certain condition such as vehicle is present in between high building or weather condition is not well and due to limited bandwidth of GPRS wireless channel particular data in report is missing so can’t generate appropriate result.
Also if GPS signal blocked reported GPS data may not be appropriate. As we know that GPRS service is not free, it is costly to consistently report their present status information. At the end the data is partial in temporal and spatial scope.
II. Road network grid
For making computation ease, time dimension is represented in the unit of second. The starting time, time instance d = 0.The time instances d and d + 1 are consecutive time instances. The physical space is represented by dynamically dividing the whole area into a number of rectangle grids. The size of each grid depends on the intensity of the reports at the area. Define the individual grid by using its centre area so that all area in the grid will be treated the same as that of the grid centre. A grid can be represented by using 2-tuple T = (o, a), where ois the index of the grid with the longitude, and a is with the latitude.
By using raw data, speed control can be capture. Most probably, the road is categorised into two directions. Accordingly, the speed is:
1) Road direction set and 2) Reverse direction set.
Most probably domain knowledge introduces for increase the grid and generate appropriate spot region. Vehicle speed and drive pattern is generally depend on road type and topology. So that road gridding play a vital role in particular incident such as some vehicle speed is low but area visited by it is not crowded because this area may be stop of vehicle or residential region. Hence, by studying past data raw data set is pre-processing to acquire good quality discovering accuracy.
III. Illustration and design standard.
ISSN(Online): 2319-8753 ISSN (Print): 2347-6710
International Journal of Innovative Research in Science,
Engineering and Technology
(An ISO 3297: 2007 Certified Organization)
Website: www.ijirset.com
Vol. 6, Issue 6, June 2017
VI. CROWDEDNESS SPOT ACQUISITION
The crowdedness spot can be taken into consideration as a higher standard of characteristics restored from register vehicles. In addition, we can make use of crowdedness spot to get information of the particular vehicle. For illustrating a general rule, the vehicle which cross crowdedness spots may be have more feasibility to confinement the crowded region data ; at the same period, these vehicles behaviour may help us give more knowledge related to city traffic transportation.
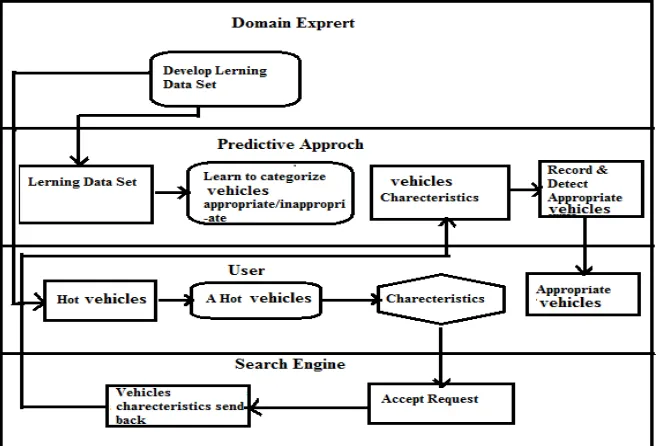
Fig. 2 Flow of the crowdedness vehicle intelligent search process
The above Fig. 2 shows the flow chart of crowdedness vehicles intelligent search process. In crowdedness vehicles intelligent search process, first domain expert makes the coordinated vehicle characteristics, utilizes them to organize the learning data sets, and these data sets are used to establish and design the predictive way. Second, the Targeted characteristics are disclosed to user. Third, user chooses a characteristic of personal influence to recall the suitable list of crowdedness vehicles from a search engine. Fourth, the recall vehicle is examined and arrange by the predictive approach. At the end, just the vehicles that are scored as appropriate are forwarded back to the user.
ISSN(Online): 2319-8753 ISSN (Print): 2347-6710
International Journal of Innovative Research in Science,
Engineering and Technology
(An ISO 3297: 2007 Certified Organization)
Website: www.ijirset.com
Vol. 6, Issue 6, June 2017
VII. EXPERIMENTAL RESULTS
We compare our approach with pre-existing approach such as Moving micro-clustering (MMC), Statistical traffic model, Flow scan algorithm usage the density of traffic. In which is all these pre-existing approach density of object plays the vital role but the proposed approach depend on the object mobility for that purpose mobility based clustering method is used.
Existing system consisting of different methods such as Moving Micro- Clustering (MMC) System, Statistical Traffic Model and Flow Scan Algorithm to detect the crowdedness spot. Moving micro-clustering (MMC) [2] System forceful posses movable item declaration of micro clusters need the acknowledgement of the speed information as well as the basic point information. MMC take 50-60 seconds time for prediction and generate up to 25% prediction bug. Statistical traffic model [8] is used to create the traffic density on any limit of the network at some future point of time. It takes 45-55 seconds time for prediction and generate up to 15% to 20% relative prediction bug. Flow scan algorithm control the density of traffic in series of road segment to check out traffic routes. Prediction time is about 40-45 seconds and prediction bug is up to 15 %. Our approach i.e. non density based also called as mobility based clustering the prediction time decreases up to 10-20 sec and generated prediction bug is less 10 percent respectively so from above comparison mobility based clustering is more appropriate method to detect crowdedness spot it take less time for prediction and percentage of prediction error generated is also less.
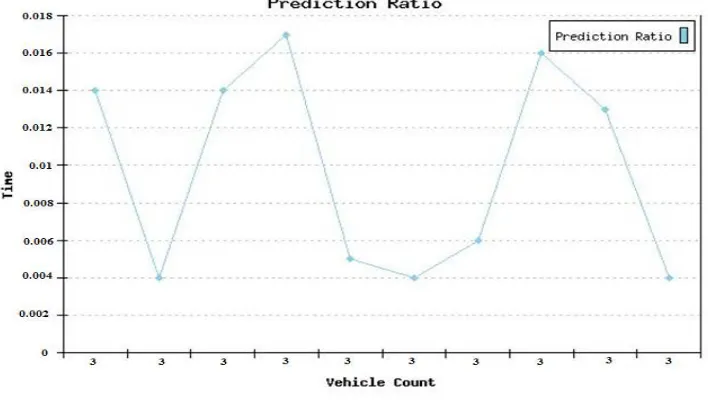
The following Fig. 3 prediction ratio shows the result by using parameters Time and Vehicle Count. Vehicle Count represent on X- axis and time represent on Y- axis. Prediction ratio can be estimated by using parameter Time and Vehicle Count. The proposed approach is run on the various time values which can be defined in sec and vehicle count. Following figure graph can be generated by using non density based also called as mobility based clustering can take less time to generate the output.
Fig. 3 Prediction Ratio
VIII.CONCLUSION AND FUTURE WORK
ISSN(Online): 2319-8753 ISSN (Print): 2347-6710
International Journal of Innovative Research in Science,
Engineering and Technology
(An ISO 3297: 2007 Certified Organization)
Website: www.ijirset.com
Vol. 6, Issue 6, June 2017
more advanced uniform service for road users also allow agencies to reply more instantly in eliminate the trouble, to address the upcoming traffic, and to decrease the hazard of secondary occurrence. In this paper, we use mobility-based clustering; a novel methodology to discover crowdedness spots in a versatile environment with extremely limited and biased object samples. The unique feature of mobility-based clustering is handle speed data to generate the crowdedness of moving vehicles.
Future work can be conducted along following directions. First, there are numerous determinants other than spot crowdedness that will have effect on vehicle mobility can be taken into consideration, for example, traffic lights and vehicle accidents can be taken into consideration. Second, better road gridding strategy is essential for getting better precious areas. Finally, depending upon different qualities of moving objects, other non-density based clustering may be worth further investigations.
REFERENCES
1. Siyuan Liu, Yunhuai Liu, Lionel Ni, Minglu Li, and Jianping Fan, “Detecting crowdedness spot in city transportation”, IEEE Transact
ions On Vehicular Technology, Vol. 62, NO. 4, pp. 1527-1539, May 2013.
2. S. Liu, Y. Liu, L. Ni, J. Fan, and M. Li, “Towards mobility-based clustering”, Proc. ACM SIGKDD, pp. 919–928, 2010.
3. J. Yuan, Y. Zheng, X. Xie, and G. Sun, “Driving with knowledge from the physical world,” in Proc. ACM SIGKDD, pp. 316–324, 2011.
4. H. Yoon, and C. Shahabi, “Robust time-referenced segmentation of moving object trajectories,” in Proc. IEEE ICDM, pp. 1121–1126,
2008,.
5. D.chakrabati, R. Kumar, and A. Tomkins , “Evolutionary clustering,” in Proc. ACM SIGKDD, 2006, pp. 554-560
6. Y. Li, J. Han, and J. Yang, “Clustering moving objects”, in Proc. ACM SIGKDD, pp. 617–622, 2004.
7. W. Liu, Y. Zheng, S. Chawla, J. Yuan, and X. Xing, “Discovering spatio-temporal causal interactions in traffic data streams”, in Proc.
ACM SIGKDD, pp. 1010–1018, 2011.
8. H.-P. Krieger, M. Renz, M. Schubert, and A. Zuefle, “Statistical density predict ion in traffic networks”, in Proc. IEEE ICDM, pp. 887–
892, 2007.
9. P.S. Castro, D. Zhang, and S. Li, “Urban traffic modelling and predict ion using large scale vehicle GPS traces”, in Proc. Pervasive, pp.