A Study on Behaviour of Symmetrical
I-Shaped Column Using Interaction Diagram
Sudharma.V.S.Acharya 1, R.M. Subrahmanya 2, B.G. Naresh Kumar 3, Shanmukha Shetty 4, Smitha 5
P.G. Student, Department of Civil Engineering, SCEM Mangalure, Karnataka, India1
Assistant Professor, Department of Civil Engineering, VCET Puttur, Karnataka, India2
Prof., Principal, Maharaja Institute of Technology, Mysore, Karnataka India3
Assistant Professor, Department of Civil Engineering, NMAMIT, Nitte, Karkala, Karnataka, India4
Assistant Professor, Department of Civil Engineering, SCEM Mangalure, Karnataka, India5
ABSTRACT: There are many code books which explain design of compression member including SP-16, IS-456 etc. The information’s also available in the form of interaction charts, but the negative point which says, the information’s which can we get from these code books is only limited to conventional sectional columns such as circular or with 4 edged columns, and one cannot get the interaction charts regarding C, T, L or I-shaped columns. The present work explains about this lack of information. This work is an attempt which deals with the behavioural study and strength of I-shaped columns by varying its parameters like grade of steel and concrete, reinforcement spacing, the obtained results explains that, noticeable increase in moment and load carrying capacity of column by increasing in grade of materials.
KEYWORDS: I-shaped column, Interaction charts, Compression member, Grade of steel and concrete SP- 16, IS- 456.
I. INTRODUCTION
Since design of column is time consuming process compare to other designs and also it is an iterative process. Hence for simplification SP- 16 has given non-dimensional interaction charts for different d'/D ratios along with percentage of steel. The code book SP- 16 has mentioned the procedure for interaction diagram for any column having different criteria.
For a specified concrete grade, percentage of steel, pattern of reinforcement, shape and dimension of column, interaction charts could be obtained by calculating strain at different positions of the column, there by calculating stress which intern gives moment and load values, once this couple of values obtained for various positions it then can be graphically indicated as an interaction chart which refers the Failure Envelop indicating, any set of moment and load that falls inside the envelop is said to be Safe. Also any combination that matches to the boundary of envelop is said to be the maximum load moment carrying capacity of that column.
II. SCOPEANDSIGNIFICANCEOFTHERESEARCHWORK
could give interaction charts for I-shaped and rectangular columns with which can vary the properties like grades, spacing of reinforcement etc… hence there by making plotting of interaction chart easier.
III.INTERACTIONDIAGRAM
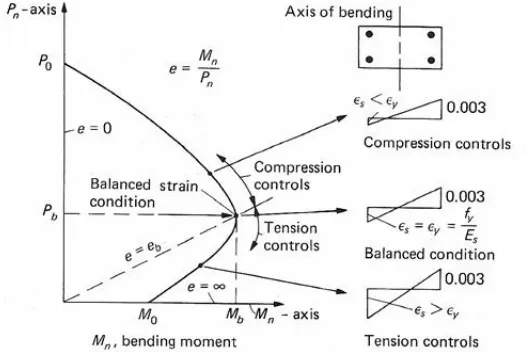
1. It is a graph which represents the strength characteristics of a column subjected to uni axial-eccentricity under given specification. Every column out there suffers from moments and axial load due to loading through eccentrically or some unbalanced residue moments at the corner of beam which supports on column as in below fig.
2. If a column having loaded less than limiting load axial capacity, it can resist considerable moment along with load. For various fluctuation of load, the systems can different values of moment. Likewise, the various combinations of moment and the load for each mode of failure for particular column section is determined and plotted the resulting curve is called Interaction Curve. This is useful either for checking or designing the section. Any set of combination of moment and load that falls outside the curve denotes failure, and any set of combination that falls inside the curve denotes Safe design.
Figure 1: Typical Interaction Diagram
3. There are 2 types of applications if this interaction diagrams are considered, it can be used to find the capacity of a particular column also if the combination of moment and loads are known, then the diagram could be efficiently used to design a column to resist against it.
4. To obtain interaction charts, neutral axis is positioned at various points, the corresponding moment and load capacity at that point is calculated, the total load carrying capacity of the section is formulated as the algebraic sum of all the axial loads of concrete at various points and that of steel. Similarly, total moment capacity of the column also evaluated.
IV.METHODOLOGY
1. Condition for Neutral Axis Case Located Inside the Column. a) Concrete capacity to hold axially applied loads
Puc =0.361xfckxBxXumax
In which,
fck = Characteristic compressive strength of concrete in (MPa).
B = Section width expressed in (mm).
Xumax = Depth of N.A from a high compression edge in (mm).
b) Strain in concrete or steel (ϵc) = 0.0035 x{
׳
} In which,
di׳ = Distance of ith bars of the steel from edge where high compression exists (mm).
c) Stresses from steel (fsc):
Table below shows the stress values for concrete grades from which stresses from steel could be extracted interpolation could also are carried.
Table 1: Stress-Strain Values for High Yield Strength bars d) Stresses from concrete (fc):
If, ϵc < 0.002, fcc =446 x fck x ϵcx { 1 - ( 250 x ϵc ) }.
ϵc ≥0.002, fcc = { 0.446fck }.
e) Total Capacity of section to hold load {Pu}:
= 0.361 x fck x B x Xumax + ∑ { [ Stress from steel.- Stress concrete ] x Ast}
f) Total Capacity of section to hold Moment { Muc }:
= 0.361 x fck x B x Xumax x { C.G – [0.416 x Xumax] }
In which, C.G =Distance of Centroid from the high compression edge.
Stress Level
f
y = 415 MPa fy = 500 MPa
Strain Stress MPa Strain Stress MPa
0.80f
yd 0.00144 288.7 0.00174 347.8
0.85f
yd 0.00163 306.7 0.00195 369.6
0.90f
yd 0.00192 324.8 0.00226 391.3
0.95f
yd 0.00241 342.8 0.00277 413.0
0.975f
yd 0.00276 351.8 0.00312 423.9
1.0f
g) Total capacity of section to carry out Moment {Mu}:
= 0.361 x fck. B x Xumax x {C.G – [0.416 x Xumax]} + ∑ { [ ( Stress from steel-Stress in concrete) x Ast ] x lever
arm}
In which,
Lever arm = [ C.G – di׳]
2. Condition for Neutral Axis Case Located Outside the Column. a) Concrete capacity to hold axially applied loads
Puc = C1 x fck x B x Xumax
In which,
fck = Characteristic compressive strength of concrete in ( MPa ).
B = Section width expressed in ( mm ).
Xumax = Depth of N.A from a high compression edge in (mm).
C1` = Area of stress corresponding to stress block parameter.
b) Strain in concrete or steel {ϵc}
= ϵcu x {
׳
} In which,
ϵcu = Ultimate strain = 0.0035 – 0.75 x ϵmin
ϵmin is evaluated as
. .
( ) = ( )
c) Using Table 4.1 Stress from steel { fsc } can be founded
d) Stress from concrete { fc }
If, ϵc < 0.002, fcc = 446 x fck x ϵc x { 1-[250 x ϵc]}
ϵc ≥0.002, fcc = 0.446 fck
e) Total capacity of section to hold load { Pu }
= C1` x fck x B x D + ∑ { [ Stress from steel - Stress in concrete] x Ast }
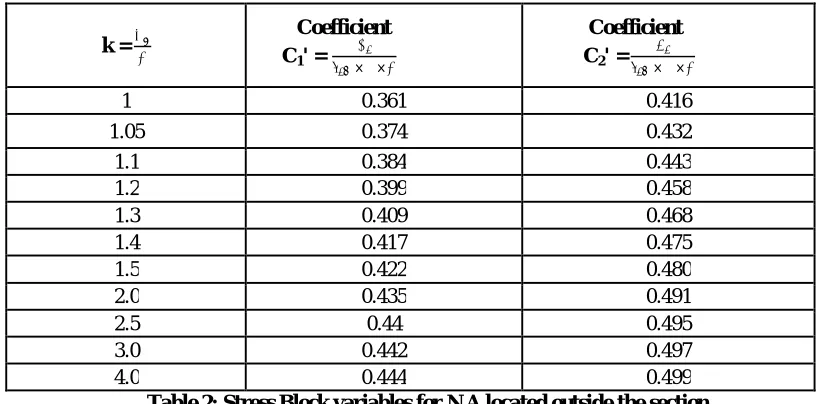
f) Total capacity of concrete to hold moment { Muc } = C1` x fck x B x Xumax x { C.G – [ Xumax x C2`] }
In which,
C.G = distance of Centroid from high compression edge.
C2` = Coefficient related to centroid distance of Stress block from high compression edge.
g) Total moment controlling strength of member { Mu }
= C1` x fck x B x Xumax x { C.G – [ C2`x Xumax ] } + ∑ { [ ( Stress from steel - Stress from
concrete) x Ast ] x lever arm distance} In which,
k = Coefficient C1' = × ×
Coefficient C2' = × ×
1 0.361 0.416
1.05 0.374 0.432
1.1 0.384 0.443
1.2 0.399 0.458
1.3 0.409 0.468
1.4 0.417 0.475
1.5 0.422 0.480
2.0 0.435 0.491
2.5 0.44 0.495
3.0 0.442 0.497
4.0 0.444 0.499
Table 2: Stress Block variables for N.A located outside the section 1. Condition for Neutral Axis Case Located At Infinity [ ‘e’ = 0 ]
Pu = 0.446 x fck x Ac + fs x Asc
In which,
Ac = Total concrete area in (mm2)
If grade of steel, fy= 415 ( MPa, )
fs = 0.79 x fy
If grade of steel, fy= 500 ( MPa, )
fs = 0.75 x fy
Asc = Total area of steel at compression provided
V. RESULTS AND DISCUSSIONS
Using Spread Sheet interaction diagrams were developed for I-shaped column, which also provides interaction diagram for rectangular column, the developed excel sheet will also has a capability of modifying grades, reinforcement spacing, size of sections etc.. SP -16 and IS: 456-2000, are the codes from which the methods are followed to develop interaction diagram, as mentioned in the methodology, the position of neutral axis is placed at different points on the section including K>1 as shown in table 2, Values of Mu and Pu were calculated, neutral axis position is also placed in between the reinforcement rows to get a continuous and smooth interaction diagram for particular I-shaped column.
A. Effect of Fe415, Fe500 grade of steel with varying grade of concrete
Figure 2: Effect of Fe415 Grade steel with Varying Grade of Concrete
1) For Fe415 and M20 Grade
Problem Data:
fck = 20 MPa Width of Flange = 1200mm
Diameter of bar = 25 mm Total Depth = 1400mm Effective Cover = 50 mm Spacing of Bar = 100 mm Thickness = 200mm fy = 415 MPa
Tables will be obtained in the same manner for other grades also
2) For Fe415 and M25 Grade
Problem Data:
fck = 25 MPa Width of Flange = 1200mm
Diameter of bar = 25 mm Total Depth = 1400mm Effective Cover = 50 mm Spacing of Bar = 100 mm Thickness = 200mm fy = 415 MPa
3) For Fe415 and M30 Grade
Problem Data:
fck = 30 MPa Width of Flange = 1200mm
Diameter of bar = 25 mm Total Depth = 1400mm Effective Cover = 50 mm Spacing of Bar = 100 mm Thickness = 200mm fy = 415 MPa
4) For Fe415 and M35 Grade
Problem Data:
fck = 35 MPa Width of Flange = 1200mm
fy = 415 MPa Effective Cover = 50 mm Diameter of bar = 25 mm
5) For Fe415 and M40 Grade
For the above cases, interaction diagrams has been developed and the following graph shows the evaluation of load and moment capacities of different grade of concrete with Fe415 grade of steel, same methods has been followed to obtain the interaction diagram for varying grade of concrete with Fe500 grade of steel, obtained results then compared with ETABS- 2015 and obtained results were then analysed.
Figure 3: Comparison of Interaction chart between Manual and ETABS for fy = 415 MPa dia = 25mm and fck = 25 MPa
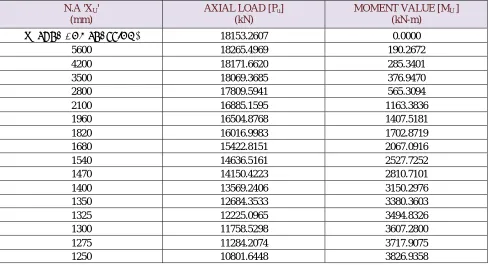
Table 3: Moment and Load Capacity for M25 Grade Concrete and Fe 415 Steel
N.A 'XU' (mm)
AXIAL LOAD [Pu] (kN)
MOMENT VALUE [MU ] (kN-m)
∞ (PURE COMPRESSION) 18153.2607 0.0000
5600 18265.4969 190.2672
4200 18171.6620 285.3401
3500 18069.3685 376.9470
2800 17809.5941 565.3094
2100 16885.1595 1163.3836
1960 16504.8768 1407.5181
1820 16016.9983 1702.8719
1680 15422.8151 2067.0916
1540 14636.5161 2527.7252
1470 14150.4223 2810.7101
1400 13569.2406 3150.2976
1350 12684.3533 3380.3603
1325 12225.0965 3494.8326
1300 11758.5298 3607.2800
1275 11284.2074 3717.9075
1200 9799.7151 4046.6247
1150 9200.3605 4363.9354
1100 8552.7654 4700.3428
1050 7849.1716 5059.8031
1000 7078.2273 5445.0755
950 6242.9653 5851.0014
900 5500.3383 6177.7542
850 4858.7987 6428.8372
800 4287.6582 6610.7946
750 3746.1375 6755.2583
700 3224.3245 6867.0056
650 2731.8110 6930.9712
600 2276.1794 6948.7429
550 1820.7164 6940.7119
500 1361.6963 6906.4665
450 892.2766 6840.8024
400 398.0651 6742.5754
350 -132.2784 6605.0961
300 -675.4821 6431.1971
250 -1339.6938 6172.0051
200 -2426.3409 5662.8667
150 -4207.4967 4699.4761
125 -5371.3524 4046.8480
100 -6776.5315 3248.0610
75 -7788.5688 2623.7843
50 -9379.2548 1590.1655
Figure 4: Interaction diagram for M40,M35,M30,M25 and M20 with Fe415 as Grade of Steel
B. Effect of Fe415, Fe500 grade of steel with varying grade of concrete
Same steps were followed to develop interaction diagram with Fe500 as steel grade results were then compared with Fe415
.
Figure 5: Interaction diagram for M40,M35,M30,M25 and M20 with Fe500 as Grade of Steel
C. Effect of Variation of Diameter on Strength Capacity of I-shaped Column 1. Effect of 3 layers of bars
Problem Data:
fck = 30 MPa Width of Flange = 1200mm
2. Effect of Absence of Diameter in the middle layer of bar
fck = 30 MPa Width of Flange = 1200mm
Diameter of bar = 16 mm Total Depth = 1400mm Effective Cover = 50 mm Spacing of Bar = 100 mm Thickness = 200mm fy = 415 MPa
3. Effect of absence of bars at the centre of web
fck = 30 MPa Width of Flange = 1200mm
Diameters took = 25 mm Total Depth = 1400mm Spacing of Bar = 100 mm fy = 415 MPa
Effective Cover = 50 mm
4. Middle 4 Rows 20mm Diameter Remaining 25mm Diameter
fck = 30 MPa Width of Flange = 1200mm
Diameters took = 25 mm Total Depth = 1400mm = 20 mm Spacing of Bar = 100 mm Effective Cover = 50 mm fy = 415 MPa
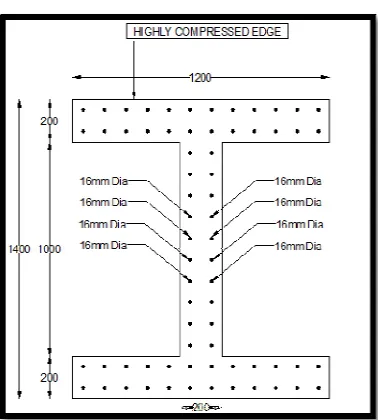
5. Middle 4 Rows 16mm Diameter Remaining 20mm Diameter
fck = 30 MPa Width of Flange = 1200mm
Diameters took = 20 mm Total Depth = 1400mm = 16 mm Spacing of Bar = 100 mm Effective Cover = 50 mm fy = 415 MPa
Figure 6: Typical I-shaped column for Trial 5
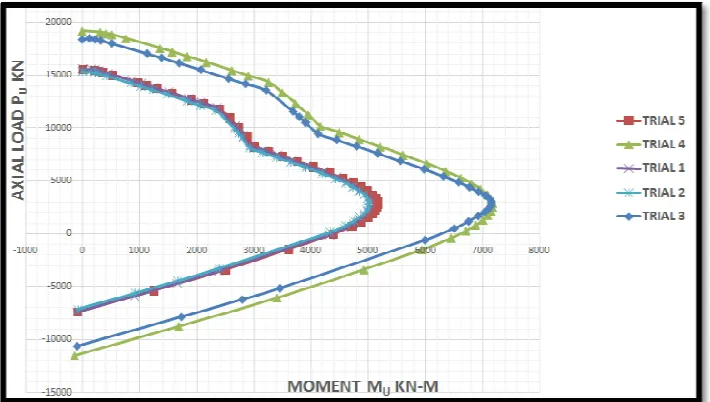
Figure 7: Interaction Diagram for Effect of Variation Diameter
VI. CONCLUSION
a. Higher grades of concrete or steel will result in a consequent increase in moment and load carrying capacities of I-shaped RC columns.
b. The study pertaining to the influence of variation in bar dia of reinforcement establishes that it would result in acknowledgeable increase in maximum load and moment carrying capacities as it is nothing but increase in percentage of steel.
c. The deviation in load moment curve generated by ETABS with that developed by analytical procedure is mainly because of the application of Whitney’s stress block parameters in ETABS and Parabolic Rectangular stress block as adopted by IS 456 in the present analytical procedure.
d. A sudden reduction in load and moment carrying capacities was observed as depicted by the load moment interaction diagram at junction of flange and web. This behaviour is because of sudden reduction in Width of flange to a new value of width of web.
REFERENCES
[1] N. Ekta and Kuchhadiya, “computer aided design of reinforced concrete column subjected to axial compression and bending”, PARIPEX–
Indian journal of research, Vol. 4, No. 5, 2015.
[2] Dr.S. Sarmad, Abdul-Quader AL-Badri and Dr. Asma‟a, A. Ahmad, “Design Charts For Channel Shaped Reinforced Concrete Short Columns
Subjected To Axial Compressive Load And Uniaxial Bending”, Eng. & Tech. Journal, Vol. 27, No. 4, 2009.
[3] L.N. Ramamurthy and T.A. Hafeez Khan, “Journal of Structural Engineering”, Vol. 109, No. 8, 1983.
[4] “IS–456:2000: Indian Standard Code of Practice for Plain and Reinforced Concrete”, BIS, New Delhi.
[5] “SP–16:1980: Design aids for reinforced concrete to IS: 456-1978”, Bureau of Indian standards