ISSN(Online): 2319-8753
ISSN (Print): 2347-6710
I
nternational
J
ournal of
I
nnovative
R
esearch in
S
cience,
E
ngineering and
T
echnology
(An ISO 3297: 2007 Certified Organization)
Vol. 5, Issue 8, August 2016
Land Mapping Based On Hyperspectral
Image Feature Extraction Using Guided Filter
Fazeela Hamza 1, Sreeram S. 2
P.G. Student, Department of Computer Engineering, MEA Engineering College, Perinthalmanna, Kerala, India1
Associate Professor & HOD, Department of Computer Engineering, MEA Engineering College, Perinthalmanna,
Kerala, India2
ABSTRACT: In the area of Remote Sensing as well as Geosciences, whenever a particular scene is captured, it becomes very difficult to identify each and every object in the image. Here comes the advantage of using hyperspectral imaging and feature extraction method. Hyperspectral images are taken using satellites. To classify such images feature extraction is an effective method .The problem of the “curse of dimensionality” emerges when a statistic based classification method is applied to the hyperspectral data. A simpler and an effective way of processing with hyperspectral data is to reduce the dimensionality. This can be done by feature extraction that a small number of features are extracted from the hyperspectral image when confronted with a limited set of training samples. This paper mainly focuses on guided filtering. Guided filtering with SVM classifier will yield a better accuracy.
KEYWORDS:Remote sensing, Hyperspectral image, Feature extraction, Guided filter, Curse of dimensionality.
I. INTRODUCTION
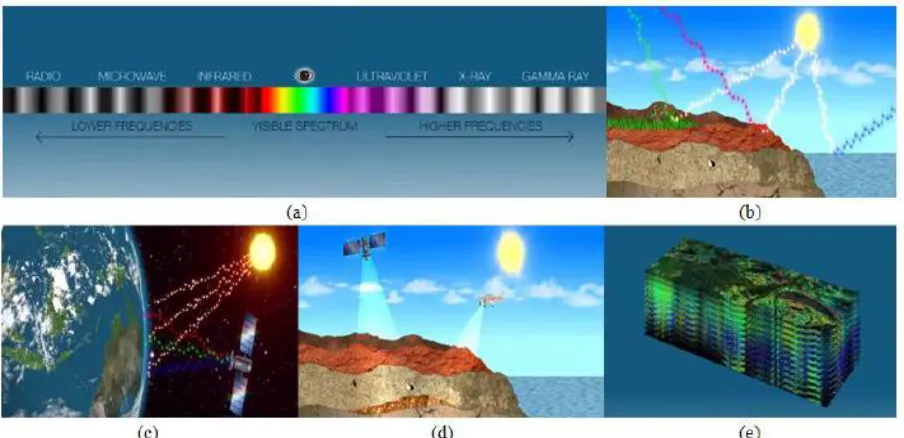
Fig -1: a) Electromagnetic spectrum b) reflectance of a chunk of the electromagnetic spectrum from the materials on the Earth’s surface, (c) hyperspectral sensors which scan the sunlight bouncing off the Earth’s surface, (d) sensors mounted on airplanes or low orbit satellites and (e) hyperspectral image cube.
Every pixel in the hypercube consists of a contiguous reflectance spectrum, which means that each pixel contains contiguous bands of electromagnetic spectrum from visible to infrared regions that can be used to recognize the objects in the scene since it provides much more complete information about the scene than the normal color camera.
Comparing with other imaging technologies, hyperspectral spectral imaging can yield much more detailed
information about the scene or the surveyed area. Thus, hyperspectral imaging leads to an tremendously enhanced
ability to classify the objects in the scene based on their spectral properties. However, the classification of hyperspectral image is a very difficult task in recent days due to the huge number of band values for each pixel. Hence, dimensionality reduction becomes an important step for successfully implementing hyperspectral image classification.
Curse Of Dimensionality
The high dimensionality of hyperspectral data should increase the abilities and effectiveness in classifying land mapping/cover types. Though, the classification methods that have been successfully applied to multispectral data in the past are not as effective as hyperspectral data. The major reason is that the size of training data set that does not adjust to the rising dimensionality of hyperspectral data. If the training samples are inadequate for the needs, which is frequent for the hyperspectral case, the estimation of statistical parameters becomes inaccurate and unreliable. As the dimensionality increases with the number of bands, the number of training samples needed for training a specific classifier should be increased exponentially as well. The rapid increase in training samples size for density estimation is termed as “curse of dimensionality” by Bellman , which leads to the “peaking phenomenon” or “Hughes phenomenon” in classifier design (Hughes, 1968). The result is that the classification accuracy first grows and then declines as the number of spectral bands increases while training samples are kept the same.
ISSN(Online): 2319-8753
ISSN (Print): 2347-6710
I
nternational
J
ournal of
I
nnovative
R
esearch in
S
cience,
E
ngineering and
T
echnology
(An ISO 3297: 2007 Certified Organization)
Vol. 5, Issue 8, August 2016
that a small number of salient features are extracted from the hyperspectral data when confronted with a limited set of training samples.
Hyperspectral image has very strong spectral correlation that means there is frequently a significant amount of redundant and misleading information present in the image and such information needs to be removed before any further processing can be carried out .For this reason, it is often useful to reduce the data dimensionality.
II. LITERATURE SURVEY
There were lot of dimensionality reduction techniques used earlier such as Principal Component Analysis (PCA) [2], Minimum Noise fraction (MNF) [3],Linear Discriminant Analysis (LDA) [4], Linear Spectral mixture analysis (LSMA) [5] , Wavelet Based methods [6], Independent Component Analysis (ICA) [7], weighted sum based image fusion method, feature extraction [8], feature selection [9] etc.
PCA is performed on subset and also transforms image in to a new coordinate system without considering
noise. In case of LDA the maximum number of features that can be extracted remains the same which may not be
sufficient for achieving better accuracy in practical application. Wavelet based method is lossy compression method. As far as feature selection is concerned, it selects a better subset from whole of the available subsets and preserves the physical meaning of the data. But the disadvantage is that as the number of features increases, the dimensionality of data also increases and it will be difficult to select a better subset from the available subsets of data. Also, by using an assumption that if a subset is selected as the best subset, in reality it might not be the best.
A recent proposed method is feature extraction with image fusion and recursive filtering [1]. This method is
more advantageous while comparing with other methods.
III.PROPOSED METHOD
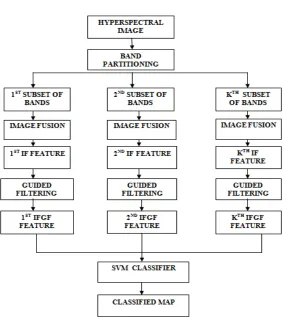
Main objective is to reduce the computational dimensionality, computational time, and increase the accuracy and efficiency of data. The proposed method consist of following steps:
1) Hyperspectral image are partitioned in to multiple adjacent bands.
2) Adjacent bands are fused by simple averaging fusion method (IF).
3) Perform Guided filter method.
4) Perform SVM classification.
Fig -2: Block diagram of proposed work
3.1 Band Partitioning
The hyperspectral images are partitioned in to K subsets of bands depending on the frequencies of electromagnetic spectrum [1]. Every subset consists of a large amount of bands. Based on value of K , subsets or number of features are obtained.
3.2 Image Fusion
Image fusion is the process of combining relevant information from two or more images in to a single image. The resulting image will be more informative than any input images . Simple averaging method is used here which calculates the average image of each and every subsets and aims at the removal of noisy pixels and redundant information from these subsets.
3.3 Guided Filtering
In order to obtain Kth feature, guided filtering [10] is performed on each fused bands. Guided Filter (GF) performs edge preserving smoothing on an image, using the content of a second image, called guidance image, to influence the filtering. The guidance image can be the image itself, a different version of the image, or a completely.
Guided image filtering is a general linear translation- variant filtering process, which involves a guidance image I, an input image p, and an output image q. Both I and p are given beforehand according to the application, and they can be identical. The filtering output at a pixel i is expressed as a weighted average:
ISSN(Online): 2319-8753
ISSN (Print): 2347-6710
I
nternational
J
ournal of
I
nnovative
R
esearch in
S
cience,
E
ngineering and
T
echnology
(An ISO 3297: 2007 Certified Organization)
Vol. 5, Issue 8, August 2016
Where i and j are pixel indexes. The filter kernel Wij is a function of the guidance image I and independent of p. This
filter is linear with respect to p. The filtering output is locally a linear transform of the guidance image. The key assumption of the guided filter is a local linear model between the guidance I and the filter output q. Assume that q is a
linear transform of I in a window centered at pixel K.
= +
The values of linear coefficients a and b are:
= 1 { − , } ÷ ( + )
= ,−
Here and are the mean and variance of I in , N is the number of pixels in , and P’k is the mean of p in .
∈ is the regularization parameter. After performing GF the output is IFGF (Image Fusion Guided Filter) features.
3.4 SVM Classifier
For the classification of IFGF features SVM (Support Vector Machine) classifier is used. The SVM classifier is one of the most widely used pixelwise classifiers and has, in particular, shown a good performance in terms of classification accuracy. Here multiclass SVM classifier is used because hyperspectral image is classified in to 16 class labels. A simple binary SVM classifier can take only two values +1 or -1. To get M-class (Multi-class)classifiers, construct set of binary classifiers f 1, f 2, . . . , f M, each trained to separate one class from rest.
IV.EXPERIMENTAL RESULTS
1) Experimental Setup
Here two datasets are used Indian pines image and Salinas image. Each of these dataset are explained below.
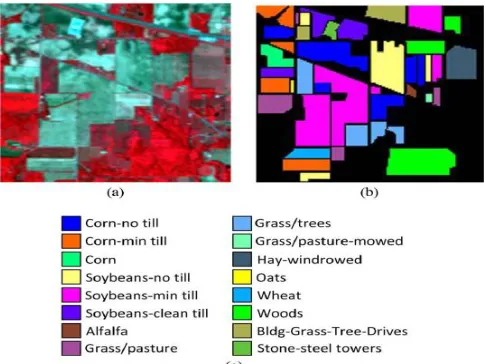
Indian pines image reveals agriculture details regarding the Indian Pine test site of North Western Indiana. AVIRIS (Airborne Visible Infrared Imaging Spectrometer) sensor was used to capture it.
This image consist of 145x145x220 size were only 200 bands are considered and the remaining 20 water absorption bands are removed. The Indian Pine image consists of 20m per pixel as its spatial resolution and its spectral coverage is
from 0.4 to 2.5μm. Indian pines image is shown in fig3. Fig4 shows final classified output of Indian pines.
Fig-4: Classified map of Indian pines image using SVM classifier.
Salinas image was captured by the AVIRIS sensor over Salinas Valley, CA, USA. The image has 224 bands and is of size 512 _ 217, with a spatial resolution of 3.7 m per pixel. Similar to the Indian Pines image, 20 water absorption bands (no. 108 {112, 154 {167, and 224) were discarded. The color composite of the Salinas image and the corresponding ground truth data are shown in fig5. Both Indian pines and Salinas image dataset is taken from
http://www.ehu.eus/ccwintco/index.php?title=Hyperspectral_Remote_Sensing_Scenes. Fig6 shows final classified map
of Salinas image.
ISSN(Online): 2319-8753
ISSN (Print): 2347-6710
I
nternational
J
ournal of
I
nnovative
R
esearch in
S
cience,
E
ngineering and
T
echnology
(An ISO 3297: 2007 Certified Organization)
Vol. 5, Issue 8, August 2016
Fig-6: Classified map of Salinas image using SVM classifier.
2) Evaluation
In order to evaluate the performance of the proposed method, two widely used quality indexes are Overall Accuracy (OA) and Average Accuracy (AA). OA measures the percentage of pixels that are correctly classified. AA refers to the mean of the percentage of correctly classified pixels for each class. Here another filter that is Recursive Filter (RF) is also used to compare the output. Here sample1 is Indian pines image and Sample2 is Salinas image. Comparison table is shown below:
Filter Sample1 OA Sample2 OA AA
RF 97.0726 99.2196 98.1461
GF 99.5084 99.5298 99.5191
Table1: Performance comparison of two edge preserving filters.
From the table1 it is clear that GF when used with Hyperspectral image can give better and more accurate result than RF.
V. CONCLUSION AND FUTURE WORK
The edge preserving Guided filter performs very well in terms of both quality and efficiency in a great variety of applications, such as noise reduction, detail smoothing/enhancement, HDR compression, image matting/feathering, haze removal and joint up sampling. The proposed method has got many advantages like 1)Features can well preserve the physical meaning of the hyperspectral data 2) Guided filter EPF (Edge Preserving filter)is a time efficient and very fast filtering method 3)The classification accuracy obtained by this IFGF method are not influenced by parameters,
where as in Recursive filter method classification accuracy are influenced by parameters like spatial and range
parameter. Guided filter along with SVM classifier yield better result.
REFERENCES
[1] Xudong Kang, Shutao Li, and Jón Atli Benediktsson,“Feature Extraction of Hyperspectral Images With Image Fusion and Recursive Filtering,”
IEEE Trans. Geosci. Remote Sens., pp. 3742 – 3752, vol. 52, no. 6, 2014 .
[2] Craig Rodarmel and Jieshan,"Principal Component Analysis for Hyperspectral Image Classification," Surveying and Land Information
Systems, vol. 62, no. 2, 2002.
[3] Rhonda D. Phillips and Layne T. Watson, Christine e. Blinn and Randolph H. Wynne,"An Adaptive Noise Reduction Technique for Improving
The Utility of Hyperspectral Data," Pecora17 – The future of land imaging. Going operationa , pp. 18 – 20 November , 2008.
[4] Tatyana V. Bandos, Lorenzo Bruzzone and Gustavo Camps-Valls,"Classification of Hyperspectral Images With Regularized Linear
Discriminant Analysis," IEEE Trans. Geosci. Remote Sens., vol. 47, no. 3 ,March 2009.
[5] Chein-I Chang, Shao-Shan Chiang, James A. Smith and Irving W. Ginsberg,"Linear Spectral Random Mixture Analysis for Hyperspectral
Imagery," IEEE Trans. Geosci. Remote sens., vol. 40, no. 2, February 2002.
[6] B.Salehia and M.J.Valadanzoej,"Wavele-based Reduction of Hyperspectral Imagery”.
[7] A. Villa, J. A. Benediktsson, J. Chanussot, and C. Jutten, “Hyperspectral image classification with independent component discriminant
analysis,” IEEE Trans. Geosci. Remote Sens., pp. 4865–4876, vol. 49, no. 12, Dec. 2011.
[8] X.Jia, B C Kuo and M. M. Crawford. 2013. “Feature mining for hyperspectral image classification,” Proc. IEEE, pp.676-697Vol.101, No.3.
[9] M. Pal and G. M. Foody. 2010. “Feature selection for classification of hyperspectral data by SVM,” IEEE Trans. Geosci. Remote Sens., pp.
2297–2307, Vol. 48, No. 5.