Wi-Fi based Smart Energy Distribution
System using Arduino and Python
Nithin Sreekumar1, Lekshmylal P L2
P.G. Student, Department of E.C.E, Rajadhani Institute of Engineering and Technology, Attingal, Kerala, India1
Assistant Professor, Department of E.C.E, Rajadhani Institute of Engineering and Technology, Attingal, Kerala, India2
ABSTRACT: India is fourth in energy consumption in the world and a major is produced from coal. Now the country
is facing coal shortage and high energy demands. Still 35% of people in the country live without access to electricity. Energy resources are limited. India has only 1% of world’s energy resources but it has 16% of world population. Energy conservation is very important and this awareness should reach the energy consumers. Here a Wi-Fi based smart energy distribution system is being proposed, that automatically calculates the power consumption and this data is sent through wireless Wi-Fi connection to a web server. Measurements are done in the server itself. Also Wi-Fi handheld device is used to collect energy consumption data from rural areas where internet services may reach slowly. Wireless internet is provided by Wi-Fi hotspots that the Kerala government is implementing here at a phased manner. The proposed system is capable of giving alerts to the customer through SMS and email. Real time energy consumption and price is monitored and alerted the consumer if it exceeds monthly average. An RF-ID reader is included for reading the alerts and messages received in the smart energy meter for a particular customer. Automatic complain booking system and customer awareness programs can be implemented in this system at no cost by the energy providers.
KEYWORDS: Wi-Fi Energy Meter; Wireless Energy Meter; Smart Energy Meter; Automatic Energy Meter; RF-ID.
I. INTRODUCTION
The energy consumption is fast growing in India and its fourth in position after China, USA and Russia [12]. In India still 35.5% of the population lives without access to electricity [12]. About 70% of India's electricity generation capacity is from fossil fuels (40% from coal) [12]. India's coal imports for electricity generation increased by 18% in 2010[12]. Lots of money is expensed for energy- saving program campaigning in India yearly [12]. The case is not different in the state of Kerala. Kerala needs the implementation of smart energy meter systems to ease, automate, to alert and to aware people about the importance of energy saving.Kerala is rapidly changing into a Wi-Fi hub. Here a Wi-Fi based smart energy meter system is being proposed as a small step to aware people about energy crisis and to simplify the customer interaction with the energy distributors. The Wi-Fi is not being used in energy transmission and distribution in any country and is still under research.
II. RELATED WORK
The problems involved in the current systems are, the need of manual inspection for billing which is a tedious job and involves a lot of difficulties. There is no alerts or awareness against misused energy. The customer knows it only when he/she receives the bill. The current energy meters are not much user-friendly and needs expert interpretation for self-analysing the power consumption. Manual complaint booking is required if the power line is off or cut by any other reason. There is no alert or late alert for paying of bills and there is no real time pricing display according to current energy consumption.
In our proposed system the Wi-Fi energy distribution system is designed as per the below ideas:
1. A handheld device for collecting the readings directly from each energy meter, where direct Wi-Fi connection to the main server is not possible.
3. Real time pricing is shown by recording the usage of one day and calculating the monthly or bimonthly estimated bill using the data from opto-coupler.
4. Hardware and software fully open source and cross platform supported.
5. Awareness messages and alerts will be send to the energy meter. Messages are protected and can be read only by a consumer with the RF-ID that he gets with a particular energy meter.
6. Automatic complaint register using the idea of PINGING of all energy meters in an area, and will automatically release the complaint if the energy meter comes online again.
III.PROPOSED SYSTEM
The main objective of this project work is to study about the energy distribution system and its crisis, design and develop a Wi-Fi based smart meter and to aware people the importance of saving energy. Implementation of the system using open source hardware like Arduino board and software as much as possible.
BLOCK DIAGRAM
(a) (b)
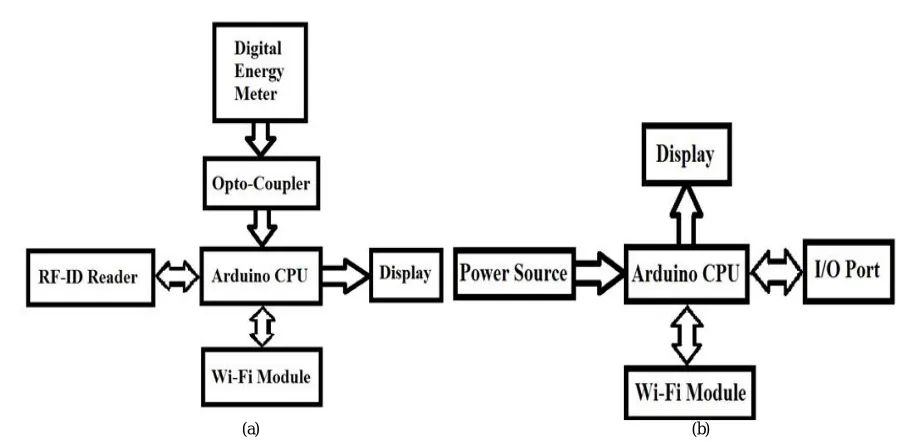
Fig. 1. The block diagram of proposed system (a) The smart energy meter (b) The handheld device
The block diagrams of the proposed system and the handheld device are shown above: Fig 1 (a) shows the block diagram of the smart energy meter and Fig 1 (b) shows the block diagram of the handheld device.
1. DIGITAL ENERGY METER: Here a digital energy meter is used. It contains a dedicated special IC which calculates the energy consumption. BL6501 IC is used here which is a single phase energy meter IC. This digital data is converted to average value which is the measurement of power. This digital data is then converted to analogue signal using analogue to digital converter. The output of the dedicated IC is available as pulses which can be indicated using a LED.
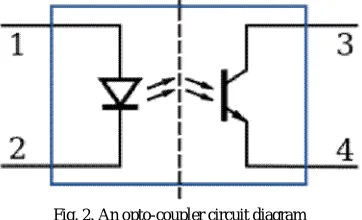
cost. the Opto-Coupler also protects the Arduino CPU from direct contact over high voltages by isolating it. The signal is transmitted as light energy as shown in the Fig 2.
Fig. 2. An opto-coupler circuit diagram
3. ARDUINO CPU: Arduino is used as the CPU. It controls the functioning of the wireless part which makes the ordinary digital energy meter into a smart energy meter. The capabilities of Arduino are limitless and therefore its functionality can be further increased by genuine ideas. The Arduino CPU coding can be done by C or C++ using software IDE provided by them and can be transferred to Arduino by a micro-USB port from computer to it.
4. RF-ID READER: An optional RF-ID reader module is included here which is only used to read the messages received for a particular customer by himself or herself sent by the energy provider. Many people may think this feature is unnecessary as messages send by the energy provider includes only his/her energy usage bill, awareness messages or alert messages. No important messages may be send by energy provider to the customer.
5. WI-FI MODULE: The Internet of Things (IoT) enables all objects to collect and exchange data through an IP address [17]. Here Wi-Fi is used for data transmission and reception between smart energy meter (SEM) and web server with the help of public Wi-Fi hotspots provided by the Government. In Rural areas, where developments are in a slowed pace, a Wi-Fi enabled handheld device is used to collect the data.
6. DISPLAY: Here two LCD displays are used, one for the energy meter and other for the handheld device. For the energy meter 20x4 display is used (you can also use 16x2 LCD), which means 20 characters can be displayed in a single line, there are 4 lines and therefore a total of 80 characters can be displayed at a time. For handheld device 16x2 LCD display is used.
7. INPUT/OUTPUT PORT (I/O): A common I/O port such as a USB or micro-USB port is used for transfer of data between the device and the computer.
8. POWER SOURCE: For the energy meter power is taken from the power line itself. For the handheld device a good portable power source is required as it may take hours to complete one route.
SOFTWARE: The program code is written in python language as it is easy for coding. C++ language is used to successfully implement the hardware functions as Arduino is the core hardware. Software for sending SMSs and emails (i.e. the server part) is already with the power distributor so no need to again create it. The awareness messages can be sent directly to the energy meter through the Wi-Fi. IP ping feature is used to determine the power failure of a particular area. RF-ID security tag is used to ensure that the customer has read the message, a beep sound will be produced if the message is not read.
Fig. 3. Flowchart of operations
Another feature of this system for rural places, where wireless implementation takes time, is that a handheld Wi-Fi device is given to the person who comes to take the readings. This device is capable of automatically acquiring the readings from nearby energy meters’ even if there is no one in the house. The meter reader just has to go through the nearby road. A small security key will be implemented in both the devices so that only authorized handheld devices can read the data from the Wi-Fi energy meter from a house. This data is fed to the energy distributor server system from where message alerts or emails will be sent to the customer and also calculates the energy bill for the previous month. Real time price and system monitoring and over usage alerts are sent to customer for self-inspection of the condition.
IV. RESULT
The output is divided into two units:
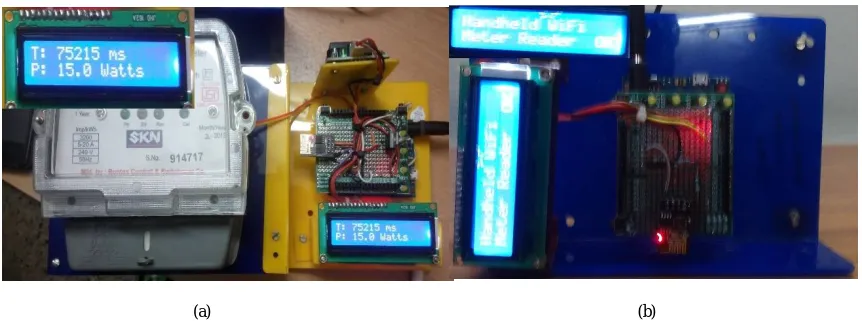
1. HARDWARE SECTION: The Fig 4 (a) shows the smart energy meter showing the current load as P and pulse width as T, and (b) shows the handheld device. The smart meter shows the current power usage and its pulse width.
(a) (b)
Fig 5. Displaying the message
The above figures show the implemented hardware parts and its working. The Fig 4 shows the smart energy meter and the handheld device, while the Fig 5 shows the message that is displayed on the LCD display if the RF-ID input is successful.
2. SOFTWARE SECTION: The software output is divided into four units,
A. SELECTION OF CHOICE: Here the user is asked to select an option whether to get data from the handheld device or add a new customer or to calculate the bill for existing customers from the data collected by the server or hand-held device or to send messages to customer. Fig 6 shows the selection of choice.
Fig. 6. Selection of choice
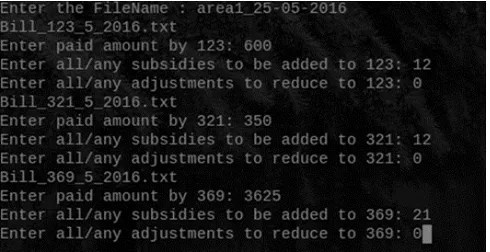
B. BILL CALCULATION: This option is selected to calculate the electricity bill for the existing customers. The file name has to be entered so that the information (customer number and current usage) can be obtained correctly.The Fig 7 shows the bill calculation procedure.
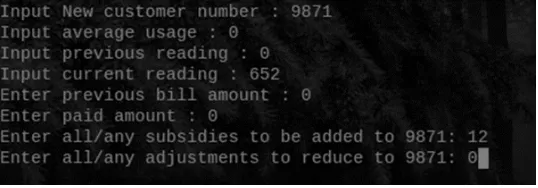
C. ADDING OR EDITING A CUSTOMER: This option can be used to add new customer or to update an
Fig. 8. Adding or editing a customer
existing customer. The added new customer data can also be viewed to verify whether the entered data is accurate or not. There will be an option to add another new customer if any.
.
D. SENDING MESSAGES TO CUSTOMER: This option is selected for sending messages, alerts and energy saving awareness messages to the customer. When sending the message is successful it displays a message on the screen, and the alert or message is send to the smart energy meter.
Fig. 9. Sending messages to customer
V. FUTURESCOPE
As the future work this project can be modified to rectify the current disadvantages like manual inspection of billing can only be avoided only if the whole area is connected to Wi-Fi hotspots, when the power line goes off for an area the Wi-Fi hotspots which may be connected to this power line also goes off, which causes delay in data reception by server etc. Now research is being conducted to transfer data through high voltage lines (but till now it is not successfully implemented as it contains many challenges). This may eliminate the need of wireless hotspots in future. Making the customer contact equipment with current work will only lead to over cost product. Mobile Apps are available now for ensuring a good relationship between customer and distributor.
VI.CONCLUSION
REFERENCES
[1] Chunchi Gu, Hao Zhang, and Qijun Chen,” Design and Implementation of Energy Data Collection System Using Wireless Fidelity (Wi-Fi) Module and Current Transformer”, IEEE International Conference on System Science and Engineering (JCSSE), Shanghai, China 2014. [2] Sarwar Shahidi, Md. Abdul Gaffar, Khosru and M. Salim, “Design and implementation of Digital Energy Meter with data sending capability
using GSM network”, Proceedings of 2013 2nd International Conference on Advances in Electrical Engineering (ICAEE 2013), pp.19-21 Dhaka, Bangladesh 2013.
[3] A. Ali, N.A. Razali, N. Vitee, and N.H. Saad,” Implementation of Automatic Meter Reading (AMR) Using Radio Frequency (RF) Module”,IEEE International Conference on Power and Energy(PECon), pp.2-5,Kota KinabaluSabah,Malasiya 2012.
[4] Claudio De Capua, Gianluca Lipari, Mariacarla Lugarà, and Rosario Morello,” A Smart Energy Meter for Power Grids” Instrumentation and Measurement Technology Conference (I2MTC) Proceedings, IEEE International 2014.
[5] Fang Hongping, and Fang KangLing, “The Design of Remote Embedded Monitoring System based on Internet” International Conference on Measuring Technology and Mechatronics Automation, 2010.
[6] Vujovic V, and Maksimovic, M,”Raspberry Pi as a Wireless Sensor Node: Performances and Constraints “,MIPRO 2014, Opatija, Croatia 2014.
[7] Primicanta, A H., NAyan, M. Y., and Awan, M.,“ZigBee-GSM based automatic meter reading system. In Intelligent and Advanced Systems (ICIAS), IEEE International Conference on pp. 1-5, 2012.
[8] ltir Christian D. Bonganay, JosefC. Magno, Adrian G. Marcellana, John Marvin E. Morante, and Noel G. Perez,” Automated Electric Meter Reading and Monitoring System using ZigBee-Integrated Raspberry Pi Single Board Computer via Modbus”, Electrical, Electronics and Computer Science, IEEE Students Conference 1-2, 2014.
[9] Dichko Batchvarov, Kiril Belov, Simeon Angelov, Fikret Calikoglu, Ani Boneva, and Rumiana Krasteva “A Technology for Electronic Energy Meters Intelligent Accounting Using Distributed Database over TCP/IP Network”. Problems of engineering cybernetics and robotics, Bulgarian Academy of Sciences 2004.
[10] Nor‟aisah Sudin, Mohd Zeid Abu Bakar and Mohd Helmy Abd Wahab “Digital Household Energy Meter” 2nd Engineering Conference on
Sustainable Engineering, Infrastructures Development & Management, Kuching, Sarawak, Malaysia,December 18 -19, 2008.
[11] B. S. Koay, S. S. Cheah, Y. H. Sng, P. H. J. Chong, P. Shum, Y. C. Tong, X.Y. Wang, Y.X. Zuo and H. W. Kuek “Design and Implementation of Bluetooth Energy Meter.” Network Technology Research Centre, School of Electronics & Electrical Engineering, Nanyang Technological University, Nanyang Avenue, ICICS-PCMSingapore 15-18September 2003.