P-T LIMIT CURVE OF REACTOR PRESSURE VESSEL
WITH NOZZLE CORNER CRACK
Sang-Yun Park1, Jong-Wook Kim1, Tae-Wan Kim1, Suhn Choi1
1SMART Development Division, Korea Atomic Energy Research Institute, 1045 Daedeok-daero, Daejeon, Korea
E-mail of corresponding author: parksy@kaeri.re.kr
ABSTRACT
Pressure-Temperature limit curve imposes restriction on the maximum pressure and minimum temperature for several operation conditions, based on the principle of linear elastic fracture mechanics, to prevent a non-ductile fracture during the operation of a reactor coolant system(RCS) with ferritic steel. During the process of establishing a pressure-temperature limit curve, the maximum postulated defect is assumed, and the stress intensity factors from various loads acting on the pressure vessel should be evaluated in terms of fracture toughness representing the material's resistance to fracture. In the present study, an evaluation procedure is developed to establish a pressure-temperature limit curve of the nozzle with a corner circular crack for a SMART(System-integrated Modular Advanced ReacTor) reactor pressure vessel using the finite element method. As a result, an impact assessment of the changes of the reference critical stress intensity factor to be applied as an important criterion to produce a pressure-temperature limit curve is provided. Secondly, the stress intensity factors caused by thermal stress and internal pressure were obtained using 3-D FEM, and the effective methodology for the integrity of RPV was verified through a comparison with reference papers.
INTRODUCTION
The calculated stress intensity factor for a specific temperature and pressure must not exceed the fracture toughness in order to keep the integrity of the reactor pressure vessel with the crack. The fracture toughness obtained from the test, as the material property depending on the temperature, shows the material’s resistance to fracture. The resistance to the fracture is weakened by means of the irradiation embrittlement, which increases the strength and hardness of the vessel material, but degrades the ductility. Thus, the reactor pressure vessel needs to be evaluated based on the reference critical stress intensity factor, which is the fracture toughness taking into account neutron fluence and temperature. General requirements of the P-T limit curve concerning pre-service reactors were stipulated in ASME Code Section III, Appendix G, and requirements for in-service reactors were first described in Section XI in 1989. Section XI has been revised, including Code Cases N-588, N-640, and N-641 after that. The
reference critical stress intensity factor, KIR was revised to KIc from ASME Section XI, 1999 Addenda. Also,
ASME Section III became the same as Section XI from the 2007 edition [1,2]. On the whole, these revisions are judged to be an intention to reduce the excessive conservativeness and to produce reasonable results.
The assessment must be performed for various regions of the vessel, and the final P-T limit curves are then determined from the dominant region where the stress intensity factors show higher values. The general assessment procedure required for shell and head regions remote from discontinuities is stipulated in detail in the ASME code. However, the general method is not recommended for regions where discontinuities exist, such as nozzles and flanges, because more complicated stress distributions occur. If the general method is applied to the nozzles and flanges, the usefulness of the results should be checked. Alternatively, a complete and detailed analysis method for a nozzle corner crack is not currently available; only an approximate analysis or some limited methods are available [3]. Therefore, an effective method to evaluate the nozzles and flanges is required.
In the present study, the effects of the changes of the reference critical stress intensity factor are provided from the production of the P-T limit curve for a nozzle area. The stress intensity factors caused by thermal stress and internal pressure were obtained using 3-dimensional FEM by ABAQUS, and an effective methodology for the integrity of RPV was suggested.
PRESSURE-TEMPERATURE LIMIT CURVE
Reference Critical Stress Intensity Factor
Based on the reference nil-ductility temperature, RTNDT, determined in Reg. Guide 1.99 [4], and the critical
I
SA-Transactions, SMiRT 21, 6-11 November, 2011, New Delhi, India Div-I: Paper ID# 446
508-3 steels, ASME Section XI, Appendix G suggests the reference critical stress intensity factors according to the
critical
K
I. The reference criticalK
Icis an analytical approximation by the lower bound of static criticalK
I, andIR
K
is based on the lower bound of the static, dynamic, and crack arrest criticalK
Ivalues.)] 160 (
0145 . 0 exp[ 223 . 1 78 .
26 + − +
= NDT
IR T RT
K (1)
)] (
02 . 0 exp[ 734 . 20 2 .
32 NDT
Ic T RT
K = + − (2)
Ic IR K
K , : reference critical stress intensity factor(ksi in)
T
: crack tip temperature(℉)NDT
RT : adjusted reference temperature(℉)
In the beltline regions, the stress intensity factors calculated from RPV with an axial crack include only
K
Imand
K
It, which are produced by membrane stress and thermal gradient in the radial direction, respectively. In orderto consider the conservatism,
K
Ic orK
IR is compared with KImandK
It in which safety factors 1 and 2 are appliedto as follows:
)
(
2
⋅
K
Im+
K
It<
K
IRor
K
Ic (3)Adjusted
RT
NDTThe calculation of ART for the SA508 reactor vessel is based on the procedures of Regulatory Guide 1.99, Rev. 02. The adjusted reference temperature(ART) for each material in the beltline is given by the following expression:
ART
=
Initial
RT
NDT+
Δ
RT
NDT+
Μ
argin
(4)NDT RT
Initial is the reference temperature for an unirradiated material and
Δ
RT
NDT is the mean value of theadjustment in the reference temperature caused by irradiation. ΔRTNDTis calculated as follows:
) log 1 . 0 28 . 0
( f
NDT CF f
RT = ⋅ − ⋅
Δ , (5)
where CF is the chemistry factor, which is a function of copper and nickel constant. f is the neutron fluence at any
depth in the wall and is determined as follows:
)
1
,
/
10
(
19 2) 24 . 0 (
MeV
E
cm
n
e
f
f
=
surf⋅
x>
, (6)where (1014 / 2, 1 )
MeV E cm n
fsurf > is the calculated value of the neutron fluence at the inner surface of the vessel,
and
x
is the depth of the postulated crack measured from the surface. “Margin” is the quantity, degrees ℉, that is tobe added to obtain conservative, upper-bound values of the adjusted reference temperature for the calculations required by Appendix G of 10 CFR Part 50 [5]. In this paper, ART was calculated for the crack location, base, and weld metal as shown in Table 1.
Table 1 Input data for adjusted reference temperature
Metal locations Crack f InitialRTNDT
(℉)
NDT RT Δ
(℉)
Margin (℉)
ART
(℉)
Base metal Inner surface 8.285E-6 -10 0 50 40.0
Im
K
DetIm
K
where, M
vessel inn include u and size o
where,
a
and σvm
hole in th uniaxial t FEM to
corner, K
Im
K acc
where, θ
hoop stre average crack. Th ermination mcorrespondin m
M is the mem
ner radius, an uncertainty be of the crack. R
a
is the crack lis the membr he flat plate w tension and e
o calculate KI
Im
K need to b
ording to the l
θ are the angle
ess at the sam stress intensit hese results ar
ng to membra
mbrane correc
nd
t
is a vessecause Mm fr
Reference [3]
ength in Fig. rane stress in t with a large rad
equivalent biax
Im for a speci
be calculated a location of the
es defined in me point whe
ty factor, FE
Im K
re compared to
Fig
ane stress is gi
K
Im=
M
mction factor, σ
sel wall thickn om the ASM
suggests calc
K
Im1, Rn is the n
the reactor ve dius. The valu
xial tension. G ific nozzle co according to th
e crack tip as
K
Fig. 1, Mf is
n the crack i
EM avg
m, are calcu
o those in the
g. 1 Schematic
iven as follow
M
m m m⋅
σ
=
m
σ is the me
ness. KIm fro
E Code is ap
ulatingKIm fo
r
a
F
n⋅
σ
=
(
/
)
nozzle radius i ssel shell. Eq
ues of F(a/rn
Gilman and R onfiguration[6
he location of follows[7]:
M
K
Im(
θ
)
=
fs the magnific s absent. In t ulated by usin references me
c illustration o
ws by ASME C
)
/
(
pR
it
m
⋅
,embrane stres m the nozzle pplicable only for the nozzle
a
vmπ
σ
,in Fig. 1, F(a
quation 8 can
)
n are halfway
Rashid[6] prov ]. To evalua f the crack tip.
a
a
a f/
π
π
σ
,cation factor f this paper,
I K
ng the 3-D fin entioned abov
of nozzle corn
Code Section I
ses,
p
is thecorner zone a for condition as follows:
) /rn
a are facto
be adopted by y between the vided the appr ate more accu
. Mohamend a
for the front f ) (θ
FEM
Im depen
nite element m ve.
ner crack
III.
internal pres applied to equ ns with the sp
ors defined in y assuming a e values for on
roximateF(a
urate integrity and Schroeder
free surfaces, nding on the a model with a
(7)
ssure, Ri is a
uation (7) may pecified shape
(8)
reference [4] nozzle for the ne crack under
)
/rn by using
at the nozzle r[7] published
(9)
and σais the
Transactions, SMiRT 21, 6-11 November, 2011, New Delhi, India Div-I: Paper ID# 446
It
K
DeterminationThe ASME suggests equations that can calculate KIt as a function of temperature change rates and section
thickness regardless of the specified time. However, this method may be quite conservative since it does not consider the effect of the thermal gradient due to time transient but rather the maximum thermal gradient. Also, this method is valid only as long as the thermal gradient meets the figure depicted in ASME. For a nozzle corner, this condition is not met since the stress distribution is very complicated. ASME Code Section III, 2004 recommends an alternative method to use the maximum bending stress produced by the radial thermal gradient. The maximum bending stress method is as follows:
tb tb It
M
K
=
×
σ
(MPa m), (10)where Mtb is a bending correction factor defined as 2/3Mm and σtb is the maximum bending stress by the thermal
gradient. In this study, KIt are calculated using 3D-FEM and the maximum bending stress method and the results of
the two methods are compared to each other. The 3-D FEM method requires more complex tasks but has an advantage in that it considers the time transient.
From the results of KIm , KIt , and the evaluation in Eq. (3), the allowable pressure for any specified
temperature at the depth of the postulated defect during service conditions is determined. The allowable pressure-temperature relationship for the inside surface crack under a heat-up condition is determined from following
equation(KIt =0) as membrane stresses are compressive at the inner surface.
⎟⎟ ⎠ ⎞ ⎜⎜ ⎝ ⎛ =
i m
Ic IR
R t M
K or K P
2 )
( (11)
On the other hand,
K
It of the outer surface crack for a heat-up condition, and the inner surface crack for acool-down condition are calculated, and the minimum pressure at any specified temperature is determined as follows:
⎟⎟ ⎠ ⎞ ⎜⎜ ⎝ ⎛ − =
i m
It Ic IR
R t M
K K or K P
2 )
( , (12)
Ic
K or KIR is calculated from Eq. (1, 2) using the temperatures at the crack tip, and RTNDT values at the
corresponding locations of interest.
FINITE ELIMENT ANALYSIS
All stress intensity factors produced by external loads are analyzed using a 3-D FEM with crack models, and the pressure-temperature limit curve is then determined according to the reference critical stress intensity factors. The postulated cracks are located at the nozzle corner showing the highest stress distributions and have a depth of one-tenth of the section thickness with a 1/4 circular shape, as in Fig. 1. The postulated defect at the 300 mm section is assumed since the sections of the nozzle corner are greater than 300 mm in thickness. The inner radius of the reactor vessel is 2,672 mm, and the section thickness is 325 mm. According to previous studies for the beltline, the P-T limit curve is dominated by a cool-down condition rather than a heat-up condition. Thus, only cool-down conditions are evaluated in this paper. Although there are various temperature rates during the cool-down process,
rates of5.6℃/hr, 22.2℃/hr, 33.3℃/hr, 45℃/hr, and 55.6℃/hr were considered for the analyses.
Elastic analysis is performed using a commercial program ABAQUS v.6.9, which can consider the strain singularity. Figure 2 shows the typical 3-dimensional finite element model used in this paper. 20-node iso-parametric brick elements with reduced Gauss integration are used, and quarter point crack tip singular elements are considered for the crack tip region. Due to the symmetry, only 1/16 of the pressure vessel was modeled. Each stress intensity factor is calculated at all crack points from the vessel surface. For a cool-down condition, thermal stress
pressure is then calculated. Finally, Mmis obtained from Eq. (10) and KIm. Table 2 shows the analysis matrix for
the P-T limit curve calculation performed in this paper.
Fig. 2 3-dimensional FE model
Table 2 Analyses matrix for P-T limit curve
Operation condition Heat up (℃/hr) Cool-down (℃/hr)
Temp. rate Analysis
location
5.6 22.2 33.3 45 55.6 5.6 22.2 33.3 45 55.6
Nozzle inner corner zone
(t/10) ⅹ ⅹ ⅹ ⅹ ⅹ ○ ○ ○ ○ ○
RESULTS
Im
K by Internal Pressure
Figure 3 shows the results of KImaccording to the circular angle from the vessel inner surface to the nozzle inner
surface when the internal pressure of 17MPa is applied. The maximum KIm is shown at the nozzle’s inner surface.
The KIm curve for the circular angles is close to a quadratic function except the values at the vessel inner surface
and nozzle inner surface. This tendency agrees well with the results obtained by Mohamed’s [7] equation. The KIm
curve for the circular angles is fitted as a 2nd order polynomial curve, which is not valid whereθis 0 and 90 degrees.
2
009
.
0
719
.
0
017
.
97
−
θ
+
θ
=
ImK
, (13)where, θ is the circular angle from the vessel’s inner surface as shown in Fig. 1. The averaged stress intensity factor,
avg Im
K , and F(a/rn) , obtained using finite element analysis at each crack tip are compared with the reference
results, as shown in Table 3. The results show good agreement with those of Rashid [6] and Mohamed [7]. However
the results of a flat plate model give 17% higher F(a/rn) and KIm,avg values than the finite element method. The
Transactions, SMiRT 21, 6-11 November, 2011, New Delhi, India Div-I: Paper ID# 446
conservatively the P-T limit curve, substituting the maximum KIm, 113.8MPa m, obtained from the finite element
analysis into Eq. (7) gives correction factor, FEM
m
M =0.81 m.
0 15 30 45 60 75 90 0 20 40 60 80 100 120 140
Maximum KIm = 113.8 MPa m0.5
FEM result
FEM Fit curve except 0 and 90 degree Mohamed result
Mohamed Fit curve except 0 and 90 degree
ST RES S I N T E NS IT Y F A CT O R (MP a m 0.5 )
CIRCULAR ANGLE (θ)
Fitted Max. KIm = 105.2 MPa m
0.5
Nozzle wall Vessel wall
Fig. 3 Comparison of KIm with reference.
Table 3 Comparison of F(a/rn)and KIm,avgwith the reference
FEM results Ref.[3] WRC Bullutin 175 Ref.[6]
Rashid MohamedRef.[7] ASME
) / (a rn
F 1.96 2.3 1.95 1.86 ×
avg KIm,
(MPa m) 88.8 104.3 88.4 84.2 121.3
It
K by Thermal Stress
According to the cool-down rate, Fig. 4 shows the KIt results of the ASME and finite element analysis at the
crack tip of the 45 degrees from the vessel inner surface.
0 50 100 150 200 250 300 350 400
0 10 20 30 40 50 60 70 KIt (M Pa m 0.5 )
Indicated Temperature (oC)
ASME 2004, CR= 55.6 o c FEM-KIt at 45o
, CR= 55.6 o c ASME 2004, CR= 45 o
c FEM-KIt at 45o
, CR= 45 o c ASME 2004, CR= 33.3 o
c FEM-KIt at 45o
, CR= 33.3 o c ASME 2004, CR= 22.2 o
c FEM-KIt at 45o
, CR= 22.2 o c ASME 2004, CR= 5.6 o
c FEM-KIt at 45o
, CR= 5.6 o c
0 50 100 150 200 250 300 350 400 0 10 20 30 40 50 60 70
Max. KIt, CR= 55.6 o c Avg. KIt, CR= 55.6
o c Max. KIt, CR= 45
o c Avg. KIt, CR= 45
o c Max. KIt, CR= 33.3 o c Avg. KIt, CR= 33.3
o c Max. KIt, CR= 22.2
o c Avg. KIt, CR= 22.2
o c Max. KIt, CR= 5.6
o c Avg. KIt, CR= 5.6
o c KIt (MPa m 0. 5 )
Indicated Temperature (oC)
Among all the cool-down rates, 55.6 ℃/h gives the most severe KIt according to the indicated temperature,
and the ASME method provides 31% higher number of KIt than FEM under a cool-down of 55.6 ℃/h. These
differences come from the limitation of the ASME Code based on the continuity vessel wall with a crack depth of t
/4. Therefore, it may not be reasonable to apply KIt obtained by the ASME method to the P-T limit curve. Figure 5
shows the maximum and averaged KIt obtained by the finite element method. As withKIm, a maximum KItcurve is
used to conservatively evaluate the P-T limit curve.
Figure 6 illustrates the effects of the reference critical stress intensity factors derived by substituting KIm, KIt
and adjusted
RT
NDT into Eq. (12). The cool-down curve moves to the right and restricts the operating range as thecool-down rate increases. According to the revised reference critical stress intensity factor, KIcleads to 46℃ more
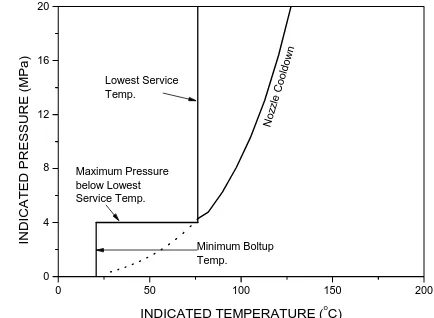
alleviated operating condition than KIR for the design pressure. Figure 7 and 8 show the final P-T limit curves for
IR
K and KIc, respectively. The minimum bolt-up temperature, lowest service temperature (LST) and maximum
pressure below LST out of the P-T limit curves are evaluated by the ASME Code.
0 40 80 120 160 200
0 4 8 12 16 20
INDICAT
ED PR
ESSURE
(MPa
)
INDICATED TEMPERATURE (oC)
Cooldown rate
K IR, CR=55.6
o C/hr, KIa K
IR, CR=45 o
C/hr, KIa K
IR, CR=33.3 o
C/hr, KIa KIR, CR=22.2
o C/hr, KIa
KIR, CR= 5.6 o
C/hr, KIa
KIC, CR=56.6 o
C/hr, KIc
KIC, CR=45 o
C/hr, KIc KIC, CR=33.3
o C/hr, KIc KIC, CR=22.2
o C/hr, KIc KIC, CR= 5.6
o C/hr, KIc
46 o C
Fig. 6 P-T limit curve for cool-down.
0 50 100 150 200
0 4 8 12 16 20
Noz zle
Coo ldow
n
IN
DIC
AT
ED PR
ESS
U
R
E
(M
Pa)
INDICATED TEMPERATURE (oC)
Lowest Service Temp.
Minimum Boltup Temp.
Maximum Pressure below Lowest Service Temp.
0 50 100 150 200
0 4 8 12 16 20
No zzle
Co old
ow n
Lowest Service Temp.
Minimum Boltup Temp.
INDICAT
ED PR
E
SSUR
E
(MPa)
INDICATED TEMPERATURE (o
C)
Maximum Pressure below Lowest Service Temp.
Transactions, SMiRT 21, 6-11 November, 2011, New Delhi, India Div-I: Paper ID# 446
CONCLUSION
The results of this study are as follows. First, the impact assessment for the changes of the reference critical stress intensity factor, to be applied as important criteria to produce a pressure-temperature limit curve, is provided. Second, the stress intensity factors caused by thermal stress and internal pressure were obtained using a 3-D FE analysis by ABAQUS, and the validity of the suggested methodology was verified, as the results through FEM show
good agreement with the reference results. KIm, obtained by the flat plate model and ASME method were over 17%
higher than the finite element method, and KIt was 31% higher than the finite element method. Therefore, applying
the flat plate model and general ASME method to the P-T limit curve is more likely to result in a conservative evaluation.
ACKNOWLEDGEMENTS
This work was supported by the Ministry of Education, Science and Technology (MEST), Republic of Korea
REFERENCES
[1] ASME Boiler and Pressure Vessel Code Section III, "Protection Against Nonductile Failure," Appendix G, The American Society of Mechanical Engineers, 2004.
[2] ASME Boiler and Pressure Vessel Code Section III, "Fracture Toughness Criteria for Protection against Failure," Appendix G, The American Society of Mechanical Engineers, 2007.
[3] WRC Bulletin 175, "PVRC Recommendations on Toughness Requirements for Ferritic Materials," Welding Research Council, 1972.
[4] Regulatory Guide 1.99 Rev.2, "Radiation Embrittlement of Reactor Vessel Materials," U.S. Nuclear Regulatory Commission, 1988.
[5] Code of Federal Regulations, 10 CFR Part 50, "Reactor Vessel Material Surveillance Program Requirements," Appendix H, U.S. Nuclear Regulatory Commission, 1998.
[6] Gilman, J. D. and Rashid, Y. R., "Three-Dimensional Analysis of Reactor Pressure Vessel Nozzle," Conference on Structural Mechanics in Reactor Technology, 1971.
[7] Mohamed, M. A and Schroeder, J., "Stress Intensity Factor Solution for crotch-corner cracks of