©
DOI: 10.1534/genetics.104.031500
Adding Confidence to Gene Expression Clustering
B. Munneke,*
,1K. A. Schlauch,
†,1K. L. Simonsen,*
W. D. Beavis
‡and R. W. Doerge*
,§,2*Department of Statistics, Purdue University, West Lafayette, Indiana 47907,†Center for Biomedical Genomics and Informatics, George Mason University, Manassas, Virginia 20110,‡National Center for Genome
Resources, Santa Fe, New Mexico 87505 and§Department of Agronomy, Purdue University, West Lafayette, Indiana 47907
Manuscript received May 21, 2004 Accepted for publication April 25, 2005
ABSTRACT
It has been well established that gene expression data contain large amounts of random variation that affects both the analysis and the results of microarray experiments. Typically, microarray data are either tested for differential expression between conditions or grouped on the basis of profiles that are assessed temporally or across genetic or environmental conditions. While testing differential expression relies on levels of certainty to evaluate the relative worth of various analyses, cluster analysis is exploratory in nature and has not had the benefit of any judgment of statistical inference. By using a novel dissimilarity function to ascertain gene expression clusters and conditional randomization of the data space to illuminate distinctions between statistically significant clusters of gene expression patterns, we aim to provide a level of confidence to inferred clusters of gene expression data. We apply both permutation and convex hull approaches for randomization of the data space and show that both methods can provide an effective assessment of gene expression profiles whose coregulation is statistically different from that expected by random chance alone.
M
ICROARRAY technology has been applied exper- differential expression and/or summarizing gene ex-imentally across many biological disciplines; some pression profiles by assessing similarities in their pattern of the earliest examples in agriculture used expressed of behavior across treatments or conditions. The statisti-sequence tags (ESTs) in studies of plant gene expression cal issues (e.g., statistical models, hypotheses, multiple (Ewinget al.1999). Similarly, in human studies, cDNA comparisons, etc.) involved in testing differential ex-microarray data have been used as the vehicle for the pression have been investigated more thoroughly (see investigation of biologic variation in mammary epithe- review byCraiget al.(2003)) than those statistical issues lial cells among breast tumor samples (Perouet al.1999). surrounding the statistical assessment of gene expres-The evolutionary biology of yeast was studied using micro- sion profile patterns and their clustering (Zhang and array techniques to compare genome-wide expression Zhao2000;KerrandChurchill2001;Munneke2001; patterns in evolvedvs.parental strains after 250 genera- Tibshiraniet al.2001;McShaneet al.2002).tions of growth (Fereaet al.1999). Since its initial im- In efforts to understand the underlying data struc-pact the use of microarray technology now includes much ture resulting from expression studies, data are typically broader investigations of regulatory science (Doerge summarized by grouping the expression intensities via 2002;Cheunget al.2003;Schadtet al.2003;Bremand similarity of response to various experimental conditions. Kruglyak2005;Kimet al.2005;Ronaldet al.2005) and Statistical methodologies that supply these groups, or reconstruction of genetic networks (Knudsen 2002). clusterings, of gene expression profiles are known as Microarray technologies allow researchers to simulta- clustering techniques and originate from a well-estab-neously monitor cellular activity of many gene transcripts.
lished area of statistics referred to as multivariate sta-These experiments produce mRNA expression data in
tistics (Johnson and Wichern 1998). The clustering great abundance and provide useful information to
pur-methods involved in the previously mentioned studies sue the conjectures of functional genomics. Two
differ-tend to be either partition based, such asK-means clus-ent approaches for analyzing these data, both of which
tering (Tavazioeet al.1999) and self-organizing maps rely heavily on statistics, include testing each gene for
(Tamayo et al. 1999), or nested, as with hierarchical clustering (Eisenet al.1998). Regardless of the cluster-ing method used, an assignment of statistical
signifi-1These authors contributed equally to this work.
cance for the resulting partitions is necessary to
inter-2Corresponding author:Department of Statistics, 1399 Mathematical
pret cluster reliability and biological meaning (Zhang
Sciences Bldg., 150 N. University St., Purdue University, West
Lafay-ette, IN 47907-1399. E-mail: [email protected] andZhao2000;KerrandChurchill2001;McShane
et al.2002). Several such approaches have been devel-oped.KerrandChurchill(2001) present a bootstrap-ping technique to assess the stability of profile clusters. Genes are assigned to a set of fixed profiles via their correlation; a correlation coefficient ⬎0.90 is enough to assign two profiles to the same cluster. Bootstrapping is then employed to assess stability of a gene by counting how many times it is assigned to the same fixed profile. ZhangandZhao(2000) also use bootstrapping to gen-erate perturbed data sets. Their reliability measure de-pends on the number of times genes occur in the set of perturbed clusters.McShaneet al.(2002) present a principal components analysis to assess the overall clus-tering of expression patterns and then test whether gene
Figure 1.—Three expression profiles (YBR148W, YDR
expression profiles arise from a single multivariate
nor-260C, and YKL166C) from the yeast sporulation (Eisenet al. mal distribution. New data sets with artificial
experimen-1998) data set. Denoting Pearson’s correlation coefficient as
tal error are generated by adding Gaussian white noise cor, cor
(YBR148W,YDR260C) ⫽ 0.991, cor(YDR260C,YKL166C) ⫽ 0.998, and to the original expression levels. Two reproducibility in- cor(YBR148W,YKL166C)⫽ 0.993, rendering all three profiles essen-dexes are associated to each cluster by computing the tially identical. The Munneke metric (1) provides the dissimi-larity measured(YBR148W,YDR260C)⫽1.77,d(YDR260C,YKL166C)⫽1.58, and number of pairs existing in both the original and the
d(YBR148W,YKL166C)⫽1.97. perturbed cluster. A perturbed cluster is matched to
the original cluster if it contains a majority of elements in common with the original cluster.
various developmental time points or treatments, for a
ttreatment experiment a single gene will have at -dimen-sional observation vector known as its gene expression
CLUSTERING
profile. A dissimilarity measure in this setting is a real-valued function that, for any two expression vectors, Agglomerative hierarchical clustering (Hartigan1975;
assigns a nonnegative real number denoting the dissimi-Gordon 1999) is a technique that is both familiar to
larity between them. In this work, we introduce a dissimi-biologists and widely used in reporting groups of
coregu-larity measure that takes into account both magnitude lated genes. It produces an easy-to-interpret clustering
and pattern of gene expression. Typically, expression tree (dendrogram), provided the number of genes or
studies employ measures that depend on either the pat-treatments is small. A dendrogram is a visual
representa-tern or the relative magnitude of profile pairs. Our dis-tion of data points or gene expression profiles as merged
similarity measure, also known as the Munneke metric, together from isolated points toward increasingly larger
subgroups. As a general rule, in the process of
agglomer-ating the subgroups, once two items are associated to dij ⫽
冢
1⫺gi ·gj
gi gj
冣
⫹2冢
(1/t)
兺
tk⫽1|gik⫺gjk| 1⫹ (1/t)兺
tk⫽1|gik⫺gjk|
冣
, a subgroup, they remain in the same subgroup as the(1) number of subgroups grows larger. The continued
ag-glomeration of subgroups defines the nesting property takes into account both notions. Its first term provides of hierarchical clustering, and it is this property that a notion of dissimilarity via the uncentered correlation aids interpretation of the results. The mechanics of hier- coefficient, which measures similarity of profile patterns. archical clustering require two important and sensitive The second term adds a measure of difference in magni-specifications: a dissimilarity, or distance, measure and tude between pairs, based on the average distance be-a joining, or be-agglomerbe-ative, method. tween paired expression levels across all experimental All clustering methods when applied to gene expres- states. Defined as such, the dissimilarity measure is able sion data depend on a dissimilarity measure,dij, in such to differentiate profiles of the same pattern, but at differ-a wdiffer-ay thdiffer-at for two genesgiandgjthe measure obeys three ent intensity levels, which we believe is a biologically properties (1–3), while a true distance measure also important feature of a metric.
satisfies a fourth (see,e.g.,JohnsonandWichern1998): As an example, consider the three gene expression profiles in Figure 1, taken from theEisenet al.(1998) 1. dijⱖ 0.
yeast sporulation data set. Letting cor denote Pearson’s 2. dii⫽ 0.
correlation coefficient, we have cor(YBR148W,YDR260C)⫽0.991, 3. dij⫽ dji.
cor(YDR260C,YKL166C)⫽0.998, and cor(YBR148W,YKL166C)⫽0.993, ren-4. dikⱕ dij⫹ djk.
38.55, implying that gene YBR148W is more similar or real (Good 2000). At some branch point it is ex-pected that no further distinct subgroup structure will to YDR260C than to YKL166C, a result that does not
agree with the correlation coefficient result. Employ- exist, and that the existing structure will not differ from a random distribution of gene expression profiles. As ing the Munneke metric (1) on these same data yields
d(YBR148W,YDR260C) ⫽ 1.77, d(YDR260C,YKL166C) ⫽ 1.58, and such, subsequent branches or subclusters will have no statistically significant meaning.
d(YBR148W,YKL166C)⫽1.97. While the correlation coefficient
between the two pairs is almost identical, the Munneke Two main features are involved in our proposed method of placing a level of certainty on branches of a clustering metric (1) is able to differentiate the two pairs with
respect to relative magnitude, which we believe to be a tree. The first is the creation of a random representation of the actual expression profiles. The second is a test more intuitive measure of dissimilarity. We realize that
many penalty terms can be used (Gordon1999), but statistic that summarizes the existing cluster tree struc-ture, whether from the actual data or from the random-we restrict our attention to the described penalized
dis-similarity measure (1) as it distinguishes between in- ized data. Randomization of gene expression informa-tion in this context is accomplished using two different duced and repressed gene expression of the same
mag-nitude. methods: permutation tests and convex hulls.
Permuta-tion tests (Fisher1935) have been successfully employed The joining method complements the dissimilarity
mea-sure and is chosen from three of many possible methods; in the quantitative trait loci (QTL) literature (Church-illandDoerge 1994; Doerge andChurchill1996; nearest neighbor (single linkage), farthest neighbor
(com-plete linkage), and average linkage (Gordon1999). Using NettletonandDoerge2000) to establish experimen-tal thresholds for declaration of statistically significant any measure, the dissimilarity between two groups is
as-sessed by considering all pairs of genes formed by taking QTL. The application of permutation methods to gene expression data is analogous to the QTL application in one member of each group. Throughout this work we
concentrate on agglomerative hierarchical clustering and that individual expression measures that are related (as-sociated) through coregulation will lie in the same clus-employ the Munneke dissimilarity measure (1) with these
joining methods. ter. However, in certain circumstances (discussed later) permutation methods are less effective in randomizing The amount of random variation found in gene
expres-sion studies is known to have numerous sources (Knud- the data space, and a convex hull (Barberet al.1997) approach is employed as an alternative. Finally, a test sta-sen2002;Craiget al.2003). Given the lack of ability to
discriminate how this variation affects clustering results, tistic is required for the purpose of measuring the amount of structure present in a dendrogram via a single num-users of clustering algorithms are growing increasingly
careful in interpreting their results. Furthermore, be- ber. This statistic distinguishes between the data sets with-out structure (i.e., reflecting a randomized data space) cause the technology is expensive, there is also a desire
to compare the results across laboratories and experi- and the original data space. The underlying goal is to calculate a statistic that complements the dissimilarity ments. Ideally, this comparison should be possible at the
level of cluster analysis, independent of the algorithm, measure used to create the dendrogram while clearly distinguishing between random gene expression pro-dissimilarity function, or joining method. Our purpose
in this work is to rely on the penalized dissimilarity mea- files and clusters and gene expression data that demon-strate true associations.
sure (1) and to place a level of confidence on the
group-ings suggested by hierarchical clustering (or any other Randomization:Permutation method:Consider the gene expression data to be real-valuedt-dimensional vectors, clustering algorithm). Our focus is not on the clustering
mechanism itself, but rather on deriving a statistical one dimension for each treatment in the experiment. The data vectors represent specific gene expression lev-assessment of significance as one traverses down the
branches of a hierarchical clustering tree. In essence, els recorded under each of thettreatment conditions. The random gene expression profiles (or the permuted we propose a comparison of the original data with a
randomization of the data space (i.e., no association data) are constructed by focusing on one treatment at a time and sampling without replacement from this between the expression profiles) for the purpose of
as-sessing how probable any given cluster is to have oc- treatment for every expression observation (gene). Via the permutation, the value of each expression profile curred by chance, thus providing researchers with a
baseline for comparing results independent of the clus- is equally likely to be any one of the set of all values ob-served for that variable over the course of the original tering algorithm used.
experiment. Thus, under the null hypothesis, a random permutation represents an outcome that is as likely to
METHODS
have been observed as the original data, without para-metric assumptions of data structure. Furthermore, the Clustering methodologies operate on objects in a
bi-nary fashion such that each operation separates a group permutation method also allows for any inherent associ-ation between individual profiles to be broken. While into two distinct subgroups. Here, we utilize
Figure3.—Permuted data set using permutations only: a
Figure2.—Original data set: gene expression profiles for
single randomization of the 58 distinct gene profiles using 58 yeast genes across seven temporal states. These data are part
permutation. of a larger publicly available gene expression experiment of
6118 genes. (http://cmgm.stanford.edu/pbrown/sporulation/ additional/spospread.txt).
data, lie within the convex hull of the original data set
G. To generate data sets with boundaries identical to data set, repeating this processntimes creates a
collec-those of the original data, the null model data sets are tion ofnrandom data sets, each potentially representing
generated to be within the convex hull of the original an experiment having no inherent structure among its
data values, by representing new elements as random data points.
linear combinations of original elements. Permutation techniques for null model generation
Permutationvs.convex hull:As mentioned previously, are easy to implement and aim to remove much of the
it is sometimes the case that the permutation approach association between gene expression profiles (i.e.,
coreg-alone (without the convex hull) generates random data ulation). Not all data sets can be associated with
permu-sets with subcluster structure. Consider the gene expres-tations without cluster structure: even after permuting
sion profiles of 58 yeast genes across seven temporal states the original data up to 10,000 times it is possible, and
as shown in Figure 2. These data are part of a large public has been seen, that the randomized data retain a looser
gene expression experiment of 6118 yeast genes under-cluster structure. We have found that some gene
expres-going sporulation (http://cmgm.stanford.edu/pbrown/ sion data are aligned in the data space in a manner that
sporulation/additional/spospread.txt). A single random prohibits permutation from randomizing the data space
data set generated by permutations alone is shown in efficiently, e.g., a group of expression vectors forming
Figure 3, and one generated using the convex hull ap-a long thin cloud (i.e., cigar shaped) in two-dimensional
proach is shown in Figure 4. We believe that the convex space. We are motivated to provide a null data set that
hull approach is more reliable than the permutation ap-has little or no cluster structure, but is still contained
proach in generating data sets without subcluster struc-within the boundaries of the original data. For this, we
ture for original data in which strong cluster structure introduce an alternate approach of randomly mixing
exists. In such cases, artificial/permuted data generated gene expression vectors within their convex hull.
by permutations will tend to retain some, if not all, of
Convex hull:The convex hull of a setGofmgene
ex-the original subcluster structure. Consider ex-the example pression vectors in Rtis the smallest convex set in Rt
of Figure 2, in which each expression vector belongs to containing allmvectors and is defined as
one of two clusters. For each experiment, except the
CG⫽
冦
兺
mi⫽1
aigi|
兺
mi⫽1
ai ⫽1,aiⱖ 0
冧
first at time 0, the set of possible values is divided into two distinct sets. Thus, the permuted value for each ex-periment will belong to one of these two distinct sets, (Brøndsted1983). Randomly generating elements withingenerating expression vectors that lie within one of
CGprovides a random distribution of points within the
64⫽26possible distinct clusters, as is demonstrated in hull. Therefore, the null distribution of a test statistic
Figure 3. Alternatively, the convex hull approach first (described later) that is used to assess the resulting
den-generates two random numbers in [0, 1] and then con-drogram can be generated by performing the clustering
structs new profiles via linear combinations of original procedure on the n convex hull generated data sets.
profiles using the two random numbers, making it un-Observe that elements defined by
likely that the new profile will lie exactly within one of {xnew⫽ xi⫹(1 ⫺ )xj;僆 [0, 1],i⬆j},
the original two clusters.
Figure5.—The test statistic SLB is calculated as thesum of the branchlengthsbelow the parent branch point and is a function of the penalized distance measure and the agglom-eration method.
Figure4.—Convex hull permutation: a single
randomiza-whereDmax,Dmin, andDavecorrespond to the nearest neigh-tion of the 58 distinct gene profiles using the convex hull
approach. bor (single linkage), farthest neighbor (complete
link-age), and average linkage agglomerative methods, re-spectively. Note that the SLB statistic can be used with architecture within any given gene expression experi- any agglomerative method.
ment or randomized data set, we construct a test statistic The cluster of genesGis partitioned into the child sub-based upon the sum of the branch lengths of a cluster groupsG0andG1,i.e.,G⫽G0傼G1. To calculate the test dendrogram. The distribution of the test statistic under statistic we denote the partitions of G0 and G1 by ex-the null hypoex-thesis is estimated and used to establish tending our notation,
statistically significant results in the original gene
expres-G⫽(G00傼G01)傼(G10傼G11). sion data when compared to the null distribution. The
clusters being tested at each stage are provided by the The test statistic is calculated as (hierarchical) clustering of the original data, based upon
SLB⫽(D*(G0,G1)⫺D*(G00,G01)) our penalized dissimilarity measure (Munneke metric)
(1) and one of the joining methods mentioned previ- ⫹(D*(G0,G1)⫺ D*(G10,G11)), ously. Consider Figure 5, noting that for each branch
whereD*corresponds to the user-selected agglomerative in the dendrogram a left child subgroup and a right
method. child subgroup exist. The sum of branch lengths is
calcu-Implementation: Using the SLB test statistic, we ap-lated as a function of the sum of the differences between
proach a clustering tree one branch point at a time. the last join,D0, and each of the last joins for the child
Starting from the top, SLB is calculated for the first clusters,D1 andD2 (Figure 5). The distribution of the
branch point, which divides the total set of gene
expres-sum of thebranch lengths below (SLB) the parent node
sion profilesG into two subgroups G0 and G1. Recall under the null hypothesis is used to assess the statistical
that the original data set has a representation in the significance of the original data dendrogram. SLB
fo-form of a dendrogram as does each of the randomized cuses on the dissimilarities provided in the clustering
data sets. Therefore, the statistic (SLB) is calculated for of the data for the purposes of assessing the subgroup
the original data, as well as for each of the random data structure and avoiding criteria such as sum-of-squares.
sets. If the statistic calculated for the original data is We define the SLB statistic using both a dissimilarity
large (i.e., exceeds the 1⫺ ␣percentile) relative to the measuredand an agglomerative methodDas required
distribution of SLB under the null hypothesis, this sug-by hierarchical clustering. Three standard
agglomera-gests that the original data space has a stronger sub-tive methods are defined as
group structure than would be expected from a random
Dmax⫽max{dij|gi 僆G0,gj僆 G1} association of gene expression profiles. The statistically significant subgroup structure is then accepted for this
Dmin⫽min{dij|gi 僆G0,gj僆 G1}
branch point, a probability (P- value) is assigned, and the algorithm continues by operating on each of the two
Davg⫽ 1
ninj
兺
ni i⫽1兺
nj j⫽1
dij, forgi僆G0,gj僆G1,
TABLE 1
Number of clusters found
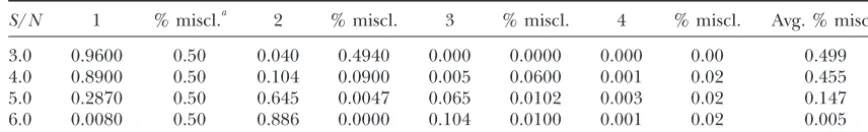
S/N 1 % miscl.a 2 % miscl. 3 % miscl. 4 % miscl. Avg. % miscl.
3.0 0.9600 0.50 0.040 0.4940 0.000 0.0000 0.000 0.00 0.499
4.0 0.8900 0.50 0.104 0.0900 0.005 0.0600 0.001 0.02 0.455
5.0 0.2870 0.50 0.645 0.0047 0.065 0.0102 0.003 0.02 0.147
6.0 0.0080 0.50 0.886 0.0000 0.104 0.0100 0.001 0.02 0.005
Results of signal/noise (S/N) simulation.S/N⫽|1⫺ 2|/; |1⫺ 2|⫽3.0, 4.0, 5.0, 6.0; and ⫽1.0. Data are simulated for two gene clusters of an increasing signal-to-noise ratio. These results display one (1), two (2), three (3), and four (4) clusters, where two clusters is the correct resolution.
aPercentage of misclassification.
that each additional partitioning of the data is condi- tion and each method, and then 1000 random test statis-tics were used to estimate the null distribution for the tional on acceptance of the partition for the preceding
branch point. The algorithm self-terminates when all permutation method and the convex hull method. Each decision in the cluster process was based on a signifi-branch points below valid partitions in the original data
set are found not to be statistically significant. If further cance level␣ ⫽0.05. The number of significant clusters and the misclassification rate were based on 1000 repeti-investigation is desired below a specific subgroup, then
the algorithm can be reinitiated beginning at the parent tions of this process (Table 1).
Simulation results:Each simulation resulted in a num-node of this subgroup.
ber of significant clusters (ranging from 1 to 100) for each data set. As the data were simulated under the
DATA ANALYSIS assumption of two known clusters, any number of
sig-nificant clusters different from two is incorrect. The Simulation:As a means of assessing the power of both
degree of incorrectness of a cluster analysis, in this con-randomization methodologies, we first relied on data
sim-text, is the percentage of genes misclassified (i.e., a gene ulation. Hierarchical clustering routines HC and HCASS2
profile is assigned to a cluster different from the cluster (Fionn Murtagh at Universite´ Louis Pasteur, Strasbourg,
from which it was simulated). The percentage of misclas-http://newb6.u-strasbg.fr/fmurtagh//mda-sw/) were
em-sification is the maximum overlap between two of the ployed along with a standard uniform random number
discovered clusters and the known true generating clus-generator for permutation. Normal random variates
ters. For example, if the two true clusters areG1⫽{1, were produced by the Box-Mueller transformation of
. . . , 50} and G2 ⫽ {51, . . . , 100}, and the discovered uniform variates, and two distinct multivariate groups
cluster is Gdisc.1 ⫽ {1, . . . , 100} then 50% of the genes with 50 observations (genes) in each group, at three
are misclassified. If the discovered clusters areGdisc.1⫽ treatments (or dimensions), were simulated. The
dis-{1, . . . , 48},Gdisc.2⫽{49, . . . , 94}, andGdisc.3⫽{95, . . . , tance between the two groups was measured by a
signal-100}, then 8% of the genes are misclassified. A perfect (expression intensity) to-noise (variation) ratio. For
ex-scenario (for this simulation), as the signal-to-noise ratio ample, in one dimension the signal-to-noise comparison
increases, maintains 100% of the simulations as having gives an indication of the level of separation for the
two distinct clusters with 0% misclassification. In fact, means of the two distributions defining the gene
clus-we find that the average misclassification tends to 0.0, ters. As such, in one dimension, the signal-to-noise ratio
indicating no misclassification, as the true separation can be calculated as |1⫺ 2|/for two normal
distribu-between the two generating clusters tends to infinity. tions with means1and2, respectively, and a common
Because our simulation study was based upon two three-standard deviation. The distance between the two
mul-dimensional gene expression clusters, we allowed the tivariate groups was measured using the average
signal-signal-to-noise ratio to increase in a stepwise manner to-noise ratio for each of thet(treatment) dimensions,
from 3.0 to 6.0, while the variance remained at 1.0. calculated as
Only the results for the permutation randomization are shown in Table 1. For both randomization methods, as 1
t
兺
t
k⫽1
|1k⫺ 2k|
the signal-to-noise ratio increases the ability to identify statistically significant gene clusters increases. The aver-and tested at four different (|1 ⫺ 2|) distances (3.0, age percentage of the observations misclassified reflects 4.0, 5.0, and 6.0). For each original simulated data set an increase in the power of the test as the dissimilarity 1000 randomizations of the data set were performed between the clusters becomes larger.
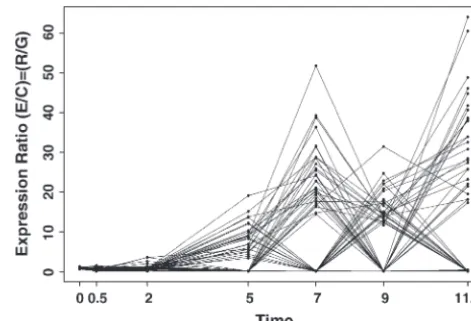
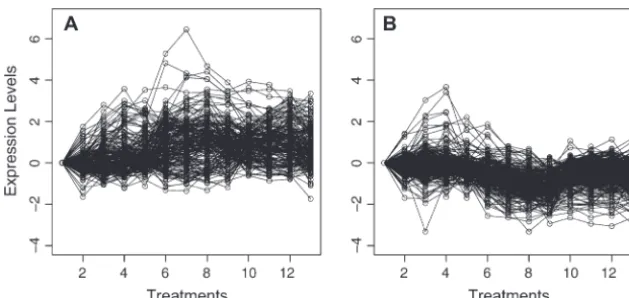
randomiza-Figure6.—The two gene cluster subgroups resulting from the analysis of the original se-rum data (Iyer et al. 1999), using average linkage, the cosine of the angle distance mea-sure, and␣ ⫽0.05. (A) Group 1 expression profiles, average link. (B) Group 2 expression profiles, average link.
with serum (Iyer et al.1999). These data were used to and repressed gene expressions is not of concern for these data.
create the cluster dendrogram inIyer et al.’s (1999)
The final analysis was performed using the Munneke Figure 2. This figure is available at http://genome-www.
metric (1) and the complete linkage agglomeration stanford.edu/clustering/Figure1.jpg and the data are
method. We chose the complete linkage method be-available at http://genome-www.stanford.edu/serum/
cause it gives the highest resolution of 517 serum genes data.html. The data consist of measurements of mRNA
into clusters when the significance is increased to␣ ⫽ present at 13 time points following the treatment with
0.15. Nine cluster subgroups result (Figure 7), high-serum. The clustering inIyeret al.’s (1999) Figure 2 is
lighting the use of the permutation methodology as an the result of a hierarchical method, utilizing the cosine
exploratory data analysis tool. All three analyses thus of the angle between the gene vectors as the dissimilarity
far are based on the empirical distribution of the SLB measure, and the agglomerative method. First, we use
test statistic, so the results can be compared directly. a permutation-based hierarchical clustering routine
The penalized dissimilarity measure coupled with the with a cosine dissimilarity and average agglomeration
complete joining method discerns the most distinct ex-method to compare our results directly with those of
pression clusterings for the serum data of Iyer et al.
Iyer. Second, we repeat the test using the Munneke
(1999). Results based on the convex hull method differ metric (1) and the complete agglomeration method.
from those based on permutations: using the convex Third, we repeat the analysis using a significance
thresh-hull approach, the first branch point is not detected old, 1⫺ ␣. Finally, the analysis is repeated using the
with␣ ⬍0.025, at which point the subsequent second convex hull method with the Munneke metric and the
branch point is also accepted. This may indicate that average agglomerative method.
the convex hull approach provides a stricter criterion The results of the permutation-based randomization
for detecting valid cluster structure. All the branches (based on 1000 permutations) with hierarchical
cluster-that follow haveP- values⬎0.50, indicating no statistical ing (using the cosine metric) reveal two subgroups.
Us-significance. The relative difference in the results be-ing a significance level of␣ ⫽0.05, the permutation
sub-tween the permutation randomization and the convex groups share common clusters withIyeret al.’s (1999)
hull randomization is most likely due to the inability of Figure 2. The first branch point is the most obvious and
the permutation randomization to remove all valid sub-gives the only statistically significant subgroup structure.
cluster structure in the randomized null model data The interpretation of the groupings (Figure 6) indicates
sets. The convex hull approach avoids these issues by guar-one group of induced genes (group 1) and guar-one group
anteeing, on average, that the randomized data sets have of repressed genes (group 2). Even when the
signifi-no valid subcluster structure. As a focus of future research, cance level ␣ is increased to ␣ ⫽ 0.40, this grouping
we are considering different criteria to guide the determi-remains intact.
nation of which randomization method to use. We modified the dissimilarity measure by adding a
pen-alty term (Munneke metric) to the cosine dissimilarity measure (1) and repeated the permutation-based
analy-DISCUSSION
sis. Any change in the number of significant subgroups
Figure7.—Profile plots of groups 1–9 discovered using complete linkage, penalized distance (1), and␣ ⫽0.15 for the serum data (Iyer et al.
1999).
repetitive nature of randomization calculations requires groups have great potential to suggest genes that may be coregulated under the conditions studied in the ex-intensive CPU time; however, mainframes with multiple
processors are now able to reduce the computer time periment. In work byLanet al.(2003) hierarchical clus-tering with oblique principal components was used to by a factor proportional to the number of available
pro-cessors. Thus, the implementation of permutation test- reduce the dimension of the data space when mapping mRNA abundance as quantitative traits. While no levels ing is straightforward. For example, the
permutation-based clustering technique has been implemented in of confidence were attached to the clusters, it is easily understood that randomization methods not only fit the R language and made available by the GeneX system
(versions 1.05 and 2.0), available at http://sourceforge. the application, but also in fact benefit the results. Several resampling techniques that associate reliabil-net/projects/genex. Version 2.0 also includes the
con-vex hull clustering approach, as described previously. ity metrics to clustering results have been established. Those mentioned in the Introduction are based on GeneX is a publicly available gene expression database
with an analysis toolkit (Mangalam et al. 2001). Both bootstrapping approaches and rely upon the examina-tion and counting of individual elements in the original permutation and convex hull approaches are also
avail-able as stand alone programs written in R at http:// and perturbed clusters. Through this work we intro-duced the use of permutation or randomization meth-mason.gmu.edu/ⵑkschlauc/.
The broad utility of randomization techniques as ap- ods that do not rely upon cluster size and individual elements, but assign one value to each cluster via a test plied to cluster analysis is not limited to genomics or
gene expression applications. The randomization meth- statistic, to assess its “tightness” relative to its subclusters. Additionally, our proposed methods are independent ods presented here in the context of assessing gene
expression profiles can be implemented in combination of clustering technique and offer a dissimilarity metric capable of assessing both magnitude and pattern of ex-with any clustering technique, thus allowing researchers
to identify statistically significant subgroup structures in pression. We believe that our approach is complemen-tary to those mentioned previously, and that it offers a a group of genes selected for study in a given organism.
Furthermore, these gene clusters can then be compared reasonable alternative to assessing reliability of clusters generated by any clustering procedure.
across clustering methods and criteria via their attached
Fisher, R. A., 1935 The Design of Experiments, Ed. 3. Oliver & Boyd,
explore the results of gene expression experiments. This
London.
is due in part to the intuitive visual appeal that clusters Good, I. P., 2000 Permutation Tests: A Practical Guide to Resampling
Methods for Testing Hypothesis.Springer, New York.
provide for discerning patterns in very large and
com-Gordon, A. D., 1999 Classification.Chapman & Hall, London.
plex data sets. Perhaps more importantly, biologists use
Hartigan, J. A., 1975 Clustering Algorithms.Wiley, New York.
the results from clustering to filter and select sets of (can- Iyer, V. R., M. B. Eisen, D. T. Ross, G. Schuler, T. Mooreet al.,
1999 The transcriptional program in the response of human
didate) genes for further hypothesis-driven research. If
fibroblasts to serum. Science283:83–87.
used for such decision making, it is important to
deter-Johnson, R. A., andD. W. Wichern, 1998 Applied Multivariate
Statis-mine whether subsets of gene expression patterns are tical Analysis, Ed. 4. Prentice-Hall, Englewood Cliffs, NJ.
Kerr, M. K., andG. A. Churchill, 2001 Bootstrapping cluster
analy-distinguishable or merely random artifacts. In the
ab-sis: assessing the reliability of conclusions from microarray
experi-sence of independent biological replications we have
ments. Proc. Natl. Acad. Sci. USA98(16): 8961–8965.
demonstrated how randomization can aid the explora- Kim, K., M. A. L. West, R. W. Michelmore, D. A. St.ClairandR. W.
Doerge, 2005 Old methods for new ideas: dissection of the
tion process that often accompanies microarray
experi-determinants of gene expression levels. Proceedings of the
Stad-ments.
ler Genetics Symposium, Columbia, MO.
Knudsen, S., 2002 A Biologist’s Guide to Analysis of DNA Microarray
We thank the many people who have discussed this work over the
Data.Wiley, New York. years; most significant are two anonymous reviewers, Joel Bader,
Lan, H., J. P. Stoehr, S. T. Nadler, K. L. Schueler, B. S. Yandell Michael (Mik) Black, Bruce Craig, Rob Martienssen, George McCabe,
et al., 2003 Dimension reduction for mapping mRNA abun-Richard Michelemore, Bruno Sobral, and Bruce Trumbo. This work
dance as quantitative traits. Genetics164:1607–1614.
was supported by a Pioneer Hi-Bred research grant and by a U.S.
De-Mangalam, H., J. E. Stewart, J. Zhou, M. Waugh, K. Schlauch
partment of Agriculture-Initiative for Future Agriculture and Food et al., 2001 GeneX: an open source gene expression database
Systems (IFAFS) grant to R.W.D. Work based upon this material was and integrated toolset. IBM Syst. J.40:(2): 552–569.
supported by National Science Foundation (NSF) grant 0078307 McShane, L., R. Radmacher, B. Freidlin, R. Yu, M.-C. Liet al., 2002
(K.A.S. and W.D.B.) and NSF grant BDI-0244167 (GeneX; K.A.S.). Methods for assessing reproducibility of clustering patterns
ob-served in analyses of microarray data. Bioinformatics 18 (11):
1462–1469.
Munneke, B., 2001 Null model methods for cluster analysis of gene
LITERATURE CITED expression data. Ph.D. Thesis, Department of Statistics, Purdue
University, West Lafayette, IN.
Barber, C., D. DobkinandH. Huhdanpaa, 1997 The quickhull Nettleton, D., andR. W. Doerge, 2000 Accounting for variability
algorithm for convex hulls. ACM Trans. Math. Sci.22:469–483. in the use of permutation testing to detect quantitative trait loci.
Brem, R. B., andL. Kruglyak, 2005 The landscape of genetic com- Biometrics56:285–291.
plexity across 5,700 gene expression traits in yeast. Proc. Natl. Perou, C. M., S. S. Jeffrey, M. van de Rijn, C. A. Rees, M. B. Eisen
Acad. Sci. USA102(5): 1572–1577. et al., 1999 Distinctive gene expression patterns in human
mam-Brøndsted, A., 1983 An Introduction to Convex Polytopes(Graduate mary epithelial cells and breast cancers. Proc. Natl. Acad. Sci.
Texts in Mathematics, No. 90). Springer-Verlag, New York. USA96:9212–9217.
Cheung, K. J., V. Badarinarayana, D. W. Selinger, D. Janseand Ronald, J., J. M. Akey, J. Whittle, E. N. Smith, G. Yvertet al., 2005 G. M. Church, 2003 A microarray-based antibiotic screen iden- Simultaneous genotyping, gene-expression measurement, and
tifies a regulatory role for supercoiling in the osmotic stress re- detection of allele-specific expression with oligonucleotide arrays.
sponse ofEscherichia coli.Genome Res.13(2): 206–215. Genome Res.15(2): 284–291.
Churchill, G. A., and R. W. Doerge, 1994 Empirical threshold Schadt, E. E., S. A. Monks, T. A. Drake, A. J. Lusis, N. Cheet al., 2003
values for quantitative trait mapping. Genetics138:963–971. Genetics of gene expression surveyed in maize, mouse, and man.
Craig, B. A., M. A. BlackandR. W. Doerge, 2003 Microarrays: Nature422:297–302.
the technology and analysis. J. Agric. Biol. Environ. Stat.8(1): 1–28. Tamayo, P., D. Slonim, J. Mesirov, Q. Zhu, S. Kitareewanet al., 1999
Doerge, R. W., 2002 Mapping and analysis of quantitative trait loci Interpreting patterns of gene expression with self-organizing
in experimental populations. Nat. Rev. Genet.3:43–52. maps: methods and application to hematopoietic differentiation.
Doerge, R. W., andG. A. Churchill, 1996 Permutation tests for Proc. Natl. Acad. Sci. USA96:2907–2912.
multiple loci affecting quantitative character. Genetics142:285–294. Tavazioe, S., J. D. Hughes, M. J. Campbell, R. J. ChoandG. M.
Eisen, M. B., P. T. Spellman, P. O. BrownandD. Botstein, 1998 Church, 1999 Systematic determination of genetic network
ar-Cluster analysis and display of genome-wide expression patterns. chitecture. Nat. Genet.22:281–285.
Proc. Natl. Acad. Sci. USA95:14863–14868. Tibshirani, R., G. WaltherandT. Hastie, 2001 Estimating the
Ewing, R. M., A. B. Kahla, O. Poirot, F. Lopez, S. Audicet al., 1999 number of clusters in a data set via the gap statistic. J. R. Stat.
Large-scale statistical analyses of rice ESTs reveal correlated pat- Soc. Ser. B Stat. Methodol.63:411–423.
terns of gene expression. Genome Res.9:950–959. Zhang, K., andH. Zhao, 2000 Assessing reliability of gene clusters
Ferea, T. L., D. Botstein, P. O. BrownandR. F. Rosenzweig, 1999 from gene expression data. Funct. Integr. Genomics1:156–173. Systematic changes in gene expression patterns following