ABSTRACT
KILONZO, OBADIAH. Process Control Modeling and Real-Time Error Compensation in Tube Hydroforming. (Under the direction of Gracious Ngaile.)
Tube Hydroforming (THF) is the metal forming process where metal tubes take the shape of
a die cavity by being pressurized internally by a fluid in addition to axial material feed
applied. This process has applications in automotive fields and household goods, offering
benefits such as tight tolerances, lower part weight and fewer secondary operations.
However, it is affected by long lead times due to loading path design and by process
challenges related to errors such as the variation of tribological conditions that occur during
hydroforming. The use of Finite Element Analysis (FEA) has greatly enhanced the THF field
with the ability to simulate the process to generate loading paths (material feed versus
pressure curve). However due to the nature of THF process being influenced by many
variables such as material properties, tube geometry and tribological conditions, FEA leads to
a lot of computation time.
This research presents the development of an interactive, real time Database Generated
Loading Path Scheme (DGLPS) for various THF families. By classifying most of the
asymmetric THF parts into families such as Bulge and Single Y-Shape THF parts; different
loading paths are simulated and stored in the DGLPS. Interactivity with DGLPS is made
available such that a user can request a loading path by providing input parameters. The
DGLPS provides the material feed data by employing interpolation techniques and the
unit amplitude. Loading path results from DGLPS for a variety of desired parameters for
different THF families matched FEA simulations with minimum variation of less than 5%.
This research reviews errors occurring in THF by broadly categorizing based on association
with material feed and with internal pressure. The dominant material feed error is identified
as frictional error. This research introduces an error compensation scheme, the Database
Back-Step (DBS) method to compensate the loading path due to the effect of the frictional
error. In this method the forces at the cylinder-tube interface are monitored and compared to
acceptable forces in a database. Variation in this force from the expected force is corrected
by stepping back into the database for another loading path that compensates the difference
based on the coefficient of friction established from this force. This is accomplished in real
time during the forming process via a Data Dynamic Exchange link between the database and
the control unit. Based on experimental results the friction tended to vary from 0.01 to 0.15
for a Double T-Shape THF family demonstrating the need for error compensation. This
shows that the DBS method provides an assured error compensation effort by obtaining
optimized loading paths.
Differences may occur when comparing the loading paths and the position of the press
cylinder (stroke) after applying the loading paths. This indicates the possibility of errors
associated with the equipment. This research proposes the Real Time Stroke (RTS)
Controller method as a solution for improving the cylinder stroke by compensating for
involved, a closed loop system whereby the reference input is obtained from the DBS method
and designing a controller. Simulations of the process control have been done with Think and
Do Live software. The results from the RTS method show a close tracking of the reference
input with reduced overshoots beyond the reference loading paths. Control with above
approaches results in efficient and concerted control merging the loading path design
Process Control Modeling and Real-Time Error Compensation in Tube Hydroforming
by
Obadiah Mutisya Kilonzo
A dissertation submitted to the Graduate Faculty of North Carolina State University
in partial fulfillment of the requirements for the Degree of
Doctor of Philosophy
Mechanical Engineering
Raleigh, North Carolina
2010
APPROVED BY:
Dr. Fen Wu Dr. Paul Ro
Dr. Gracious Ngaile Dr. Yuan-Shin Lee
ii
DEDICATION
To God the Father and my Lord Jesus Christ for His unconditional love and support, wisdom
and guidance, good health and many blessings including grace to complete this research.
iii
BIOGRAPHY
Obadiah Kilonzo received his B.S. degree in Mechanical Engineering from the University of
Nairobi, Kenya; M.S degree in Mechanical Engineering from Rochester Institute of
Technology, Rochester, New York and enrolled in graduate school at North Carolina State
University, Raleigh, North Carolina in the Fall of 2006. His research interests include
automated manufacturing systems, process control, modeling and automated hydraulic
iv
ACKNOWLEDGMENTS
I would like to express my appreciation and gratitude to my advisor, Dr. Gracious Ngaile, for
his continuous guidance and support during this research.
I would also like to thank the Committee members, Dr. Paul Ro, Dr. Fen Wu and Dr.
Yuan-Shin Lee for their time, constructive suggestions and comments.
I would like to acknowledge the National Science Foundation, through which this work was
funded under Project No. DMI-0448885. Any opinions, findings, and conclusions or
recommendations expressed in this material are those of the author and do not necessarily
reflect the views of the National Science Foundation.
I am grateful to my research group peers for their constant help and advice in group meetings
and personal discussions.
I would like to thank the men‘s fellowships at New Life Fellowship, Rochester, NY and Cary
Church of God, Cary, NC for their support, perspective, and encouragement to go forth and
stay on ‗that I may not lose what I have worked for, but may win a full reward‘ (2 John 8).
My friends and family deserve special thanks.
Finally, I am most grateful to my wife and daughter for their love, understanding and
v
TABLE OF CONTENTS
LIST OF FIGURES ... ix
LIST OF TABLES ... xii
CHAPTER 1: INTRODUCTION AND RESEARCH OBJECTIVES ... 1
1.1 INTRODUCTION ... 1
1.2 RESEARCHOBJECTIVES ... 3
1.3 DISSERTATIONORGANIZATION ... 4
CHAPTER 2: LITERATURE REVIEW -TUBE HYDROFORMING, PROCESS AND CONTROL .. 6
2.1 INTRODUCTIONINTUBEHYDROFORMING ... 6
2.1.1. Tube Hydroforming Process ... 6
2.1.2. Factors Influencing Tube Hydroforming ... 8
2.2 LOADINGPATH ... 11
2.2.1. Loading Path Design ... 11
2.2.2. Loading Path Design Methods ... 13
2.2.3. THF Failure Modes ... 17
2.3 ERRORSANDUNCERTAINTIES ... 19
2.3.1. THF Process Sources of Errors and Uncertainty ... 20
2.3.2. Introduction to Error Compensation ... 23
2.3.3. Methods to Error Compensation ... 23
2.4 PROCESSCONTROL ... 24
2.4.1. Process Control in Manufacturing ... 24
2.4.2. Process Control Methods- Feedback System... 26
2.4.3. Process Control in THF – The Hydraulic Unit ... 27
vi CHAPTER 3:
DATABASE DEVELOPMENT FOR TUBE HYDROFORMING LOADING PATHS 32
3.1 DATABASEUSEFORLOADINGPATHDESIGNANDGENERATION ... 32
3.2 DATABASEGENERATEDLOADINGPATHSCHEMEMETHODOLOGY ... 34
3.2.1. Development of Simulated Sets of Loading Paths from FEA ... 35
3.2.2. Database Generated Loading Path Scheme Performance Steps ... 37
3.3 DATABASEGENERATEDLOADINGPATHSCHEMEOPERATION ... 42
3.3.1. Investigation on the Effect of One Variable Interpolated ... 42
3.3.2. Investigation on the Effect of All Variables Interpolated ... 44
3.4 OTHERTHFFAMILYCASESTUDIES ... 46
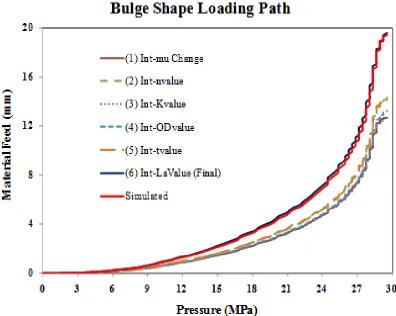
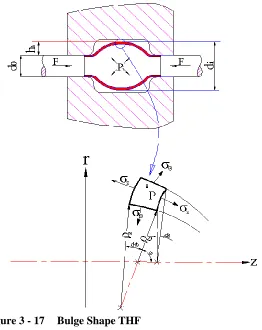
3.5 PRESSURECURVEGENERATIONFORBULGESHAPE ... 48
3.5.1. Pressure Curve Development ... 48
3.5.2. Determination of the Maximum Pressure ... 49
3.5.3. Comparison of Maximum Pressure Equation and Maximum Pressure from FEA ... 52
3.6 EFFECTOFPARAMETERCHANGEINDATABASE... 54
CHAPTER 4: ERROR COMPENSATION USING DATABASE BACK-STEP (DBS) METHOD ... 56
4.1 DOMINANTERRORIDENTIFICATION ... 56
4.1.1. Review on the Parameters and Causes of Uncertainty ... 57
4.1.2. Design of Experiments Technique for Identifying Dominant Error ... 60
4.2 DATABASEBACK-STEPMETHOD ... 64
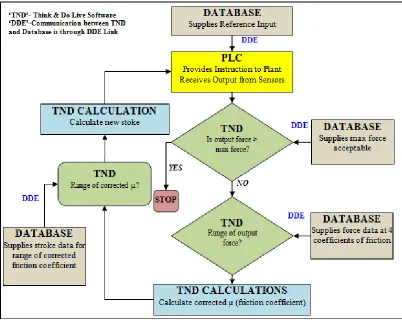
4.2.1. Database Back- Step Flowchart ... 65
4.2.2. Control Software (TND) and Data Dynamic Exchange (DDE) Link ... 67
4.3 FRICTIONEFFECTSONLOADINGPATH ... 67
4.3.1. Effects of Friction on Loading Path ... 68
4.3.2. Effects of Friction and Guiding Zone Length on Loading Path ... 69
4.3.3. Effects of Friction and Tube Thickness on Loading Path ... 69
vii
4.4 DATABASEBACK-STEPMETHODALGORITHMS ... 72
4.5 SIMULATIONCASESTUDYUSINGDATABASEBACK-STEPMETHOD ... 75
4.5.1. Procedure for Database Operation ... 75
4.5.2. Simulation for Single Y-Shape ... 75
4.6 EXPERIMENTALVALIDATION ... 77
4.6.1. Test Set-up and Experimental Procedures... 77
4.6.2. Press Control Module Description ... 79
4.6.3. Hydroforming Equipment Description ... 80
4.6.4. Experimental Results ... 82
CHAPTER 5: ERROR COMPENSATION USING REAL-TIME STROKE (RTS) CONTROLLER METHOD ... 87
5.1 INTRODUCTION ... 87
5.2 EQUIPMENTANDCONTROLLEDPARAMETERSINTHF ... 89
5.3 SYSTEMMODELING ... 94
5.3.1. Cylinder Interaction with Environment ... 94
5.3.2. Estimation of External Force ... 95
5.3.3. System Modeling Steps ... 97
5.4 PLANTDESIGN ... 99
5.5 RTSCONTROLLER ... 102
5.5.1. Introduction ... 102
5.5.2. RTS Methodology and Controller Operation ... 103
5.6 SIMULATIONWITHTHINKANDDOPROGRAM ... 110
5.7 SIMULATIONFORTHEDOUBLET-SHAPEFAMILY ... 111
CHAPTER 6: CONCLUSIONS AND FUTURE WORK ... 116
viii
APPENDICES ... 127
APPENDIXA:SAMPLEMACROCODESFORDATABASE ... 128
APPA.1 MODULEFORCREATINGATOOLBARWITHLISTOFFAMILIES ... 128
APPA.2 MODULEFORGATHERINGVARIABLESFROMTHEUSER ... 131
APPENDIXB:DATABASEBACK-STEPMETHOD ... 133
APPB.1 AUTOMATIONINTNDLIVE ... 133
APPB.2 FLOWCHARTSINDATABASEBACK-STEPMETHOD ... 136
APPB.3 EXCELMACROFORSENDING/RECEIVINGDATA ... 150
APPENDIXC:REAL-TIMESTROKECONTROLLER ... 157
APPC.1 MATLABCODEFORPLANTMODELANDCONTROLLER ... 157
ix
LIST OF FIGURES
FIGURE 2-1 SAMPLE OF THF PROCESS ... 7
FIGURE 2-2 SAMPLE OF HYDROFORMED PARTS ... 9
FIGURE 2-3 SAMPLE EQUIPMENT FOR THF PROCESS ... 10
FIGURE 2-4 FORCES IN SINGLE YSHAPE THF ... 12
FIGURE 2-5 PROCESS WINDOW AND FAILURE MODES ... 19
FIGURE 2-6 ERRORS AND THF ASSOCIATED STAGES ... 22
FIGURE 2-7 BLOCK DIAGRAM WITH CLOSED LOOP MODEL IN THF ... 26
FIGURE 2-8 SAMPLE CONTROL SYSTEM FOR A THFPRESS ... 28
FIGURE 3-1 THFFAMILIES IN THE DATABASE ... 34
FIGURE 3-2 INPUT PARAMETERS USED IN SIMULATION... 35
FIGURE 3-3 SAMPLE OF CREATE TOOLBAR CODE AND LIST BOX CREATED ... 37
FIGURE 3-4 INPUT BOX FOR K VALUE ... 38
FIGURE 3-5 THFGRAPHIC USER INTERFACE DISPLAY ... 39
FIGURE 3-6 DATABASE OPERATION FLOWCHARTS ... 40
FIGURE 3-7 INTERPOLATION FLOWCHART ... 41
FIGURE 3-8 SAMPLE SETS IN THE DATABASE FOR BULGE SHAPE ... 43
FIGURE 3-9 CHANGE IN ONE PARAMETER FOR BULGE SHAPE THF ... 44
FIGURE 3-10 BULGE SHAPE PART AND VARIABLES USED... 45
FIGURE 3-11 BULGE SHAPE SIMULATED-INTERPOLATION COMPARISON ... 45
FIGURE 3-12 SINGLE YSHAPE SIMULATION-INTERPOLATION COMPARISON ... 46
FIGURE 3-13 SINGLE TSHAPE SIMULATION-INTERPOLATION COMPARISON ... 47
FIGURE 3-14 DOUBLE TSHAPE SIMULATION-INTERPOLATION COMPARISON ... 47
FIGURE 3-15 DOUBLE YSHAPE SIMULATION-INTERPOLATION COMPARISON ... 47
FIGURE 3-16 PRESSURE CURVE PROFILE FOR THF ... 49
FIGURE 3-17 BULGE SHAPE THF ... 50
FIGURE 3-18 BULGE SHAPE PRESSURE CURVE ... 53
FIGURE 4-1 FRICTION ZONES IN THF(REF [AHMETOGLU ET. AL.,2000]) ... 58
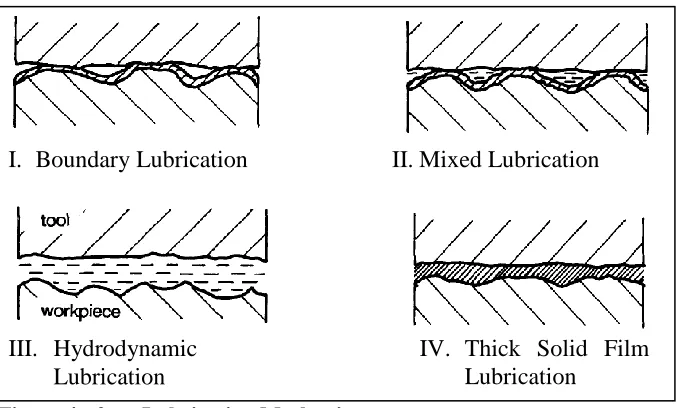
FIGURE 4-2 LUBRICATION MECHANISMS ... 59
x FIGURE 4-4 CONTRIBUTION RATIO OF THE UNCERTAIN VARIABLES TO LEFT AND RIGHT HAND
AXIAL LOADS ... 64
FIGURE 4-5 DATABASE BACK-STEP METHOD FLOWCHART ... 66
FIGURE 4-6 FRICTION EFFECT ON LOADING PATH (L1-185.3MM,T1-1.245MM) ... 68
FIGURE 4-7 EFFECT OF THE LENGTH CHANGE ON MATERIAL FEED WITH µ=0.01;T2=1.65MM .... 69
FIGURE 4-8 EFFECT OF THE LENGTH CHANGE ON MATERIAL FEED WITH µ=0.2;T2=1.65MM ... 70
FIGURE 4-9 EFFECT OF THICKNESS CHANGE ON MATERIAL FEED WITH µ=0.05;L1=185.3 ... 70
FIGURE 4-10 EFFECT OF THICKNESS CHANGE ON MATERIAL FEED WITH µ=0.2;L1=185.3 ... 71
FIGURE 4-11 FRICTION EFFECT ON FORCE (LENGTH 150MM,THICKNESS 1.65MM) ... 71
FIGURE 4-12 DBSMETHOD DATA COLLECTION FOR µ1 AND µ2(SAMPLE FOR TIME 11S);LH=LEFT SIDE,RH=RIGHT SIDE ... 74
FIGURE 4-13AXIAL LOAD FOR SINGLE Y SHAPE ... 76
FIGURE 4-14 AXIAL FEED FOR SINGLE Y SHAPE ... 76
FIGURE 4-15 HYDROFORMING TEST RIG ... 78
FIGURE 4-16 HYDROFORMING TEST RIG -DIE AREA ... 79
FIGURE 4-17 PRESSURE DEVELOPMENT CURVE FOR DOUBLE T-SHAPE... 80
FIGURE 4-18 MATERIAL FEED PROFILES FOR DOUBLE T-SHAPE AT DIFFERENT FRICTION CONDITIONS ... 81
FIGURE 4-19 LEFT AND RIGHT SIDE PUNCH FORCE FOR DIFFERENT FRICTION CONDITIONS ... 81
FIGURE 4-20 SPLIT DIES AND HYDROFORMED DOUBLE T-SHAPE HYDROFORMED PART ... 82
FIGURE 4-21 INPUT PRESSURE AND OUTPUT PRESURE FROM THE HYDROFORMING MACHINE. ... 84
FIGURE 4-22 PUNCH LOAD FOR THE LEFT AND RIGHT CYLINDER [TEFLON LUBRICANT]. ... 84
FIGURE 4-23 COMPARISON OF PUNCH LOAD FROM THE DATABASE AND THAT OBTAINED FROM EXPERIMENT [TEFLON LUBRICANT] AND [TEFLON +OIL LUBRICANT] ... 85
FIGURE 4-24 NON-LINEAR FRICTION CHARACTERISTIC FOR DIFFERENT LUBRICATION CONDITIONS ... 85
FIGURE 4-25 COMPARISON OF PUNCH DISPLACEMENT FROM THE DATABASE AND THAT OBTAINED FROM EXPERIMENT [TEFLON LUBRICANT] AND [TEFLON +OIL LUBRICANT] ... 86
FIGURE 5-1 CYLINDER MOTION WITH OVERSHOOTS ... 88
FIGURE 5-2 THFPRESS SET UP AND ERRORS ... 90
xi
FIGURE 5-4 AXIAL FORCE AND STROKE –DOUBLE T-SHAPE ... 95
FIGURE 5-5 AXIAL FORCE AND STROKE WITH STIFFNESS ANALYSIS–DOUBLE T-SHAPE ... 96
FIGURE 5-6 CYLINDER SECTIONS ... 98
FIGURE 5-7 DIAGRAM OF THE SYSTEM MODEL ... 99
FIGURE 5-8 POSITION CONTROL IN THFPROCESS ... 103
FIGURE 5-9 STEP RESPONSE OF SYSCL4 ... 106
FIGURE 5-10 STEP RESPONSE FOR DOUBLE T-SHAPE (0-4MM,13-27MM) ... 107
FIGURE 5-11 STEP RESPONSE FOR DOUBLE T-SHAPE (4-6.5MM) ... 108
FIGURE 5-12 STEP RESPONSE FOR DOUBLE T-SHAPE (6.5-13MM) ... 109
FIGURE 5-13 SAMPLE PIDGENERAL AND TUNING TAB FOR SYSCLI2 ... 110
FIGURE 5-14 BLOCK DIAGRAM WITH POSITION IN THF ... 111
FIGURE 5-15 RESULTS OF PRESS RESPONSE TO THE EXPERIMENTAL DBSMETHOD FOR DOUBLE T-SHAPE 112 FIGURE 5-16 RESULTS FOR DOUBLE T-SHAPE WITH SIMULATED DBSREFERENCE ... 114
FIGURE 5-17 RESULTS FOR DOUBLE T-SHAPE WITH EXPERIMENTAL DBSREFERENCE ... 114
FIGURE A-1 DATA INVOLVED IN DDELINK FROM DATABASE TO THINK AND DO LIVE ... 134
FIGURE A-3 CALCULATIONS IN THINK AND DO FOR FRICTION COEFFICIENT ... 138
FIGURE A-4 CALCULATIONS IN THINK AND DO FOR NEW STROKE BASED ON CORRECTED FRICTION COEFFICIENT ... 139
FIGURE A-5 AXIAL LOAD AND FEED FOR SINGLE Y SHAPE (LEFT CYLINDER) ... 144
xii
LIST OF TABLES
TABLE 1 SOURCES OF ERROR IN TUBE HYDROFORMING ... 21
TABLE 2 SUMMARY OF LOADING PATH DESIGN METHODS ... 33
TABLE 3 SCALING FACTORS FOR VARIOUS FAMILIES ... 53
TABLE 4 TWO-LEVEL FRACTION FACTORIAL DOE MATRIX ... 61
TABLE 5 STANDARD DEVIATION OF UNCERTAINTY VARIABLES IN THE SINGLE Y-SHAPE THF PROCESS ... 62
TABLE 6 PARAMETER DATA FOR SINGLE Y-SHAPE MODEL ... 67
TABLE 7 STIFFNESS ANALYSIS (N/MM) ... 96
TABLE 8 SYSTEM DATA... 104
TABLE 9 CALCULATED DATA ... 104
TABLE 10 STIFFNESS TO STEP RESPONSE WITH A PI CONTROLLER (K=10,KI=20000) ... 106
TABLE A-1 LOADING PATH OF LEFT CYLINDER OF THE SINGLE Y-SHAPE THF ... 140
1
CHAPTER 1:
INTRODUCTION AND RESEARCH OBJECTIVES
1.1 INTRODUCTION
Tube Hydroforming (THF) is the metal forming process where metal tubes take the shape of
a die cavity by being pressurized internally by a fluid in addition to axial material feed
applied. This process has applications in automotive fields and household goods, offering
benefits such as tight tolerances, lower part weight, fewer secondary operations and part
consolidation. However, it is affected by long lead times due to loading path design and by
process challenges related to errors such as the variation of tribological conditions that occur
during the hydroforming process. The use of Finite Element Analysis (FEA) tools has greatly
enhanced the THF field with the ability to simulate the process to generate loading paths
(material feed versus pressure curve). However due to the nature of THF process influenced
by many variables such as material properties, tube geometry and tribological conditions,
FEA leads to a lot of computation time.
The THF process is done in a press that houses the dies, pressure booster and control system.
The inner pressure is supplied from a pressure booster into the tube. The hydraulic equipment
of the press used for providing material feed to the tube is composed of the motor-pump
system, valves and cylinders. The material feed and internal pressure together graphically
form the loading path which is the guideline of material feed and pressure provided to the
press. The use of FEA in developing loading paths has greatly enhanced the THF field
2 paths. This loading path generation method requires a lot of computation time. Other
methods for generating loading paths apart from FEA such as analytical and fuzzy logic are
limited by how many parameters will be changed to obtain the loading path. This research
focuses on developing Database Generated Loading Path Scheme (DGLPS) for parts
developed by hydroforming straight tubes. Various parameters are considered including
geometry, tribological conditions and material properties such as strength of material, and
strain hardening exponent. Based on the request of a user, the inquisitive database with
interpolation/extrapolation algorithms provides a loading path.
The development of the internal pressure and material feed is crucial requiring meticulous
effort in order to inhibit THF failure modes such as wrinkling, bursting and buckling that are
associated with too much feed (wrinkling and buckling) or too much pressure (bursting).
Errors and uncertainties play a major role in the design of material feed and internal pressure.
Types of errors include errors associated with the forming process such as the variation of
friction, errors associated with the tube material such as change in strain hardening exponent
during the process, errors associated with loading path design such as neglecting die
elasticity and errors associated with equipment such as leakage. This research reviews errors
occurring in THF broadly categorizing errors as associated with material feed and with
internal pressure. The dominant material feed error identified is the frictional error. This
research introduces an error compensation scheme whereby the Database Back-Step (DBS)
3 In this method the forces at the cylinder-tube interface are monitored and compared to
expected forces in a database. Variation in the cylinder force at the interface from the
expected force is corrected by stepping back into the database for another loading path that
compensates the difference based on the coefficient of friction established from the force at
the cylinder-tube interface. This is accomplished in real time during the forming process via
a communication link between the database and the control unit.
Though the loading path design is enhanced with the use of the DBS method, stroke control
can be improved by considering the aspects of the equipment used. This research focuses on
a study on errors and uncertainties that bound upon equipment and deriving a mathematical
model of the equipment setup (plant model) with a controller that is designed to assist in
tracking the stroke of the cylinder. The challenge being met in this research is developing a
system with adjustable loading paths coupled with real-time error compensation during the
THF process.
1.2 RESEARCH OBJECTIVES
The goal of this research is to develop real time error compensation in Tube hydroforming
process that would enhance the development of quality parts. The particular objectives of this
research are:
OBJ 1.Design and use of the Database Generating Loading Path scheme (DGLPS Method)
4 OBJ 2.Design and operate the Database Back-Step Method (DBS Method) in Real time
control and compensation of errors associated in THF process congruent with
identification of the dominant error.
OBJ 3.Develop a Real Time Stroke Controller (RTS Method) for error compensation of
equipment bound errors and uncertainties subsequent to the development of a plant
model.
1.3 DISSERTATION ORGANIZATION
The chapter outline in this research is as follows Chapter 1: Introduction and Research
Objectives discusses the introduction and need for this research with objectives clearly
stipulated. Chapter 2: Literature Review –Tube Hydroforming, Process and Control provides
a review of Tube Hydroforming involving the process steps and parameters, insight to the
loading path, design methods and Tube Hydroforming failure modes. A discussion on errors
and uncertainty and the need for process control is provided. This chapter concludes with
summary and key areas of future research. Chapter 3: Database Development for Tube
Hydroforming Loading Paths provides the methodology of the Database Generated Loading
Path Scheme (DGLPS) involving development of the pressure curve by analytical methods
and development of the material curves using interpolation schemes. Case studies for various
THF families are provided. This DGLPS will be further used in assisting in real time control.
Chapter 4: Error Compensation Using Database Back-Step (DBS) Method begins with the
identification of the dominant THF error and outlines the design of the DBS Method for error
5 Use of the database developed with the DGLPS method is discussed together with the real
time control operation with Dynamic Data Exchange (DDE) communication. Analysis with
simulation and experimentation is provided. Chapter 5: Error Compensation Using
Real-Time Stroke (RTS) Controller Method reviews equipment bound errors, discusses the THF
hydraulic unit, develops a system model for the development of a plant model and provides
the design of the Real Time Stroke (RTS) controller error compensation method. Analysis
with simulation is provided at the end of the chapter. Chapter 6: Conclusions and Future
Work provides concluding remarks and future areas of research. Reference and Appendix are
6
CHAPTER 2:
LITERATURE REVIEW -TUBE HYDROFORMING, PROCESS AND
CONTROL
2.1 INTRODUCTION IN TUBE HYDROFORMING
The two common types of hydroforming are Tube Hydroforming (THF) and Sheet
Hydroforming with the former process used in various applications as automotive,
electronics and biomedical fields and the latter process common in aerospace industry as well
as the automotive sector. For automakers pursuing fuel efficient automobiles, reduction of
automobile weight is a high priority and a beneficiary of THF research. Some of the parts
that are hydroformed include automobile exhaust manifolds, exhaust connectors, chassis and
piping. THF has also led to faster manufacturing processing in comparison to conventional
metal forming processes and reduced tool cost [Koc, 2003]. Tube Hydroforming (THF) can
be categorized into two types, based on the pressure - bearing tube surface, THF with internal
pressure and THF with external pressure. Hydroforming tubes with inner hydraulic pressure
where pressure is applied to the surface of the tube, is commonly used in production
compared to hydroforming with outer hydraulic pressure.
2.1.1. Tube Hydroforming Process
The THF process involves a loading path i.e. a graph of internal pressure and axial
displacement known as material feed. Effects of loading paths have been widely researched
[Jirathearanat, 2004; Dohmann et.al., 1997; Koc et.al., 2001]. The tube is assumed to be in
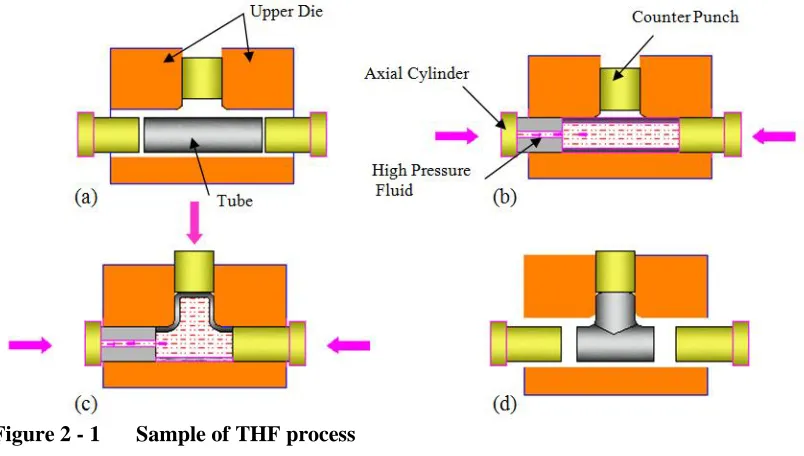
7 The process in tube hydroforming can be summarized in 10 steps as shown below
Step 1: The tube blank (workpiece) is inserted onto the lower die. The tube blank may be a tube that is straight or of a complex shape but be formed to the shape of the die cavity.
Step 2: Communication is established between the press and the source of the loading paths. The loading paths may be provided from a PC to a PLC via wire connection or remotely.
Step 3: The die is closed using hydraulic means, by bringing down the upper die to close in on the tube blank. Some designs may incorporate guide pins to ensure that the dies are well
aligned and spacers to lock the upper die in position. The dies are clamped by engaging the
press upper vertical cylinder to provide clamping force to clamp both dies together.
Figure 2 - 1 Sample of THF process
Step 4: The axial cylinders are adjusted to seal the tube ends as shown in Figure 2-1(a). During the forming process the cylinders provide the required axial force.
8 Step 6: Hydroforming of the tube takes place. The pressures may vary from about 600 bar (8700 psi) up to 2000 bar (30000 psi). The press capacities for hydroforming vary with high
capacity recorded of 20,000 ton used by Sung Kwang Eng & Mfg Co., Ltd [Sung Kwang,
2010].
Step 7: Forming has been done as shown in Figure 2-1(c). Depressurization is done by stopping the pressure booster.
Step 8: The axial cylinders and counter punch are retracted, as shown in Figure 2-1(d) hence draining out the fluid.
Step 9: The upper vertical cylinder is moved upwards to unclamp the dies. Step 10: The part is ejected from the dies and cycle begins again.
The THF process is influenced by various factors such as the type of tube blank material,
product design and shape, tooling and equipment, tool - material interface and deformation
zone. A review of the factors is discussed below.
2.1.2. Factors Influencing Tube Hydroforming
2.1.2.1. Type of Tube Blank Material
Common materials used in THF are steels and aluminum. The various material parameters
that are crucial in THF are: strain hardening, anisotropy, and strain rate effects. Parameters
involved in developing simulation models are: Strength of the material, density, Young‘s
modulus and Poisson‘s ratio. Other factors include the yield strength of a material which is at
the initiation of plastic deformation and related to the material‘s ability to resist plastic
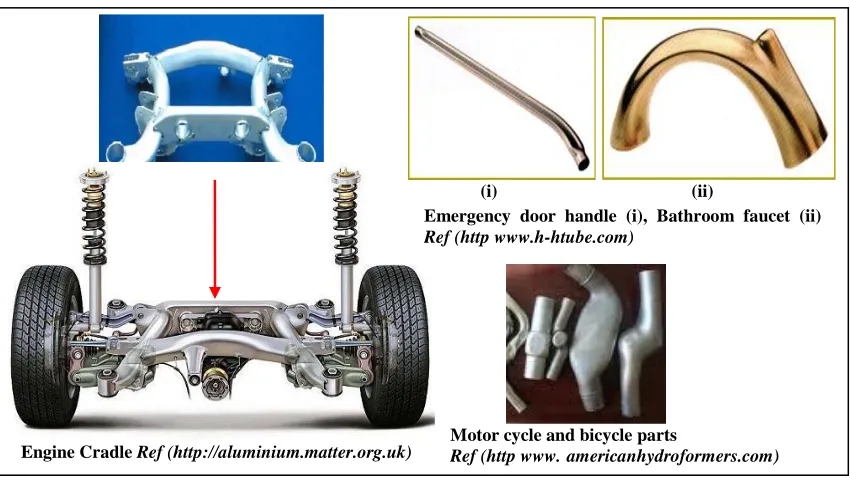
9 2.1.2.2. THF Product Design and Shape
Different secondary design processes can be added to the THF expansion process such as
piercing, performing and bending. Various shapes can be obtained depending on the die
cavity available. Parts such as exhaust manifolds require complex die shapes. The Figure 2-2
below shows sample of hydroformed parts.
Figure 2 - 2 Sample of Hydroformed parts
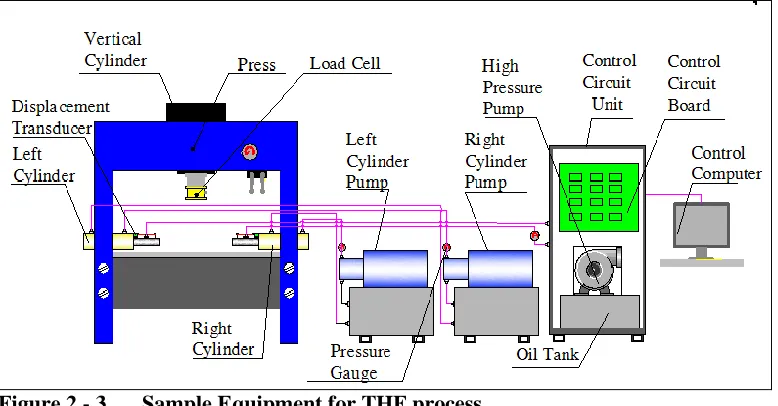
2.1.2.3. THF Tooling and Equipment
The hydraulic press is the common press used for THF purposes. Tools involved include the
die holders, asymmetric die halves, oil drain plate and cylinder punch heads. Other
equipment involves the control function equipment which includes the circuit board, PLC
units and the desk computer. Figure 2-3 below shows a sample of the equipment set up.
Engine Cradle Ref (http://aluminium.matter.org.uk)
Emergency door handle (i), Bathroom faucet (ii)
Ref (http www.h-htube.com)
(i) (ii)
Motor cycle and bicycle parts
10 Figure 2 - 3 Sample Equipment for THF process
Equipment shown above contains following components: left and right cylinders connected
to pump-motor systems, vertical cylinder, displacement transducers, high pressure system,
pressure transducers, valves, control circuit unit and PC and hydraulic press.
2.1.2.4. Tool-material Interface and Deformation Zones
Apart from the material properties of the blank, the environment of the material plays an
important role in THF. The interface of the tool and material will affect the axial force
required while the deformation zones dictate the profile of the internal pressure. A THF
family with deformation zone that has less tool-material interface such as Bulge shape will
require less internal pressure towards the end of the THF process (pressure needed for
calibration purposes due to corners).
All factors above are involved in shaping the loading path. The next section focuses on the
11
2.2 LOADING PATH
The loading path is defined as the profile path of material feed and internal pressure supplied
to the press to guide the forming process.
2.2.1. Loading Path Design
This path can be described as either force controlled loading path where the guidance
provided is internal pressure and axial force and presented graphically as axial force versus
pressure or as stroke controlled loading path where the guidance provided is internal pressure
and displacement and presented graphically as material feed versus pressure.
2.2.2.1. Internal Pressure
Pressure is provided using a hydraulic fluid from a pressure booster system that is instructed
from the control unit to act based on the loading path. The internal pressure for the loading
path is developed from pressure curves (internal pressure versus time). This internal pressure
is considered to be of substantial amount able to force the tube walls to deform plastically.
Pressure assists in expanding the material outward towards the die cavity wall.
2.2.2.2. Material Feed
Material feed which involves pushing the tube material from the ends into the die expansion
region in order to prevent excessive thinning from the internal pressure. Material feed is
achievable via the axial hydraulic cylinders connected to a pump/motor system that is
12 The material feed for the loading path is developed as either material feed curves
(displacement versus time) or axial force curves (force versus time). The axial cylinders are
required to deliver during the forward stroke a total axial force, Fa able to:
Provide sealing force, Fpt needed to maintain contact with the punch hence avoiding
leakage and overcome pressure reaction force during the process.
Overcome friction force, FL within the cylinder.
Overcome friction force, Ffr in the die –tube interface and punch-tube interface.
Provide forming force, Fdftocause yielding and plastic deformation of tube walls.
Figure 2-4 below shows the forces in THF process.
Figure 2 - 4 Forces in Single Y-Shape THF
Other Forces in THF are summarized below as:
Clamping- Forces provided by the clamps to keep the die and set up in place during the
THF process and is limited by the press tonnage.
Guide zone Transition zone Expansion zone
F
dfF
frQC1 QC2
PT PS FL Fa Fc Final tube P Fa Fa
Fpt Fpr
Fd
see insert Guide
zone Transition zone Expansion zone
F
dfF
frQC1 QC2
PT PS FL Fa Fc Final tube P Fa Fa
Fpt Fpr
13 Pressure Forces- Forces supplied as the internal pressure on to the interior tube walls.
Die reaction force- Force supplied by the die as a reaction to the force at the die-tube
boundary applied onto the dies.
2.2.2. Loading Path Design Methods
Internal pressure can be determined by various means such as analytical, simulation and
empirical ways. Jirathearanat, (2004) developed a pressure curve (pressure versus time) by
using self-feeding simulation techniques. In this technique the first step involved calculating
a maximum pressure value based on the pressure required to form a corner radius as shown
in Eqn. 2.1 below:
max
2 ln 3
c
c o
r r t
p
(2.1)where ζ is the flow stress of the material, rc is the die corner radius and to is the initial tube
wall thickness. In this step, no axial feeds are applied and the die–tube interface friction
coefficient is set to zero. The next step involved modifying the pressure curve based on the
velocity of the nodes at the tube ends. The profile of the pressure curve is developed with
segments of different gradients till the maximum pressure value. In this method the pressure
curve gradients have to be estimated and results in a large material feed requirement when
applied to a loading path. This method is also limited to the bulge type (more discussion on
14 Yang and group [Yang et.al. 2001] developed an optimization scheme to come up with the
pressure curve. The optimization scheme is developed with an objective (cost) function to be
minimized, design variable(s) to be optimized and constraint functions determining the
design constraints. The objective function involved the element thickness variations after the
forming process with pressure as the design variable while the constraint function
represented the distance of the desired shape from the final part. This method is limited in
that the objective function tends to be complex and requires many simulation runs. Gelin and
group [Gelin et al., 2005] compared a numerical scheme and an optimization scheme for the
pressure curve. The numerical scheme involved considering the fluid in the die cavity, the
momentum and mass conservation equations and motion of the fluid nodes at the tube
surface. The optimization scheme involved an objective function which took into account the
variations of the volume of fluid injected into the tube. Though the numerical scheme took
less time than the optimization scheme, it relatively took long time (14 hours) to develop and
hence a method providing the loading paths in a shorter time would improve the THF
process.
The maximum pressure allowable P(max) may be obtained by analytical methods [Asnafi,
1999; Koc et. al., 2000; Hwang et. al., 2005] that involve modeling the tube as a thin
cylindrical vessel, or by the finite element modeling methods in conjunction with the
available equipment limits. The analytical method for the pressure curve may be a linear
15 The linear pressure function method observed by Jirathearanat, (2004) leads to the need for
high nodal velocity at the tube ends to overcome excessive thinning. Aue-U-Lan and group
[Aue-U-Lan et al., 2004] developed an adaptive pressure curve that is made of segments of
increasing pressure and constant pressure. Upon the detection of excessive thinning, the
pressure is held constant while increasing material feed until the detection of wrinkling, and
then pressure is increased. The adaptive method provides a corrective measure to the linear
function but requires advance knowledge of predicting bursting and wrinkling such as to
know when to maintain a constant pressure due to the onset of bursting.
Aydemir and group [Aydemir et al. 2005] designed a fuzzy based incremental pressure curve
similar to the adaptive method but that took into effect the prediction of THF failure based on
fuzzy logic. The wrinkling criterion uses an energy-based indicator inspired on the plastic
bifurcation theory. For necking, followed by bursting, a criterion based on the forming limit
curve is employed. Applying these two criteria, the process parameters (pressure and material
feed) are adjusted during the simulation via a fuzzy knowledge based controller. This leads to
the pressure curve profile with increasing pressure segments with varying gradients. The
limitation in this method is not being a ‗ready to use‘ scheme and its dependence on the
Engineers experience. Though a knowledge base is used to provide information on failure, a
‗database‘ knowledge base developed with simulations would enhance the loading path
development. The analytical methods above are also limited in that there has to be a change
in the design of the pressure curve whenever there is a change in the geometry variables of
16 Material feed curves have been developed by methods such as adaptive, fuzzy logic and
analytical. The adaptive method discussed by Aue-U-Lan and group, [Aue-U-Lan et al.,
2004] uses the principle where the material feed is increased till the onset of wrinkling (effect
due to excess material feed) is detected and maintained at a constant till the onset of bursting
(effect due to excess pressure) is detected. This interchange of material feed and pressure
goes on till the end of the forming time. This method takes time in adjusting the process
parameters and is suitable for simple bulge shapes as mentioned by Jirathearanat, (2004).
Shu-hui and group [Shu-hui et. al., 2008] developed loading paths using a knowledge
database that operated with fuzzy logic algorithm from a simulation database library with
necking and wrinkling indicators obtained from simulation results, which are used as the
input for the fuzzy logic control. The output sets of the fuzzy logic control were used for
adjusting the loading path. Ray and MacDonald [Ray et. al., 2004] developed an intelligent
fuzzy load control algorithm that operated by bringing much axial feed as possible to the
ends of the tube while simultaneously keeping internal pressure low. The fuzzy methods
above are time consuming in designing a loading path in response to a slight change in
geometry or change in the family type and further assumes that the coefficient of friction is a
constant value whereas it varies during the hydroforming process. The analytical method of
determining the maximum material feed (total stroke) discussed by Asnafi (2004) develops
the stroke as a function of the length of the tube and yield strength. This is limited by the
17 Potential ways of improving the loading path to reduce design time include developing the
pressure curve that is adaptable to various THF parts. This can be in the form of a polynomial
curve with end of the polynomial with a value of one. The maximum pressure values that are
mapped to this polynomial profile can be determined based on various variables. The
development of a database with the ability to adjust the loading path with various parameters
that vary during the process such as the friction coefficient would enhance the accuracy of
the loading path. The database also has the capability of storing various simulations, suitable
for establishing searches for the optimal loading paths whenever there is a change in the
variables used to develop the simulations. This close examination in the development of the
loading paths is necessary to avoid part failures discussed below.
2.2.3. THF Failure Modes
The three failure modes below discuss the forming limits in THF.
Wrinkling- is commonly observed in short tubes with relatively thin walls (i.e. high
diameter/thickness ratios) according to Koc and Altan, [Koc et. al., 2002] and is as a
result of much material feed and less pressure. Initiation and growth of wrinkles are
influenced by many factors such as stress ratio, material properties, geometry of work
piece and contact conditions. In the study by Koc and Altan [Koc et al., 2002], the
critical axial compressive stress and force for wrinkling to occur are directly affected by
the strength of the material strain hardening, thickness and effective strain. In order to
reduce wrinkling internal pressure has to be increased during the process and more so
18 Buckling – similar to wrinkling this occurs where the internal pressure is less and is
observed in long tubes with relatively thick walls (i.e. low diameter/thickness ratios)
[Koc et al., 2002] during the initial stages of deformation when strain level is very
small. To avoid buckling, the free length has to have a certain relation with twice the
outer diameter based on the ratio of the original outer diameter to thickness [Asnafi,
1999]. The critical axial compressive stress and force for buckling [Koc et al., 2002] for
tubes are dependent on the length, (inversely proportional to the square of the length).
Bursting- is due to excessive pressure that leads to excessive thinning. Bursting is
irrecoverable and hence detecting onset of bursting (referred to as ‗necking‘) is very
important. In order to avoid bursting material feed is provided during the process and
maximum internal pressure should be attained when the tube wall is resting against the
die cavity wall.
For best results of Tube Hydroforming, Dohmann and Hartl [Dohmann et al., 1997] proposed
designing the loading path within the process window as shown in Figure 2-5. The process
window occurs above the yield zone which is the limit where the material begins to deform
plastically. The material feed necessary should provide a force above the force needed for
19 Figure 2 - 5 Process Window and Failure Modes
2.3 ERRORS AND UNCERTAINTIES
Errors and uncertainty occur in manufacturing and vary with the manufacturing equipment
and operations performed. Press machinery has various sources of error and uncertainty
depending on the type of press and function performed. Vibration is more prevalent in
mechanical presses than hydraulic presses. Qin and group [Qin et al., 2004] discuss
dimensional errors associated with forward extrusion. Balendra and groups [Balendra et al.,
2000; Balendra et al., 2004] have done considerable research into errors in forming processes
including die deflection that arises from neglect of die elasticity during FE simulation of dies.
Vibration errors due to ram motion [Badrinarayan et. al., 2004], thermal errors in precision
machining [Hao et. al., 2008] and force induced errors in milling [Ratchev et. al., 2005] are
some of the common errors that lead to dimensional and form errors [Zhou et. al., 2004 ] in
the final component. The presence of friction is a common source of error [Ou et. al., 2002]
20 The undetected variation of friction leads to underestimating the effect of friction. Large
amounts of frictional force during a machine process lead to the work tool experiencing large
forces that can lead to tool wear. Some of these errors occurring in manufacturing affect the
THF process as discussed below.
2.3.1. THF Process Sources of Errors and Uncertainty
Common errors and sources associated with THF are categorized based on the area of
occurrence are shown in Table 1. The ‗occurrence‘ is the general term to show category of
the error. As shown in Table 1 errors can be generally classified as process errors that occur
due to inappropriate amounts of the forming inputs, loss errors that are associated with
decrease in the effect of applicants (that are subject to loss), equipment errors that are
associated with the working of tools and equipment, material errors that are associated with
the material blank and indirect errors associated with preprocessing stages such as Finite
Element Analysis (FEA) results. This makes THF a highly nonlinear system.
The Figure 2-6 shows the different stages in the process. The stages shown involve:
The generation of simulated results with FEM for material curve where errors include
dies being considered rigid neglecting die elasticity.
Development of pressure curves where analytical designs consider various parameters
that may include imperfections due to inhomogeneous and anisotropic materials [Koc
21
Table 1 Sources of Error in Tube Hydroforming
Occurrence Errors Sources
Process Buckling Excess material feed
Bursting Excess Internal pressure
Wrinkling Excess of material feed and pressure
Losses Leakage Broken seals, Imperfect tool-punch contact due to unbrushed tube ends
Friction Poor lubricant application
Lubricant loss/thinning Environmental effects, i.e. temp on lubricant Equipment Cylinder seal friction/valve friction Broken seal/quality & quantity of lubrication
Inaccurate position of sensor Measurement inaccuracies Tool wear /poor surface quality Friction
Vibration Environmental effects/foundation Heat increase-high cycle time Lack of coolant
Actuator nonlinearities Positioning error/ motion nonlinearity Machine frame deflections Assembly errors/ poor guiding systems Controller variations Control errors such as electrical noise Flow saturation in valves Flow nonlinearity
Tool position error Alignment issues with repeatability Material Change in properties Presence of high stresses
History defects Material imperfections-tube ends not perpendicular to longitudinal axis
Weld line weakness Weld line properties differing from other part of the tube
Localized deformation Incorrect material flow-inaccuracy of flow stress
Poor surface quality Poor ejection methods. Indirect, i.e.
Software Issues
FEA solution errors Arithmetic tolerances, lower bound solutions Modeling Inaccuracies Limited Simulation power
FEA Assumptive errors Neglecting effect of die elasticity [48]
Controller communication between the press and the loading path where remote
communication may be affected by electrical noise or heavy communication traffic on
the network hence lowering the performance efficiency.
Hydraulic equipment to carry out instruction from the PLC where uncertainties and
22
Pressure Pmax Equation Length of tube, L
Pre-design errors
Length to Protrusion, Lb Length to Protrusion, La
Diameter of tube, OD History Defects
Weld Line Defects
Thickness of tube, t
Material model approximations
Strain Hardening, n Strength of Material, K
Material Feed Coeff. of friction, mu
Pressure Booster Errors
Press Deflection Vibrations Valves Cylinder Controller Leakage Valve Friction Wear and Heat Controller noise
Tuning approximations
Valve Flow nonlinearity
Mass uncertainty Damping uncertainty Stiffness uncertainty Tool-Workpiece Friction LOADING PATH DATABASE
FEM Computational limitations Die elasticity Neglect
Sensor Inaccurate position
Machine deflection
THF Part
Weld line weakness
Historical defects Poor surface quality Property Change Sensor
Inaccurate position Machine deflection
Pressure
Force or Displacement Ref input to PLC Signal to Valves Flow to Cylinders Material feed & Internal Pressure Simulations for Database
Figure 2 - 6 Errors and THF associated Stages
Other errors are related to process set up where misalignment and tube imperfect edge
conditions may lead to eccentric loading [Koc et. al., 2002]. These errors require
23 2.3.2. Introduction to Error Compensation
Error compensation is the event of offsetting a variable or a process path in order to achieve a
desired result where the difference between the desired result and the outcome is due to
errors. Error compensation is used to assist correct the difference with the goal of increasing
the quality of products and reduce the costs of production.
2.3.3. Methods to Error Compensation
Error compensation models studied by Zhou and group and Ramesh and group [Zhou et. al.,
2004 and Ramesh et. al., 2000] are categorized as either online models where errors detected
are compensated within the same process operation or offline models where errors are
measured before or after a process to be utilized in subsequent operations. Database libraries
that contain knowledge for comparison to predict the amount of error anticipated (offline
model) have been developed [Balendra et. al., 2000; Hao et. al., 2008]. Other database
libraries have been developed involving compensation algorithms for virtual processes [Chen
et. al., 2004; Ratchev et. al., 2005] (online model). Other efforts ventured to compensate
errors involve numerical methods [Holecek et. al., 2005], feedback systems [Hao et. al.,
2008], Fuzzy control [Park et. al., 1992], optimization schemes [Gelin et. al., 2006] and
adaptive methodology [Xia, 2000]. The challenge is to develop a system with real-time error
compensation involved during actual process.
Errors, particularly frictional errors, in hydraulic cylinders have been researched. Sohl and
24 taking friction within the axial cylinder as a disturbance to the system and hence using
controllers to reject the disturbance. Olsson and group [Olsson et. al., 1996] studied actuators
based on velocity tracking, developed friction compensation for actuators by taking the force
applied to be proportional to the control signal. Compared to THF process this internal
cylinder frictional error is less than the frictional error occurring at the interfaces between
tube and die. Process control provides enlightenment on the effect of errors in manufacturing
processes and the need for compensation. This is crucial for THF processes where proper
process control is required in applying the loading path in order to inhibit part failure modes.
2.4 PROCESS CONTROL
2.4.1. Process Control in Manufacturing
Process control has been utilized in various manufacturing sectors such as wastewater plants,
distillation processes, and aerodynamic systems. The common control methods are open-loop
and closed-loop control. Open loop control is limited in that it does not track the difference
between actual and desired values. This limitation does not exist with closed-loop control.
Nachtwey [Nachtwey, 2007] comments that open-loop control can be used in combination
with closed-loop control for different parts of the machine cycle such as open loop used in
the retract direction to quickly open a press to eject a part and closed loop used in forming
the part. Closed loop control is favorable for applications that require following a profile
path, synchronization, a high degree of flexibility, accuracy, and speed; or the ability to
25 Closed-loop control makes use of a controller to adjust the signal to correct the difference
between actual and desired values. Common controllers used are the
Proportional-Integral-Derivative (PID) controller, Proportional-Integral (PI) and Proportional- Proportional-Integral-Derivative (PD)
controllers.
Some of the advances in process control in manufacturing involve the ability to compensate
for variations in the machine‘s hydraulic characteristics without manual intervention. This
has been done for the injection molding industry and used in companies such as JVH
Engineering, Inc in Michigan, US [JVH, 2010]. This compensation is done during each
machine cycle by comparing actual machine process variables with the desired set points and
then adjusting the control output to the hydraulic valve amplifiers to compensate for any
differences or errors that may have occurred in the previous cycle of operation.
Databases have been used as libraries for storing experience information, material and tool
knowledge. ThyssenKrupp [Thyssen Krupp, 2001] developed a material database library
with the benefit of assisting the user in selecting a material for an application before
simulation or prototyping. Much is desired regarding the use of databases online for
information during the manufacturing process. Cylinder positioning has been done such as by
Delta computer systems [Delta motion, 2009] with controllers and feedback from
26 2.4.2. Process Control Methods- Feedback System
The feedback system has been crucial in the advancement of control in manufacturing. This
method of control is commonly appropriated for adjusting input parameters via a controller
based on the measurement of the output parameters. Sensors are used to measure the output
and provide feedback to the control unit, which then compares the obtained signal (output)
versus the desired (reference) signal and provides a corrective action. Block diagrams are
commonly used to represent the schematics for feedback control as shown Figure 2-7 below
where r is the reference signal, e is the error, u is the control signal, y is the actual output.
Figure 2 - 7 Block Diagram with Closed Loop model in THF
Some of the kinds of feedback for dynamic systems are position, velocity, force and pressure
feedback where displacement sensors are for position feedback, tachometers are for velocity
feedback, load cells for force feedback and pressure transducers for pressure feedback.
Though placing a load cell in most metal forming processes is difficult due to the high forces
and/or pressure, force sensors have been used in processes such as the deep-drawing press
[Wagener et. al., 2001] where sensors are connected to connecting rods or placed under the
die. In the absence of load cells, pressure providing differential cylinder motion can be
27 The controller which provides a signal to the plant in response to the difference of the output
and reference has been designed for cylinder motion with various techniques such as PI
controllers [Lazic et. al., 2007], PID controllers [Zhao et. al., 2005], controllers based on loop
shaping approach [Tsai et. al., 2009] and H∞ techniques [You et. al., 2006]; for the purpose
of position tracking [Mihajlov et. al., 2002] and force tracking [Sohl et. al., 1999; Zhang et.
al., 2007]. In the above designs the focus was on general motion of the cylinder. Some have
further discussed the motion of the cylinder in relation to the environment being acted upon.
Niksefat and group [Niksefat et. al., 2001] discuss the need for controllers involved in motion
control of cylinder actuators interacting with manufacturing automation platforms and
material handling environments. This interaction leads to variations in operating conditions
and component degradation resulting in design parameter change. Tar and group [Tar et. al.,
2005] designed a PID controller for an electric servo-valve operated hydraulic cylinder under
unknown external disturbance forces The above researchers designed the forces with a spring
(operating within the elastic range) and less is known about the effect of a PID controller in a
system interacting with a deformable body (beyond the elastic range). The THF process
poses the challenge and below is a discussion on control for the THF.
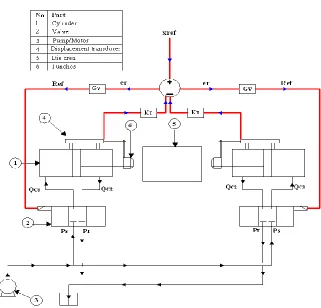
2.4.3. Process Control in THF – The Hydraulic Unit
The THF process involves introducing the work piece (tube) to the die, providing reference
loading path instruction to the press control system using software programs. The control
system instructs the equipment by sending signals (such as voltage) to the flow source which
28 The equipment used for THF mainly the hydraulic press, suitable for its capability to provide
internal fluidic pressure into the work piece and provide material feed via valves and axial
cylinders. The Figure 2-8 shows the sample schematic of the THF control system. The
control task involved in the Figure 2-8 is tracking the position of the cylinder, xref, using a
controller, Gv, desired to reduce errors, er, the difference between the reference signal Ref,
and output of the cylinder.
Figure 2 - 8 Sample Control System for a THF Press
In the industrial sector different companies involved with THF have developed various
29 Interlaken [Interlaken, 2010] developed a system with various features including: the ability
to switch between stroke controlled and force controlled loading paths within an operation
cycle, the ability to control the velocity of the cylinder or pressure flow rate from the booster,
complex actuator motion including ramp and sinusoidal and sequence control which includes
guiding forming steps by events or by time. These advances show the growth of process
control in THF. Error compensation during process control is desired to realize better THF
performance. Suggested methods of THF error compensation are discussed below.
2.5 SUMMARY AND FUTURE AREAS OF RESEARCH
Tube hydroforming process has been reviewed and discussion carried out on the loading
path. This path is prone to failures due to the dual application of material feed and internal
pressure. Various errors affect the THF process and can be broadly categorized into three
parts: errors affecting the design of the loading path (affecting the design of the material feed
and pressure), errors associated with the application of the loading path (discussed as the
failure modes) and errors associated with the result of the application of the loading path
(discussed as equipment errors affecting the output of the loading path). This work proposes
handling the above issues by focusing on the need to:
i. Develop an interactive database scheme for generating loading paths with less
computing time.
ii. Study the dominant errors in material feed and effects on the loading path
30 iv. Study the application of database systems and potential for use in real time processes.
v. Develop real-time error compensation methods that address the dominant loading path
errors and equipment errors during the process.
vi. Develop tube hydroforming system models involving the equipment parameters.
vii. Study the effect of the different controller designs and applications in Tube
Hydroforming
viii. Develop feedback process control to enhance the error compensation schemes and
review the effect of position, velocity and force control
ix. Analyze the performance of real time communication between the loading path and the
press. This involves reviewing the comparisons of remote control and the alternatives to
Data Dynamic Exchange (DDE).
This work focuses on specific items listed above. Item (i) is handled by developing an
analytical approach for the pressure curve and generating material feed curves by the
development of a database with interpolation schemes. These two items are developed into a
Database Generating Loading Path Scheme (DGLPS) with a user interface for parameter
inputs. This method is suitable for reducing computation time in developing loading paths,
and hence cutting back on costs and proving efficient for mass production systems. Item (ii)
is achieved using Design of Experiments (DOE) technique to compare the errors due to
material, geometrical and tribological properties. Item (iv) is performed by using the database
developed from DGLPS and applying to real time Tube hydroforming process. This is
31 Item (vi) is addressed with a spring model representing the environment and a PID controller
proposed to handle Item (vii). Item (viii) is tackled with the design of the Real-Time Stroke
32
CHAPTER 3:
DATABASE DEVELOPMENT FOR TUBE HYDROFORMING
LOADING PATHS
This section of the research focuses on obtaining a loading path from a database based on
various variables. The loading path is formed by plotting the material feed curves and
pressure curves against each other. This chapter will review the use of databases in loading
path design and discuss the Database Generated Loading Path Scheme methodology and
operation. An analysis for developing the maximum internal pressure is discussed based on
the geometrical and material variables of the Bulge Shape. This maximum pressure is
mapped to a pressure profile to develop the pressure curve (pressure vs. time). Material feed
case studies are developed with the Database Generated Loading Path Scheme and compared
to FEA simulations.
3.1 DATABASE USE FOR LOADING PATH DESIGNAND GENERATION
Methods to design the loading path have been mentioned in section (2.2.2). The database
employs an analysis to develop the maximum value of pressure and interpolation schemes to
develop the material feed curve. A comparison between the methods mentioned in section
(2.2.2) for developing loading paths and the database is given in Table 2. In the Table 2 the
term ‗Method‘ refers to the type of design used to obtain the loading path. ‗Maximum
pressure‘ is related to the scheme used to obtain the maximum pressure. ‗Pressure Curve
33 ‗Material Feed Profile‘ is the scheme used to obtain the material feed and ‗Loading Path
Request‘ is the computation time required to generate a loading path.
Table 2 Summary of Loading Path Design Methods
Method EMPIRICAL ANALYTICAL ADAPTIVE DATABASE
Maximum Pressure
Use of FEM/ Trial and error
Use of Equations Use of Equations / FEM
Use of Equations / FEM
Pressure Curve Profile
Linearly to Maximum value
Linearly to Maximum value
Linear and constant profiles
Polynomial
Material Curve Profile
Linear to a Maximum value
Linear to a Maximum value
Linear and constant profiles
Non-linear
Material Feed Profile
Use of FEM Use of Fuzzy logic or FEM
Use of FEM Interpolation Scheme
Loading Path Request
Fast but limited to few variables
Slow Slow Fast and efficient
for multiple variables
The database contains sets of simulated data, established based on three classifications of
variables given below (more discussion in section (3.2)):
Geometric parameters – these include the geometrical aspects of the tube such as tube
length, tube diameter and tube wall thickness (t).
Material properties (strength of material (K) and strain hardening exponent (n))
Tribological parameter (coefficient of friction (µ)).
These variables form the set variables required during the performance of the database. The
database is further developed with Microsoft Excel macros that perform various functions in
the database such selection of the type of family, requesting the set variables from the user
using input boxes, developing the pressure curve, performing interpolation algorithms for the
34 The macros also gather the data from the simulation and store the loading path for use in the
real-time error compensation scheme. More discussion on the use of macros in the error
compensation scheme is in Chapter 4.
3.2 DATABASE GENERATED LOADING PATH SCHEME METHODOLOGY
The parts used for this database can be broadly grouped into ‗families‘ based on the final
shape obtained. This leads to bulge type and protrusion type such as Single and Double T-
Shape with the protrusion of the tube at right angle to the tube axis (angle of protrusion to
tube axis is α); and Single and Double Y-Shape with the protrusion of the tube at an angle
less or greater than right angle to the tube axis. The database contains sets of simulated data
for various THF families. Figure 3-1 shows the cross-section of the families.
Figure 3 - 1 THF Families in the Database
The classification of variables i.e. geometrical, material and tribological variables are
referred to as ‗input parameters‘ since they are provided by the user into the database in order
to generate a loading path. All input parameters apart from µ are used in the analysis for
Bulge Shape Single T Shape Single Y Shape
35 developing the maximum pressure for the pressure curve as further discussed in section
(3.5). Thus variations in the coefficient of friction will not affect the pressure. The material
feed curves are developed based on simulations available in the database. Each simulation is
created with a unique set of 10 variables i.e. a set of (Lt, La, Lf, h, OD, t, K, n, µ, α) the
geometric parameters are illustrated in Figure 3-2.
Figure 3 - 2 Input parameters used in Simulation
3.2.1. Development of Simulated Sets of Loading Paths from FEA
The THF family shape models are simulated with ABAQUS Explicit, with the die modeled
with solid elements and the deformable tube with shell type elements. The simulation process
time is 0.01s. Steps involved are:
1. Creating a loading path model design where the initial tube geometry is based on the
following constraints:
Outer Diameter (OD) of the tube should be between 25mm to 40 mm for Single T and
Y families and between 30mm and 40 mm for Bulge, Double T and Y Families.