ABSTRACT
JAVANMARDI, ASHTAD. Strategies and Predictive Models for Improving Workflow Reliability in Construction Production Systems. (Under the direction of Dr. Min Liu).
© Copyright 2019 by Ashtad Javanmardi
Strategies and Predictive Models for Reducing Workflow Variability in Construction Production Systems
by
Ashtad Javanmardi
A dissertation submitted to the Graduate Faculty of North Carolina State University
in partial fulfillment of the requirements for the degree of
Doctor of Philosophy
Civil Engineering
Raleigh, North Carolina 2019
APPROVED BY:
_______________________________ _______________________________ Dr. Min Liu Dr. Edward J. Jaselskis
Committee Chair
DEDICATION
BIOGRAPHY
Ashtad Javanmardi is the second of four children born to Parvin and Shapur Javanmardi in Mumbai, India in 1984. He grew up in Tehran, the capital of Iran, and graduated from Firooz-Bahram High school in 2002. Ashtad received his B.S. degree in Civil Engineering from K. N. TOOSI University of Technology in 2007 and his M.S. degree in Construction Engineering and Management from Iran University of Science & Technology in 2011 in Tehran, Iran.
ACKNOWLEDGMENTS
This dissertation is the end of my Ph.D. journey. It would not have been possible to finish this journey without the support and help of several individuals I would like to acknowledge.
Mashayekhi, Mr. Rabia Omer, Mr. Abdullah Alsharef, and Dr. Brad McCoy for extreme kindness, heartfelt friendship, and lifting my spirits when I needed it the most.
TABLE OF CONTENTS
LIST OF TABLES ... ix
LIST OF FIGURES ...x
CHAPTER 1. INTRODUCTION ...1
1.1 Background and Need ...1
1.2 Research Objectives ...3
1.3 Organization of the Dissertation ...6
CHAPTER 2. BENEFIT OF COOPERATION AMONG SUBCONTRACTORS IN PERFORMING HIGH-RELIABLE PLANNING ...7
2.1 Abstract ...7
2.2 Introduction ...8
2.3 Literature Review...10
2.3.1 Work plan Reliability (WPR) ...10
2.3.2 Cooperative Game Theory ...12
2.4 Method ...15
2.4.1 Simulation Model...16
2.4.2 Cost Model ...18
2.4.2.1 Direct Cost ...19
2.4.2.2 Indirect Cost ...19
2.4.2.3 Planning Cost ...20
2.4.2.4 Total Cost ...20
2.4.3 Subcontractors’ Cost Metrics Performing HRP ...21
2.4.3.1 Cost of HRP ...21
2.4.3.2 Net Benefit from HRP ...21
2.4.4 Traditional Benefit-Allocation Models ...23
2.4.4.1 Cost-Sharing Model ...23
2.4.4.2 Equal Net Benefit Sharing Model ...24
2.4.5 Contribution-Based Benefit Allocation (CBBA) Model ...24
2.5 Analysis and Discussion of Results ...27
2.5.1 Subcontractors’ Costs and Benefits of HRP (without Benefit and Cost Sharing) ...27
2.5.2 Traditional Benefit-Allocation Models ...28
2.5.2.1 Cost-Sharing Model ...28
2.5.2.2 Equal Net Benefit Sharing Model ...30
2.5.3 CBBA Model ...32
2.5.3.1 Distribution of Benefit Based on Cost Saving ...32
2.5.3.2 Distribution of Benefit Based on Time Saving ...33
2.5.3.3 Distribution of Benefit Based on Time-Cost Trade-Off ...34
2.6 Conclusion ...35 CHAPTER 3. IMPROVING EFFECTIVENESS OF CONSTRAINTS REMOVAL
3.1 Abstract ...39
3.2 Introduction ...40
3.3 Literature Review...42
3.3.1 Constraints removal and Workflow Reliability ...42
3.3.2 Meetings in Construction ...43
3.3.3 Information Theory ...45
3.4 Research Method ...48
3.4.1 Data Collection ...49
3.4.1.1 Project Description ...49
3.4.1.2 Weekly Planning Meetings ...51
3.4.1.3 Workflow Reliability ...53
3.4.2 Data Analysis ...53
3.4.2.1 Classification of Meeting Minutes ...53
3.4.2.2 Classification of PPC ...55
3.4.2.3 Entropy and Mutual Information Calculation ...55
3.5 Results and Discussion ...58
3.6 Conclusions ...67
CHAPTER 4. COMPARATIVE STUDY ON THE PERCEPTION OF CAUSES FOR CONSTRUCTION TASK DELAY IN CHINA AND THE U.S. ...70
4.1 Abstract ...70
4.2 Introduction ...71
4.3 Literature Review...73
4.3.1 Causes of Task Starting Time and Duration Delay ...73
4.3.2 Comparison between China and the U.S. Construction Productivity ...74
4.3.3 Construction Labor in China ...76
4.4 Method ...77
4.4.1 Questionnaire Surveys ...77
4.5 Analysis and Results ...82
4.5.1 Survey Responses ...82
4.5.2 Research Objective 1: To identify the most prevalent causes of task start time and duration delay for construction projects in China and compare them with those in the U.S. ...83
4.5.3 Research objective 2: To discover the underlying factor structure responsible for task starting time and duration delay in China...89
4.5.4 Research objective 3: To develop recommendations to assist construction companies to effectively address the potential causes of delay. ...94
4.6 Conclusions ...97
CHAPTER 5. TO WHAT EXTENT EXPERIENCE OF DELAY SHAPES MANAGERS’ MAKING-DO DECISION: A RANDOM FOREST APPROACH ...101
5.1 Abstract ...101
5.2 Introduction ...102
5.3 Literature Review...104
5.3.2 Construction Task Delay...106
5.3.3 Random Forest (RF) ...107
5.4 Method ...109
5.4.1 Questionnaire Survey ...109
5.4.2 Mann–Whitney U Test ...113
5.4.3 Random Forest (RF) ...114
5.4.4 Entropy and Information Gain ...118
5.5 Analysis and Results ...120
5.6 Conclusions ...130
CHAPTER 6. SUMMARY AND CONCLUSIONS ...132
6.1 Summary ...132
6.2 Conclusions ...135
6.3 Limitations and Recommendations for Future Research ...137
REFERENCES ...139
APPENDIX ...153
LIST OF TABLES
Table 2.1. Subcontractors’ cost and benefit of HRP without using cost and benefit
sharing models ... 27
Table 2.2. Subcontractors’ cost and benefit of HRP using cost-sharing model ... 29
Table 2.3. Subcontractors’ cost and benefit of HRP using equal net benefit sharing model .. 31
Table 2.4. Subcontractors’ cost and benefit of HRP using CBBA model (based on cost saving) ... 33
Table 2.5. Subcontractors’ cost and benefit of HRP using CBBA model (based on time saving) ... 34
Table 3.1. Sample classification of discussion items at weekly meetings based on constraints ... 54
Table 3.2. PPC clustering results: group average and range ... 55
Table 3.3. Steps for calculating entropy and mutual information ... 57
Table 3.4. Constraints removal discussion and PPC group numbers ... 58
Table 3.5. Entropy and mutual information for PPC in two categories ... 60
Table 4.1. Individual causes of task start time and duration delay ... 80
Table 4.2. Task start time delay rotated factor matrix ... 92
Table 4.3. Task duration delay rotated factor matrix ... 93
Table 5.1. Causes for task starting time and duration delay ... 110
Table 5.2. Average duration delay comparison based on making-do decision ... 121
Table 5.3. RF variable importance calculation based on RBA Margin Reduction for China ... 124
Table 5.4. RF variable importance calculation based on RBA Margin Reduction for the U.S. ... 124
Table 5.5. Uncertainty reduction in making-do by gaining information about experienced amount of delay due to the causes of delay in China ... 126
Table 5.6. Uncertainty reduction in making-do by gaining information about experienced amount of delay due to the causes of delay in the U.S ... 127
LIST OF FIGURES
Figure 2.1. Research methodology flowchart for allocating benefit of HRP ... 16
Figure 2.2. Single-line production system ... 17
Figure 2.3. Triangular probability distribution related to production capacity in LRP and HRP ... 18
Figure 2.4. Subcontractors’ LRP and HRP total cost without using cost and benefit sharing models ... 28
Figure 2.5. Decrease in benefit of subcontractors moving from HHHHHHH to LHHHHHH ... 30
Figure 2.6. Benefit allocation using CBBA model ... 35
Figure 3.1. Research design flowchart ... 49
Figure 3.2. A Bent cross section ... 51
Figure 3.3. Entropy and mutual information for constraints ... 62
Figure 3.4. Expected PPC improvement by constraints removal discussions in meetings ... 63
Figure 3.5. Chow-Liu tree for constraints removal discussion ... 65
Figure 3.6. Uncertainty reduction in PPC based on constraints removal discussions ordering ... 66
Figure 4.1. Top 5 causes of starting time delay for projects in China and the U.S. ... 84
Figure 4.2. Top 5 causes of duration delay for projects in China and the U.S. ... 85
Figure 4.3. Delay explained by each factor in the U.S. ... 95
Figure 4.4. Delay explained by each factor in China ... 95
Figure 4.5. Delay’s impact and level of difference ... 97
Figure 5.1. Random Forest (RF) model for variable selection ... 116
Figure 5.2. Number of input variables and misclassification rate for decision tree model .. 123
Figure 5.3. First node and its child nodes for decision tree in China ... 125
Figure 5.4. Uncertainty reduction in making-do knowing managers’ experienced delay .... 128
1.1 Background and Need
Construction projects resemble complex production systems in which a network of activities needs to be performed by different subcontractors (Ghoddousi et al. 2013). In this research “subcontractors”, also known as “trades”, resemble production units who perform specialty production tasks.
Workflow is defined as “the movement of information and materials through a network of production units, each of which processes them before releasing to those downstream” (Ballard 2000). Previous researchers have shown that workflow variability, defined as the quality of nonuniformity and inconsistency in release of work from the upstream crews (Hopp and Spearman 2000; Javanmardi et al. 2018), declines the project performance in different aspects, such as cycle time (Ballard 1999; Howell et al. 2001), labor productivity (Thomas et al. 2002, 2003; Liu et al. 2011), cost (Ballard and Howell 1994), and schedule efficiency (González et al. 2009).
Workflow reliability is defined as the extent to which a construction plan is an accurate forecast of future events. Percent Plan Complete (PPC) is used as an indicator for workflow reliability (Ballard 2000). PPC is calculated by dividing the number of tasks 100% completed at the end of a plan period to those tasks planned at the beginning of that plan period (Ballard 2000; Ballard and Howell 2003; Liu et al. 2011; Hamzeh et al. 2015). Higher PPC indicates lower variability in the workflow. According to Ballard (1999, 2000), PPC values are highly variable and usually range from 30% to 70% with an average PPC of 54%, thus illustrating the extent of workflow variability in construction.
Workflow can be managed effectively by increasing workplan reliability through implementing better planning strategies (Ballard and Howell 1998; Ballard 2000; González et al. 2010; Javanmardi et al. 2016). Ballard (2000) argued that although planning is the primary method for organizing construction activities, Critical Path Method (CPM) planning strategies do not ensure the reliable movement of work between trades. Therefore, Ballard (2000) introduced Last Planner System (LPS®) as a production planning and control system in
construction based on Lean production principles that aimed to improve the reliability of workflow. Instead of emphasizing deadlines, LPS® emphasizes removing constraints in the
make-ready process to produce more highly reliable short-term workplans (Hamzeh et al. 2015; Javanmardi et al. 2018).
To execute activities during the execution phase of construction projects, subcontractors need to remove constraints such as labor availability, material availability, equipment availability, prerequisite work readiness, space availability, detailed design and working method availability, external conditions (i.e. weather), etc. (Koskela 1999). This process is called “constraints removal” (Koskela 1999; Koskela 2000) and it is usually performed on a weekly basis during the execution of construction projects.
3. What are the similarities and differences between causes of task starting time and duration delay in China compared to the U.S.? How can international contractors prioritize the causes of delay to be targeted to get the “biggest bang for the buck” with respect to their project portfolio?
4. What are the critical preconditions for a “making-do” decision, where “making-do” refers to starting a construction task without having all constraints removed.
1.2 Research Objectives
The goals of the research effort are to develop methodologies and analytical models that can be used to improve construction workflow reliability. This research focuses on identifying the main causes of unreliable workflow and proposing strategies based on Lean construction principles to improve workplan reliability. The four research objectives are listed below.
Objective 1: To quantify the benefit of cooperation among subcontractors in increasing their planning reliability at an operational level of construction using several different, but common, incentive alternatives.
incentive-based approach for all subcontractors, compared to the “cost-sharing”, and “equal net-benefit sharing” models.
Objective 2: To examine weekly planning meetings of a largely self-performed highway project to identify resolution and prioritization of different types of constraints with respect to workflow reliability.
While removing constraints are important, it remains unclear which types of constraint should have the highest priority for discussion at weekly planning meetings to better manage the existing construction workflow. This research used a bridge construction project as a case study to collect detailed weekly meeting minutes of 18 weeks and production data of 475 construction activities. Information theory approach was used to develop a framework to measure the amount of uncertainty and information sharing among constraint discussions. A Chow-Liu tree was then developed to guide project managers on the optimum sequence for discussing constraints at meetings so meeting time will be spent efficiently on the most important items.
Objective 3: To identify differences between task starting times and duration delays in projects in China and the U.S and to compare the underlying factor structure responsible for those differences.
were identified and divided into eight constraint categories identified by Koskela (2000) and Wambeke et al. (2011). A questionnaire survey was administered to laborers, mid-level managers, and high-level managers working in construction projects in QingDao, ShanDong province of China in order to collect data on the amount of delay respondents experienced in their projects. The top-five causes of task starting time and duration delay were identified in China and were compared to ones in the U.S. Factor analysis was used to identify the underlying structure of causes of delay in China. The magnitude of delay caused by each factor and their similarity to the U.S. factors were identified. This study developed strategies based on impact-dissimilarity metrics to help international construction companies in developing effective strategies to reduce delay across their project portfolio.
Objective 4: To estimate the extent to which project managers’ experience of delay contributes to their future making-do decisions in China and the U.S.
Making-do, a decision to start work despite knowing that preconditions are not fully ready, has been referred as a type of waste in construction projects (Koskela 2004). This research conducts two surveys, one in China and one in the U.S., to find if delaying starting time of activities pays off in the future (less duration delay). Further analysis was done to find the critical causes of delay and preconditions which help to explain making-do decisions and reduce uncertainty in the decision-making outcomes. The findings help project managers to understand the difference and rationale in making-do decisions and have more efficient collaboration and communication when working in projects located in a foreign country.
a methodology to help improve planning efficiency with respect to workflow reliability as the project goes forward. For objectives 3 and 4, results from two surveys in China and U.S. were used to study the relationship between constraints, making-do, and task delays.
1.3 Organization of the Dissertation
Ashtad Javanmardi1; S. Alireza Abbasian-Hosseini2; Min Liu, A.M.ASCE3; and Simon M.
Hsiang4
1 Ph.D. Student, Dept. of Civil, Construction, and Environmental Engineering, North Carolina State Univ., Raleigh, NC 27695. E-mail: [email protected]
2 Ph.D., Dept. of Civil, Construction, and Environmental Engineering, North Carolina State Univ., Raleigh, NC 27695. E-mail: [email protected]
3 Associate Professor, Dept. of Civil, Construction, and Environmental Engineering, North Carolina State Univ., Raleigh, NC 27695 (corresponding author). E-mail: [email protected]
4 Professor, Department Chair, Dept. of Systems Engineering and Engineering Management, Univ. of North Carolina at Charlotte, Charlotte, NC 28223. E-mail: [email protected]
2.1 Abstract
As construction projects get larger and more complex, subcontractors can benefit from cooperation and by forming an alliance, such as partnering. Previous studies have discussed the benefit of cooperation or partnering among subcontractors and between them and other project stakeholders. However, there has been limited research to quantify the benefit of cooperation among subcontractors in performing high-reliable planning (HRP). Therefore, the purpose of this paper is to quantify the benefit of cooperation among subcontractors in increasing their planning reliability at an operational level. Although HRP reduces the variability in a production system that significantly benefits the downstream subcontractors, it requires every subcontractor to put more time, cost, and effort into the planning stage, which may not be cost-effective for upstream subcontractors. To model the described situation, a simulation model (built by simulation software) was integrated with a cost model that identifies the relationship between cost and work-plan reliability (WPR) level. By utilizing different
BENEFIT OF COOPERATION AMONG
benefit-allocation models and evaluating their solutions, the paper demonstrates that a contribution-based benefit-allocation (CBBA) model using a game theory framework can provide the most acceptable and incentivizing solutions for the benefit-allocation problem. This study contributes to the body of knowledge in lean construction by quantifying the benefit of subcontractors’ cooperation in increasing their planning reliability.
2.2 Introduction
During the construction phase of a project, subcontractors have a tendency to focus only on their own tasks and even sometimes work toward their own priorities without considering how their work affects the rest of the subcontractors’ tasks and the whole project outcome (Sacks and Harel 2006). However, because of existing interdependencies, any variation in subcontractors’ work plan can be transferred from one task to the next and causes cost overruns and project delays (Koskela and Howell 2001; Wambeke et al. 2011; Lindhard 2014). According to Matthews and Howell (2005), project team integration could be a promising solution to this problem because it promotes cooperation among subcontractors and motivates them to focus on project outcomes instead of individual outcomes. In this paper, the term cooperation represents the situation in which subcontractors “engage with others in a mutually beneficial activity” (Bowles and Gintis 2011).
responsibility of completing the project and shares any achievements and failures based on the “pain-share, gain-share” mentality (Yeung et al. 2007).
Partnering is a good example of practicing RC whereby subcontractors build a relationship among themselves and with other project parties to maximize the effectiveness of each participant’s resources (CII 1991). In fact, partnering is a code of conduct, or a formal attempt, intended to create a nonadversarial culture among subcontractors in which they can work together cooperatively, rather than competitively (Klee 2015). In this paper, no distinction was made between partnering and cooperation, and the terms are used interchangeably. As stated by Kumaraswamy and Matthews (2000), partnering between subcontractors could be limited to a single project based on a short-term agreement (project partnering) or could be extended over a series of projects based on long-term agreement (strategic partnering). Also, there are two different directions for subcontractors’ partnering: (1) vertical partnering [partnering with the general contractor (GC) or the client], and (2) horizontal partnering [partnering with other subcontractors (Asgari et al. 2014)]. Although various studies have considered the case of subcontractors’ partnering both in vertical (Love 1997; Kumaraswamy and Matthews 2000; Rahman and Kumaraswamy 2004; Hartmann and Caerteling 2010; Loosemore 2014) and horizontal (Perng et al. 2005; Asgari and Afshar 2008; Asgari et al. 2014) directions, few attempts have been made to quantify the benefit of subcontractors’ horizontal partnering in increasing their planning reliability. Therefore, the objective of this research is to demonstrate and analyze the benefit of cooperation among subcontractors quantitatively and accurately.
(WPR). The goal of this paper is to quantify the benefit of cooperation among subcontractors in increasing their planning reliability at an operational level. To this end, the authors examined benefit-allocation models by which subcontractors are able to distribute the future costs and benefits of high-reliable planning (HRP) among themselves in a fair and efficient manner. The desirable benefit-allocation model should find solutions that are both acceptable and incentivizing to all subcontractors and guarantee the sustainability of cooperation.
2.3 Literature Review
2.3.1 Work plan Reliability (WPR)
and Howell 1998). Once the workflow is stabilized, substantial improvement in operations becomes possible, and potential gains in time and cost savings can be realized (Alarcón 1997). By investigating real construction project case studies, previous researchers have confirmed that improvement in subcontractors’ planning reliability will increase project performance (Thomas et al. 2003; González et al. 2007, 2008).
Improving WPR requires more time, cost, and effort in the planning stage (Hajifathalian 2011; Howell and Liu 2012; AbbasianHosseini et al. 2016). Increasing the degree of WPR by several subcontractors in a single production line does not necessary result in increased benefit to all subcontractors. For example, HRP hardly increases the average productivity rate of the upstream subcontractors (Tommelein et al. 1999), and the savings due to the lower variation may not cover their additional cost in performing HRP. In contrast, some downstream subcontractors may experience significant benefits as a result of less variation in workflow due to upstream subcontractors performing HRP (Tommelein et al. 1999). This situation provides a loss of motivation for the upstream subcontractors to perform HRP unless all subcontractors agree on a pact to share the costs of HRP on that project and to distribute the benefits of HRP based on a predefined formula among themselves. Previous literature in the construction-management area has not thoroughly studied the possibility of subcontractors’ cooperation for increasing WPR and the associated beneficial opportunities. Also, to the best of the authors’ knowledge, there have been limited attempts to quantitatively allocate the benefit derived from HRP among cooperative subcontractors who commit to performing HRP.
2.3.2 Cooperative Game Theory
first is a noncooperative game theory, where players are concerned with their own interests and try to optimize their payoffs by selecting actions that are under their control. The noncooperative theory is based on the absence of any binding agreements between the decision makers. The second one is a cooperative game theory, where all players collectively pursue the maximization of the total wealth (benefit) that can be generated within the social decision situation at hand. In cooperative game theory, indeed, players can write a binding contract and determine how the generated benefit is going to be distributed among them.
cooperative game theory in this paper assumes a transferable utility (TU) game in which (1) each coalition can be assigned a single value as its payoff, and (2) payoffs achieved from HRP can be freely reallocated among coalition members (Jackson 2008; Asgari et al. 2014). In this paper, a cooperative game with transferable utility resembles a pair 𝑁, 𝑣 , where 𝑁 represents
all players (subcontractors) indexed by 𝑖 in the grand coalition. 𝑣: 2 ⟼ ℝ is called characteristic function which assigns to each coalition 𝑆 ⊆ 𝑁 a real-valued payoff 𝑣 𝑆 (also called coalition’s worth) that the players in that coalition can distribute among themselves (e.g., the total benefit of HRP). We assume that 𝑣 ∅ 0.
In the cooperative game theory, the allocation problem may be solved in a variety of ways, but according to the concept of core (Gillies 1959), an appropriate payoff vector 𝑖
𝑥 1 , 𝑥 2 , … , 𝑥 𝑛 should satisfy three criteria to be potentially acceptable by players and
coalitions. These desirable criteria are efficiency, individual rationality and coalitional rationality as shown by following equations (Asgari et al. 2013; Ferguson 2014):
𝑥 𝑖 ∈
𝑣 𝑁 2.1
𝑥 𝑖 𝑣 𝑖 , ∀ 𝑖 ∈ 𝑁 2.2
𝑥 𝑖 ∈
𝑣 𝑆 , ∀ 𝑆 ∈ 𝑁 2.3
In the Equation (2.1), the efficiency principle requires the total value of the grand coalition, 𝑣 𝑁 , to be fully divided among players. The individual rationality principle in the Equation (2.2), will be satisfied when the payoff allocated to any player, 𝑥 𝑖 , under the grand
coalition of players 𝑆, ∑∈ 𝑥 𝑖 𝑥 𝑆 , under the grand coalition to be at least as much as they could earn on their own.
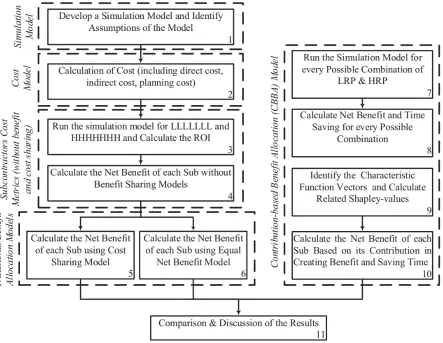
2.4 Method
Figure 2.1. Research methodology flowchart for allocating benefit of HRP
2.4.1 Simulation Model
to the task by a subcontractor is able to finish one unit of work per week. Also, all subcontractors have the same average production capacity (10 units/week), and production units completed by one subcontractor are prerequisites for the next subcontractor.
Figure 2.2. Single-line production system
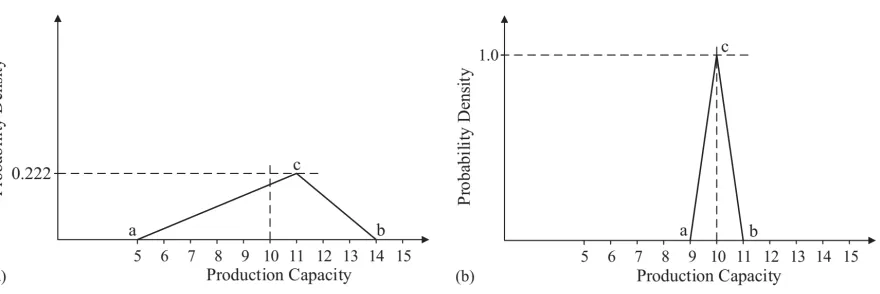
linear rising from 0 at 𝑎 to 2/(b-a) at c (peak value), then dropping down to 0 at 𝑏. The mean or average is 𝜇 𝑎 𝑏 𝑐 /3. Figure 2.3 shows that both LRP and HRP have the same average production capacity of 10 units/week. However, LRP distribution is associated with larger variability in comparison with the HRP.
Figure 2.3. Triangular probability distribution related to production capacity in LRP and HRP
The results presented in this paper are computed based on the average of 100 iterations (simulation runs) for each desired combination of L and H. The simulation results are as follows: (1) project duration: the time (weeks) it takes for completing the project (the project starts at the beginning of Week 1, when the first subcontractor starts his or her task, and finishes at the end of Week i, when the last subcontractor completes his or her task); (2) subcontractors’ task duration: the time (weeks) it takes every subcontractor to complete his or her task (production of 100 work units); and (3) subcontractors’ total capacity allocated: total number of workers all subcontractors allocate to perform their tasks.
2.4.2 Cost Model
cost, and (3) planning cost. Other components, such as rewards or penalties for timely completion or other costs, could be easily added for specific projects.
2.4.2.1 Direct Cost
Direct costs are those costs that can be easily associated with the production of one unit or with construction activity (Holland and Hobson 1999). In this study, the direct cost is proportional to the capacity (crews or workers) which subcontractors allocate to finish their planned tasks. In order to simplify, this study assumes a cost of $1 per capacity usage per week. However, this assumption does not impact the future results since they are proportional and will be presented in percentage. Therefore subcontractor 𝑖’s (𝑆𝑢𝑏) direct cost is:
𝐷 𝐶𝑎𝑝𝑎𝑐𝑖𝑡𝑦 𝑎𝑙𝑙𝑜𝑐𝑎𝑡𝑒𝑑 𝑏𝑦 𝑆𝑢𝑏 $1 (2.4)
where 𝐷 is the direct cost for the subcontractor 𝑖. 2.4.2.2 Indirect Cost
According to the Palmer et al. (1999) an “indirect construction cost can be defined as a cost that can be identified with a construction project but not a specific unit of production.”
Indirect construction costs contain 10% to 40% or more of the total cost and depend on the unique characteristics of a particular construction project (Becker et al. 2014). This paper assumes that the indirect cost for 𝑠𝑢𝑏, 𝐼, in each week is 30% of the total cost. Then the Equation (2.5) is derived as follows:
𝐼 0.3 𝐼 𝐷 (2.5)
2.4.2.3 Planning Cost
In this study, planning cost refers to the cost of production planning and control and not the project-level planning cost. Parties who perform the production planning need to investigate what needs to be done, break it down into tasks and figure out their optimal method and order, ensure that all prerequisites will be available, and assign each task to an operative or workstation (Koskela 2000). Previous researchers have considered the planning cost as part of the indirect cost (Becker 2012), and limited research has been conducted to investigate the relationship between the degree of WPR and the related planning cost. Abbasian-Hosseini et al. (2016), via a questionnaire-based survey, examined the relationship between the site managers’ efforts on on-site planning during construction and WPR, measured by the plan percentage complete (PPC). The survey was distributed to site managers of GCs and subcontractors in North Carolina. Analysis results of the 83 usable survey responses showed that those subcontractors with less effort (cost) spent on onsite planning have more variation in their weekly PPC ratio.
The current study assumes that in the typical situation (medium planning reliability), the cost of planning for the 𝑖𝑡ℎ subcontractor (𝑃 ) will be almost 7% of the subcontractor’s total cost. Also, LRP cost (𝑃 and HRP costs (𝑃 will be 67% and 121% of 𝑃 respectively.
Using Equation (2.5) the relation between planning cost and the direct cost is:
𝑃 0.07 𝐼 𝐷 0.07 0.43 𝐷 𝐷 0.1 𝐷 2.6
𝑃 0.67 𝑃 0.67 0.1 𝐷 0.067 𝐷 2.7
𝑃 1.21 𝑃 1.21 0.1 𝐷 0.121 𝐷 2.8
2.4.2.4 Total Cost
𝐶 𝐷 𝐼 𝑃 1 𝑥 𝑃 𝑥 𝑃 2.9
The second term in the above equation, 𝐼 𝑃 , corresponds to any other indirect
costs of subcontractor 𝑖 excluding their planning cost. Thus, with this formulation, planning cost will be included once in the calculation of total cost. In the Equation (2.9), 𝑥 is decision variable and it equals to one if 𝑆𝑢𝑏 does HRP, otherwise it’s zero.
2.4.3 Subcontractors’ Cost Metrics Performing HRP
Return on investment (ROI) is one of many ways to evaluate proposed investments because it compares the potential net benefit from an investment to its corresponding costs. Feibel (2003) calculated ROI by taking a ratio of benefit received as a result of an investment over the price of the investment and then multiplying it by 100 to establish a percentage that can be used as an indicator of performance (Equation (2.10)).
ROI = Net Benefit from Investment
Cost of Investment ×100 =
Net Benefit from HRP
Additional Cost of HRP×100 (2.10) When applied to reliable planning, calculating the ROI as a ratio of net benefit from HRP to the additional cost of HRP is suggested, because the potential savings resulting from HRP are considered benefits to subcontractors.
2.4.3.1 Cost of HRP
Cost of HRP is the cost of extra effort which 𝑖𝑡ℎ subcontractor should spend to increase the reliability of his or her planning.
𝐶𝑜𝑠𝑡 𝑜𝑓 𝐻𝑅𝑃 𝑓𝑜𝑟 𝑆𝑢𝑏 𝑃 𝑃 2.11
2.4.3.2 Net Benefit from HRP
Net benefit of HRP for Subi = Gross benefit of HRP for Subi – Cost of HRP for Subi (2.12) The first part in Equation (2.12), gross benefit, is the benefit before considering the planning cost. Practically, it can be obtained from two different sources: (1) future cost savings, which the subcontractor makes because of lower variation in the workflow (reduction in waste); and (2) any possible reward the subcontractor receives from the GC because of early completion of the subproject.
This study uses another definition for the net benefit of HRP. The net benefit for the
𝑖𝑡ℎ subcontractor is the difference of the total cost in the two situations: total cost when
performing LRP (𝐶 ), and total cost when performing HRP (𝐶 . By this definition and using Equation (2.12), Equation (2.13) can be written as follows:
𝑁𝑒𝑡 𝑏𝑒𝑛𝑒𝑓𝑖𝑡 𝑜𝑓 𝐻𝑅𝑃 𝑓𝑜𝑟 𝑆𝑢𝑏 𝐶 𝐶 (2.13)
are performing HRP) is not only because of the subcontractor’s investment in performing HRP. Actually, the bigger portion of the subcontractor’s benefit comes from the upstream subcontractors’ investments in performing HRP. This makes a benefit allocation problem hard because the benefit of a subcontractor’s investment does not reflect in his or her own benefit, and instead, it reflects in the downstream subcontractors’ benefits. For this reason, it is necessary to investigate benefit-allocation methods that consider benefit and cost sharing among the subcontractors.
2.4.4 Traditional Benefit-Allocation Models
In the following benefit-allocation models, subcontractors are considered as a team and not individually. They have agreed to increase their WPR to prevent future lost capacity and work extension so that they can achieve more benefits through saving and minimizing waste. For a better understanding of procedures in upcoming models, the reader can assume a common pool from which the subcontractors can borrow money to pay for the additional effort needed for improving their WPR. At the end, subcontractors should return the borrowed money to the common pool based on their predefined rule of dividing the total benefit and the total cost of HRP among themselves.
2.4.4.1 Cost-Sharing Model
In this scenario, subcontractors will pay a part of the total HRP cost based on the incremental gross benefit they could make as a result of team effort in performing HRP. Therefore, the cost of HRP for Subican be calculated as follows:
𝐶𝑜𝑠𝑡 𝑜𝑓 𝐻𝑅𝑃 𝑓𝑜𝑟 𝑆𝑢𝑏 𝐺𝑟𝑜𝑠𝑠 𝐵𝑒𝑛𝑒𝑓𝑖𝑡 𝑜𝑓 𝐻𝑅𝑃 𝑓𝑜𝑟 𝑆𝑢𝑏
The amount calculated by the previous formula is the ith subcontractor’s part of the total HRP cost, and the subcontractor should pay this amount back to the common pool. Consequently, the net benefit can be calculated using Equation (2.12).
2.4.4.2 Equal Net Benefit Sharing Model
In this scenario, the subcontractors pay for the HRP cost as a team and divide the net benefit equally among themselves. As a result, the net benefit for the ith subcontractor in this model is:
𝑁𝑒𝑡 𝐵𝑒𝑛𝑒𝑓𝑖𝑡 𝑜𝑓 𝑆𝑢𝑏 𝑇𝑜𝑡𝑎𝑙 𝑁𝑒𝑡 𝐵𝑒𝑛𝑒𝑓𝑖𝑡
𝑇𝑜𝑡𝑎𝑙 𝑁𝑢𝑚𝑏𝑒𝑟 𝑜𝑓 𝑆𝑢𝑏𝑐𝑜𝑛𝑡𝑟𝑎𝑐𝑡𝑜𝑟𝑠 2.15
This method is based on the “egalitarian allocation rule”, which considers the same contribution of subcontractors in creating the total benefit.
2.4.5 Contribution-Based Benefit Allocation (CBBA) Model
In this benefit-allocation model, net benefits (payoffs) for subcontractors are determined using game theory and Shapley-value notation on fairness. The Shapley value is an important topic in cooperative game theory. It is the expected marginal amount contributed by a player to a coalition (Shapley 1953). This method identifies each player’s degree of importance in creating the overall cooperation result (total benefit) and the payoff the player should reasonably expect (Forgó et al. 1999). By using the Shapley value, the total benefit obtained after cooperation can be fairly distributed among the coalition members (Owen 2013), and the distribution is based on the four axioms of fairness defined by Shapley (Gilles 2010).
(2.16)
where 𝑥 𝑖 is Shapley value of player 𝑖, N is a finite set of players, indexed by 𝑖; and|𝑁| is the size of N, S issubset S (S ⊆ N) represents a possible coalition of players. Therefore, 𝑆 ⊆ 𝑁/ 𝑖 is possible coalition of players could be formed without having player 𝑖 in them. 𝜈 𝑆
is worth of coalition S that can be distributed among the coalition members. Similarly, 𝜈 𝑆 ∪ 𝑖 is worth of a new coalition that has been formed by adding player 𝑖 to the former coalition
S.
In this Equation (2.16), the Shapley-value of subcontractor 𝑖, 𝑥 𝑖 , can be viewed as
capturing the average marginal contribution of the subcontractor 𝑖, where the average is over all the different sequences according to which the grand coalition could be built up from the empty coalition. If the subcontractor 𝑖 is added to the set 𝑆, the subcontractor’s contribution is
𝑣 𝑆 ∪ 𝑖 𝑣 𝑆 . Now, multiply this quantity by the |𝑆|! different ways the set 𝑆 could
have been formed prior to subcontractor 𝑖’s addition and by the |𝑁| |𝑆| 1 ! different ways the remaining subcontractors could be added afterward. Finally, sum over all possible sets 𝑆
and obtain an average by dividing by |𝑁|!, the number of possible orderings of all the subcontractors.
In this study, the Shapley value for Subiis the benefit allocated to that subcontractor based on the average marginal amount the subcontractor contributes to every possible coalition he or she joins. To calculate the Shapley values for the current problem, the following steps should be followed:
1- Determine all the possible coalitions that could be formed by subcontractors for increasing the planning reliability. In this study, there are 127 (2 1 ) different possible coalitions
𝑥 𝑖 1
|𝑁|! |𝑆|! |𝑁| |𝑆| 1 ! 𝜈 𝑆 ∪ 𝑖 𝜈 𝑆
𝑆⊆𝑁/ 𝑖
that can be formed by seven subcontractors, resembling every combination of low (L) and high (H) reliability. For example, the 126th coalition is consisted of six subcontractors {S1,
S2, S3, S4, S5, and S6} performing HRP.
2- Determine the worth or value of each coalition: The value of a coalition is a real number that the coalition’s members can distribute among themselves. In the construction industry there are two well-known and unarguably valuable parameters, time and cost. In the problem stated in this paper, a coalition has a value if the members of that coalition by themselves could make some benefit (save cost) or save time through HRP; otherwise, the coalition’s value is zero. The developed simulation model and the cost model are used to identify the benefit and the time-saving by each of above combination of players. The amount of cost and time saved by each coalition is determined with comparing the cost and the time of that coalition in the situation that none of the subcontractors are performing HRP (LLLLLLL).
3- Identify the characteristic function of the problem (game). The characteristic function is a function that describes the amount of collective payoff a set of players can gain by forming a coalition. In this problem, the characteristic function contains a set
𝑣 1 , 𝑣 2 , … , 𝑣 127 with 127 elements and each element (calculated from the step 2)
corresponds to its coalition.
2.5 Analysis and Discussion of Results
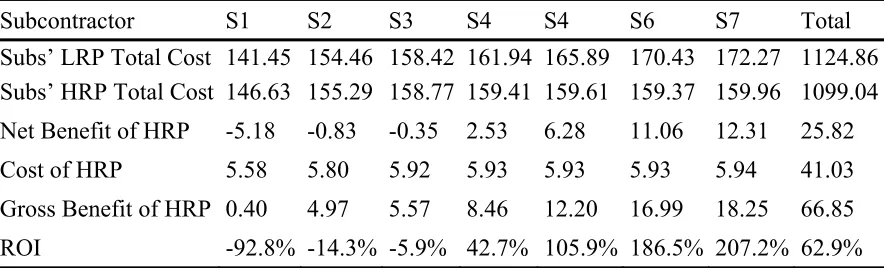
2.5.1 Subcontractors’ Costs and Benefits of HRP (without Benefit and Cost Sharing) To demonstrate the effect of WPR on subcontractors’ total cost, this study runs two different scenarios using the developed simulation model in this paper: (1) the situation when all subcontractors are performing LRP (LLLLLLL), and (2) the situation when all seven subcontractors are performing HRP (HHHHHHH). Total costs of subcontractors in these two situations are calculated based on the simulation results and the cost model introduced in the method section and are presented in Table 2.1.
Table 2.1. Subcontractors’ cost and benefit of HRP without using cost and benefit sharing models
Subcontractor S1 S2 S3 S4 S4 S6 S7 Total
Subs’ LRP Total Cost 141.45 154.46 158.42 161.94 165.89 170.43 172.27 1124.86 Subs’ HRP Total Cost 146.63 155.29 158.77 159.41 159.61 159.37 159.96 1099.04 Net Benefit of HRP -5.18 -0.83 -0.35 2.53 6.28 11.06 12.31 25.82 Cost of HRP 5.58 5.80 5.92 5.93 5.93 5.93 5.94 41.03 Gross Benefit of HRP 0.40 4.97 5.57 8.46 12.20 16.99 18.25 66.85 ROI -92.8% -14.3% -5.9% 42.7% 105.9% 186.5% 207.2% 62.9%
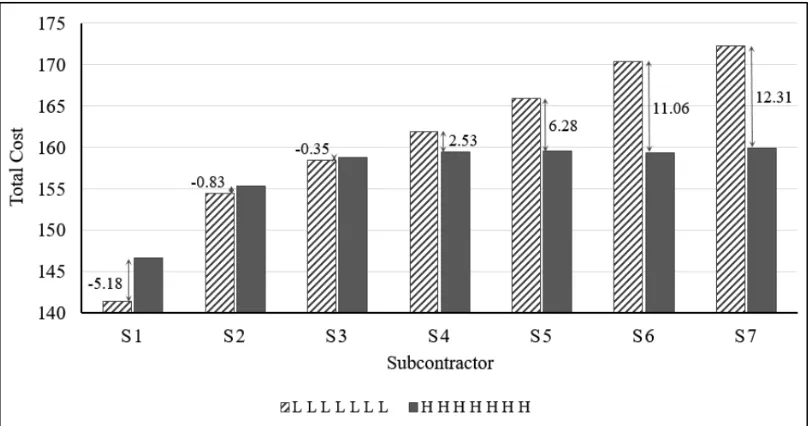
subcontractors decreases, downstream subcontractors experience less waste of their production capacity.
Figure 2.4. Subcontractors’ LRP and HRP total cost without using cost and benefit sharing models
This situation creates the following question (Tommelein et al. 1999): “Because upstream variation affects downstream performance, should downstream positions offer to pay for higher reliability upstream?” In construction projects, subcontractors will be more motivated to increase their WPR if they are assured of making future benefits for being reliable, either by other subcontractors or by the GC.
2.5.2 Traditional Benefit-Allocation Models 2.5.2.1 Cost-Sharing Model
possible to find the incremental net benefit of each subcontractor performing HRP. Table 2.2 shows that both the net benefit and the cost of HRP increase when moving from the first subcontractor to the last one. One can interpret that the downstream subcontractors invest in high reliability of upstream ones and receive some additional benefit (saving) from HRP of upstream subcontractors.
Table 2.2. Subcontractors’ cost and benefit of HRP using cost-sharing model
Subcontractors S1 S2 S3 S4 S5 S6 S7 Total
Gross Benefit of HRP 0.40 4.97 5.57 8.46 12.21 16.99 18.25 66.85 Gross Benefit
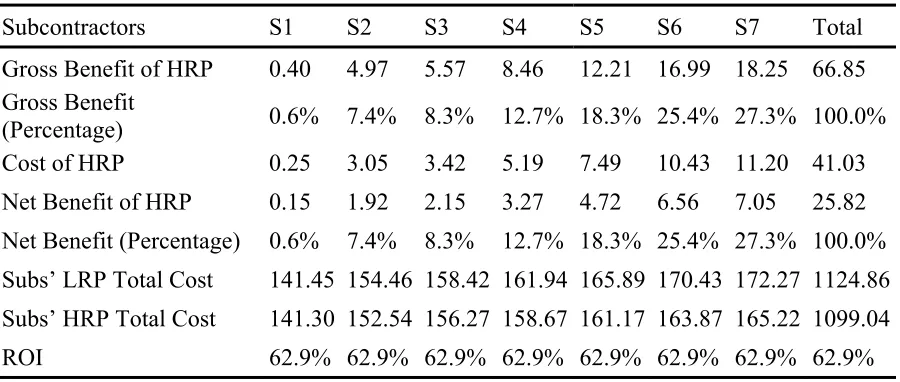
(Percentage) 0.6% 7.4% 8.3% 12.7% 18.3% 25.4% 27.3% 100.0% Cost of HRP 0.25 3.05 3.42 5.19 7.49 10.43 11.20 41.03 Net Benefit of HRP 0.15 1.92 2.15 3.27 4.72 6.56 7.05 25.82 Net Benefit (Percentage) 0.6% 7.4% 8.3% 12.7% 18.3% 25.4% 27.3% 100.0% Subs’ LRP Total Cost 141.45 154.46 158.42 161.94 165.89 170.43 172.27 1124.86 Subs’ HRP Total Cost 141.30 152.54 156.27 158.67 161.17 163.87 165.22 1099.04 ROI 62.9% 62.9% 62.9% 62.9% 62.9% 62.9% 62.9% 62.9%
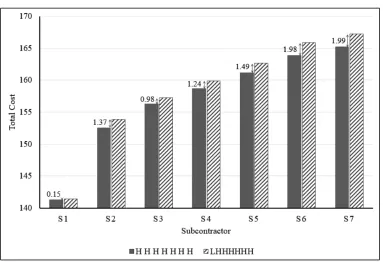
Figure 2.5. Decrease in benefit of subcontractors moving from HHHHHHH to LHHHHHH Figure 2.5 shows that, when S1 is not doing HRP, although the subcontractor will achieve $0.15 less benefit than before, other subcontractors’ benefit will decrease much more ($9.05 totally) compared to S1. According to the game theory literature, it could be said that the current benefit allocation model is not stable because it leads to an increased bargaining power of S1. This subcontractor can potentially use this power to threaten the other subcontractors with leaving the grand coalition unless the subcontractor receives a higher share.
2.5.2.2 Equal Net Benefit Sharing Model
Table 2.3. Subcontractors’ cost and benefit of HRP using equal net benefit sharing model
Subs S1 S2 S3 S4 S5 S6 S7 Total
Gross Benefit of HRP 0.40 4.97 5.57 8.46 12.21 16.99 18.25 66.85 Net Benefit of HRP 3.69 3.69 3.69 3.69 3.69 3.69 3.69 25.82 Net Benefit (percentage) 14.3% 14.3% 14.3% 14.3% 14.3% 14.3% 14.3% 100.0% Cost of HRP -3.29 1.28 1.88 4.77 8.52 13.3 14.56 41.03 Subs’ LRP Total Cost 141.45 154.46 158.42 161.94 165.89 170.43 172.27 1124.86 Subs’ HRP Total Cost 137.76 150.77 154.73 158.25 162.2 166.74 168.58 1099.04 ROI Inf 288.3% 196.3% 77.4% 43.3% 27.7% 25.3% 62.9%
Table 2.3 shows that the cost of HRP for the first subcontractor is negative. One can interpret that the equal net benefit sharing model not only waives the additional HRP cost for the first subcontractor, but also reimburses the first subcontractor the amount of $3.29 for being reliable. Because the cost of HRP increases by moving to the end of the line, it is possible to interpret that downstream subcontractors have invested more in HRP of the team compared to the upstream ones.
of motivation among subcontractors because they know the total benefit will be divided among them in an equal manner at the end, regardless of their participation level in performing HRP. 2.5.3 CBBA Model
In this section, the authors utilize cooperative game theory concepts and Shapley-value notations of fairness to determine fair and efficient solutions for the discussed benefit-allocation problem. The advantage of the CBBA model over the previous models is that it can consider the different levels of participation by subcontractors and their contributions to creating value in every possible coalition. Based on these contributions, the model distributes the total net benefit of grand coalition among subcontractors. When subcontractors improve their WPR in a team, they not only contribute to achieving future total savings within the team, but also contribute to decreasing the total time of the subproject undertaken by the team, which is undoubtedly favorable for the GC, and the team may receive some rewards as a result. Although subcontractors contribute to increasing the total benefit in the both scenarios, their role and level of contribution may differ in creating the total benefit in each of the aforementioned scenarios and depend on how the value of a coalition is defined.
2.5.3.1 Distribution of Benefit Based on Cost Saving
was greater than the total gross benefit that the members could achieve as a result of HRP. By having values corresponding to every possible coalition, it is possible to identify the characteristic function of the game and calculate the Shapley values using the MATLAB code. In the CBBA model, the Shapley values are the net benefits allocated to subcontractors. The results are shown in Table 2.4. Using the net benefit for each subcontractor and the gross benefits from Table 2.2, the cost of HRP can be calculated using Equation (2.12).
Table 2.4. Subcontractors’ cost and benefit of HRP using CBBA model (based on cost saving)
Subs S1 S2 S3 S4 S5 S6 S7 Total
Net Benefit of HRP 2.96 4.32 3.61 3.22 3.48 4.46 3.77 25.82 Net Benefit (percentage) 11.5% 16.7% 14.0% 12.5% 13.5% 17.3% 14.6% 100.0% Cost of HRP -2.56 0.65 1.96 5.24 8.73 12.53 14.48 41.03 Subs’ LRP Total Cost 141.45 154.46 158.42 161.94 165.89 170.43 172.27 1124.86 Subs’ HRP Total Cost 138.49 150.14 154.81 158.72 162.41 165.97 168.5 1099.04 ROI Inf 664.6% 184.2% 61.5% 39.9% 35.6% 26.0% 62.9%
Table 2.4 shows that the CBBA model allocates more benefit to the most downstream subcontractor (S7) compared to the most upstream one (S1). This means that S7 has contributed more in creating the total benefit (savings) compared to S1. S7 contributes to the total cost savings by his or her presence in the team and by putting into effect the upstream subcontractors’ effort. Actually, S7 could save more as a result of others’ HRP and covers the main portion of the team’s HRP cost.
2.5.3.2 Distribution of Benefit Based on Time Saving
marginal contribution to decreasing the subproject time in every possible coalition. Based on this definition, the value of all 127 coalitions was calculated using the simulation model. The Shapley values for this game were calculated and are presented in Table 2.5. Here, the Shapley values show the time (days) that a subcontractor could save on average when the subcontractor joins every coalition of other subcontractors. In this scenario, the share of every subcontractor is equal to his or her contribution to saving time in the grand coalition.
Table 2.5. Subcontractors’ cost and benefit of HRP using CBBA model (based on time saving)
Subs S1 S2 S3 S4 S5 S6 S7 Total
Time Saved 1.30 1.60 1.50 1.40 1.40 1.40 0.90 9.5 Time Saved (Percentage) 13.7% 16.8% 15.8% 14.7% 14.7% 14.7% 9.5% 100.0% Net Benefit (Percentage) 13.7% 16.8% 15.8% 14.7% 14.7% 14.7% 9.5% 100.0%
2.5.3.3 Distribution of Benefit Based on Time-Cost Trade-Off
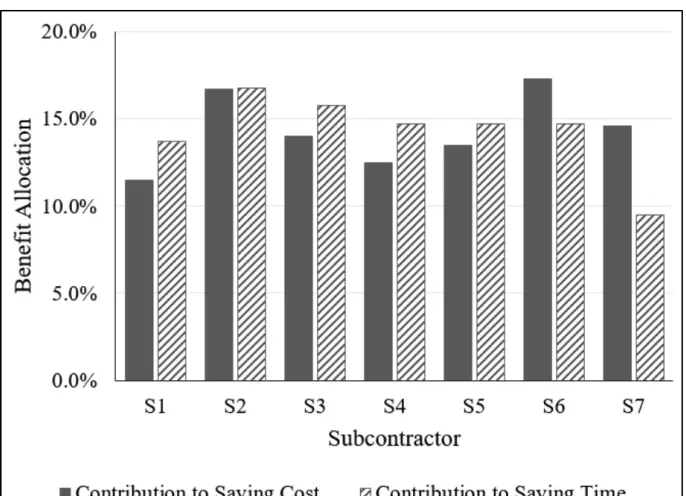
Figure 2.6 shows the benefit allocation under the CBBA model considering the contribution of each subcontractor in saving time and cost during the project. This model gives cooperating subcontractors the possibility for a trade-off between time and cost and to implement their desired weight for distribution of the total benefit of HRP. For example, if time and cost receive the same degree of importance (future reward for early competition will be the same as the additional cost that will be saved by subcontractors) in the future partnering, the new distribution of net benefit will be the average of net benefit distributions in Tables 2.4 and 2.5.
reducing the project total time, total lost capacities and total inventory buffer by increasing his or her plan reliability.
Figure 2.6. Benefit allocation using CBBA model
2.6 Conclusion
Results from applying the suggested model to Parade Game simulation indicated that having more subcontractors in a team makes short-term partnering more valuable, and subcontractors can achieve more benefits based on HRP. However, those subcontractors, individually or in a smaller team, cannot achieve incremental benefits from HRP because the benefit of lower variability in the workflow does not cover the cost of HRP. Moreover, the CBBA model can identify the key subcontractors who contribute more than others in saving costs within the team and decreasing the time of the subproject. It can help both subcontractors and the GC to manage the team more efficiently by accommodating those subcontractors that contribute more than others to the success of project.
Ashtad Javanmardi1, S. Alireza Abbasian-Hosseini2, Min Liu, A.M.ASCE3, and Simon M.
Hsiang4
1 Ph.D. Student, Dept. of Civil, Construction, and Environmental Engineering, North Carolina State Univ., Raleigh, NC 27695. E-mail: [email protected]
2 Ph.D., Dept. of Civil, Construction, and Environmental Engineering, North Carolina State Univ., Raleigh, NC 27695. E-mail: [email protected]
3 Associate Professor, Dept. of Civil, Construction, and Environmental Engineering, North Carolina State Univ., Raleigh, NC 27695 (corresponding author). E-mail: [email protected]
4 Professor, Department Chair, Dept. of Systems Engineering and Engineering Management, Univ. of North Carolina at Charlotte, Charlotte, NC 28223. E-mail: [email protected]
3.1 Abstract
Timely identification and removal of constraints is critical for improving workflow reliability. Construction project managers need to spend a significant amount of working time in various types of planning meetings to discuss, analyze, and remove constraints. However, the amount of uncertainty associated with each constraint, mutual information shared among constraints, and any information gained by addressing those constraints are not necessarily known with any great accuracy or precision. This research used a bridge construction project as a case study to collect empirical data on detailed weekly meeting minutes over 18 weeks, and the planned and actual starting and finish times of 475 activities. Information theory approach was used to develop a framework to measure the amount of uncertainty and information sharing among constraint discussions. A Chow-Liu tree was then developed to help project managers optimize the sequence of topics discussed so that meeting time may be spent more productively. Results from this particular study indicate that weekly planning
meetings need to strategically address “equipment availability”, “design and working method clarification”, and “prerequisite work readiness” issues since removing those constraints could improve workflow reliability by 5.6%. 4.9%, and 3.6% respectively. The contribution to the body of knowledge of this research was the development of a framework to utilize information-theoretic based approach to measure information exchange, uncertainty, and sharing in construction planning meetings. The method can be applied on other construction projects and the findings can help project managers plan and run meetings more effectively.
3.2 Introduction
Developing reliable workflow is critical for improving construction labor productivity. In order to make workflow reliable, construction project managers need to consider and remove at least seven constraints in planning meetings: design and working method, components and materials, laborers, equipment and tools, space, prerequisite work, and external conditions (Koskela 1999). Each of the seven constraints comes with a different level of uncertainty, which depends on various stakeholders’ capability and interaction. The constraints are also often correlated. It is not an easy task for project managers to evaluate and address the constraints in planning meetings effectively. The ever-changing dynamics and interaction on construction jobsites make the task even more difficult. In order to achieve the goal of reliable planning, construction site managers need to spend a significant amount of working time in planning meetings to communicate and negotiate with various stakeholders, including owners, residential engineering agents, designers, consultants, suppliers, manufacturers, local municipalities, and multiple subcontractors.
information exchange and consequently developing strategies to run planning meetings effectively to improve workflow reliability (Jang and Kim 2007, 2008; Lindhard and Wandahl 2011, 2012; Hamzeh et al. 2015, 2016; Wang et al. 2016). There are numerous alternatives for setting a meeting time frame, deciding on who should attend the meeting, choosing the meeting’s agenda and determining sequence (Schwartzman, 1989). Each of the decisions can make an important contribution to meeting effectiveness. Lacking a clear understanding on the mechanism of information gain and transmission in meeting process causes not only waste of time, but can also affect productivity losses.
information sharing among constraints, and the amount of information gain from constraints discussions.
3.3 Literature Review
3.3.1 Constraints removal and Workflow Reliability
Workflow is the flow of work from one crew to the next, where the work output of a crew is the prerequisite to the work performed by the successor (Abbasian-Hosseini et al. 2017). Workflow is reliable when works are completed as planned. Plan Percent Complete (PPC) measures workflow reliability, calculated by dividing the number of tasks 100% completed at the end of a plan period to those tasks planned at the beginning of that plan period (Ballard 2000; Ballard and Howell 2003; Liu et al. 2011; Hamzeh et al. 2015). Koskela (1999) suggested considering removing seven constraints in planning meetings to improve PPC. They are unclear/unavailable construction design and specifications, unavailable components and materials, unavailable laborers, unavailable equipment, unavailable space, incomplete prerequisite works, and adverse external conditions. In addition to the seven constraints, Lindhard and Wandahl (2012) suggested two additional constraints namely “unsafe working conditions” and “unknown working conditions” to emphasize the national laws and problems that often occur during excavations or refurbishment activities. In this research, the seven constraints by Koskela (1999) and “unsafe working condition” from Lindhard and Wandahl (2012) were used for analysis because they have a comprehensive and thorough coverage of the issues considered and discussed for this project in the planning meetings.
(TMR) measurement, Hamzeh et al. (2015, 2016) showed identifying and eliminating constraints during the make ready process influence the reliability of construction lookahead plans and impact on project duration. Liu (et al. 2011) found a positive correlation between PPC and productivity on an oil refinery project.
While several studies have addressed constraints removal (Jang and Kim, 2007, 2008; Lindhard and Wandahl, 2012; Hamzeh et al., 2015, 2016), there has been a lack of research on the relative importance of the different types of constraints to workflow reliability. Limited research was found to quantitatively measure effectiveness of constraints removal discussions, amount of information shared among constraints, and information gain from constraints removal discussion during weekly planning meetings. To fill in the gap of knowledge, this research used an information theory approach to develop a framework to measure the amount of uncertainty and information sharing among constraint discussions. Based on the findings, a Chow-Liu tree was built to recommend the optimum sequence to discuss constraints in construction planning meetings for this type of project.
3.3.2 Meetings in Construction
conducted communication research within the Swedish construction industry. By studying two Design-Build and two Design-Bid-Build projects, Carlsson et al. found the most used method of communication was formal meetings, with 57% of all contacts being made during meetings. Their findings also revealed that construction projects with traditional fragmented delivery systems rely more on formal information exchange that takes place in structured, face-to-face meetings.
Chang and Shen (2013) categorized site meetings into three categories: (1) meetings with owner, (2) internal General Contractor (GC) meetings, and (3) meetings between GC and subcontractors. By surveying and interviewing 26 contractor engineers at three organizational levels in seven large projects, Chang and Shen found although contractors are satisfied with the contents and results of meetings, they believe meetings are less effectively used to coordinate works compared to other methods such as contract documents, plans/procedures, written correspondence, and site visits. Due to the large number of meetings held on the studied projects, however, the researchers could not find what proportion of meetings was useful for coordination purposes. Also, their research did not include recommendations to increase meetings’ effectiveness.
examined. This approach of meeting analysis disregards the meeting itself, and it is not clear: (1) what information is shared and discussed in meetings, (2) how efficiently information is discussed and transferred, and (3) how meeting participants behave and interact during meetings.
Grose and Emmitt (2007, 2009) have made a considerable effort to analyze interactions during construction meetings using the Bales interaction process analysis (IPA) method. In Grose and Emmitt (2007), the researchers collected data from 3 to 4 sequential progress meetings of 8 construction projects during their construction phase. They found the level of negative emotion and critical discussion in construction meetings was very high compared to what was observed in other work groups, which suggests problems do not pass unchallenged. In Grose and Emmitt (2009), by observing 30 progress meetings of 10 construction projects (3 meetings each) in the UK, they found socio-emotional interactions (or relationship building) during meetings in the projects completed within budget are significantly greater than in those completed over-budget.
To the best of the authors’ knowledge there has been limited effort to formally or numerically examine what information is shared and discussed in construction meetings and how useful this information is to the project outcomes. There is a need for developing methods that can extract information from construction meeting discussions and utilize that information to help construction managers in improving their meeting effectiveness during project.
3.3.3 Information Theory
various domains, including: visualization and optimization (Xu et al. 2010; Xu et al. 2017), medical science (Steimer et al. 2015; Blokh and Stambler 2017), bio-mechanics (Gazula et al. 2015), and civil engineering and construction (Xiao-me and Xiao-jun, 2011; Jalayer et al. 2012; Chang et al. 2017). In civil engineering and construction, information theory has been mainly used for risk and structural analysis. For example, Xiao-me and Xiao-jun (2011) applied entropy measurement methods to assess risks of a construction-agent system. Jalayer et al. (2012) used an information-theoretic based approach to compare several alternative scalar- and vector-valued intensity measures (IMs).To assess the constructability of truss structure systems, Chang et al. (2017) utilized information theory methodology combined with symmetry-group, Markov chain and Monte Carlo methods to quantify the amount of information needed to construct truss structural systems with different assemblies.
Given a random discrete variable X with a sequence of m possible outcomes x, x ∈ {𝑥 ,
𝑥 , . . ., 𝑥 }, with probability of 𝑝 𝑥 for the random variable X to have the outcome xi, the
amount of information (or uncertainty) content for the random variable can be computed using Shannon’s entropy, H(X):
2 1
1 ( ) ( ) log
( )
m
i
i i
H X p x bits
p x
(3.1)Entropy, H(X), measures “the inherent uncertainty in X”, or “how much information is gained when an outcome of X is observed” (Li and Vitanyi 1997; Stone, 2015). This entropy can then be used to quantify the dependency between two random variables X and Y (Shannon 1948; Cover and Thomas 2006). The mutual information, I(X,Y), is the measure of information that can be learned from one set of data (i.e. Y) having knowledge of another set of data (i.e. X) (Abebe and Price, 2004), and can be defined by:
2 1 1
( , )
( , ) ( , )log
( ) ( ) y x m m i j i j
i j i j
p x y
I X Y p x y bits
p x p y
(3.2)where m (or m ) represents the possible different values X (or Y) can take each with
probability 𝑝 𝑥 (or 𝑝 𝑦)) and 𝑝 𝑥 , 𝑦 is the joint probability of the X and Y variables. As can be deduced from Equation (3.2), the mutual information is a symmetric criterion, i.e. I(X,Y) = I(Y,X). It can be shown from Equation (3.2) that mutual information can be equivalently rewritten as (Stone 2015):
( , ) ( ) ( ) ( , )
I X Y H X H Y H X Y (3.3)
with
2 1 1
1
( , ) ( , ) log
( , )
y x m
m
i j
i j i j
H X Y p x y bits
p x y
(3.4)being the entropy of a joint distribution of X and Y.
steps minimizes the information difference between the original data and the dependency tree. A Chow-Liu tree can be created following the steps below (Jensen and Nielsen, 2007; Schaffernicht et al. 2007):
1. Calculate the mutual information I(Xi , Xj) for each pair (Xi , Xj).
2. Consider the complete I-weighted graph: the complete undirected graph over {X, …, Xn}, where the links (Xi , Xj) have the weight I(Xi , Xj).
3. Build a maximal-weight spanning tree for the complete I-weighted graph. 4. Choose a variable as a root node.
A Chow-Liu tree provides an intuitive and user-friendly graphical model for prioritizing constraints removal discussions at weekly meetings. It allows project managers to realize how events or pieces of information are connected or lead to one another (Gazula et al. 2015).
3.4 Research Method
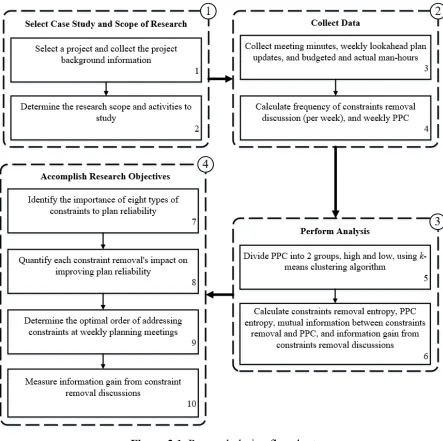
measured information gain from constraint removal discussion to reduce uncertainty in workflow reliability.
Figure 3.1. Research design flowchart
3.4.1 Data Collection 3.4.1.1 Project Description
repetitive, which made an ideal case for comparing effects of constraints removal on workflow reliability. The project is a Design-Build project with an estimated cost of $250 million. The project started in March 2016 and it is scheduled to be completed by September 2019. The project consists of a six-lane, 2.7-mile bridge with a maximum span length of 350 ft and a vertical clearance of 70 ft both on land and over ocean. The highly dynamic harsh marine environment proved to be one of the most challenging aspects of the project for both the designers and contractors. The design team divided the bridge into three "approaches" to accommodate the different geographic site conditions. The three approaches are South, Navigation, and North. This research focused on the 10 Bents (69-78) over the ocean of the North approach to have similar type of work, design complexity, and the same managers and crews for the duration of this study.
Figure 3.2. A Bent cross section
The Design-Builder of this project was a joint venture of a Designer and GC. The GC self-performed over 90% of the work because execution of the project activities required highly-trained and experienced staff and costly equipment which was the expertise of the GC. Therefore, the GC team was directly responsible for scheduling activities, providing labor, materials and equipment, and executing the work.
3.4.1.2 Weekly Planning Meetings
This project holds weekly planning meetings to plan and coordinate work on site. All weekly meetings covering Bent 69-78 were held on Wednesday mornings at 7:30 AM. The meetings lasted 90 minutes on average, with a minimum of 44 minutes and a maximum of 114 minutes. Participants varied from meeting to meeting. There were on average 12 people participating in these meetings, with a minimum of 7 and a maximum of 16. Participants included 1 senior construction manager, 1 construction manager, 1 project manager, 1 project control manager, 2 general superintendents, 3 crew superintendents, 3 project engineers, and 4 field engineers who attended more than 75% of the meetings. One of the authors of this paper