Reduction of Cycle Time in Ordering Industrial
Valves by Optimisation of Specifications
Sravankumar Gudur
1, R M Patil
2P.G. Student, Department of Mechanical Engineering, A.G.Patil Institute of Technology, Solapur, Maharastra, India1 Professor, Department of Mechanical Engineering, A.G.Patil Institute of Technology, Solapur, Maharastra, India2
ABSTRACT: Success in competitive markets increasingly demands ever shorter product and service introduction cycles and more rapid response to customers. Indeed fast response itself is often a major quality attribute. Reduction in cycle time and rapid response to customers can occur when work processes are designed to meet both quality and response goals. However after implementing the improved processes, there may be some problems in the process which may leads to delay of process. A detail analysis was conducted in M/s.Thermax Ltd Procurement department for ordering process of industrial valves. Waste in the process was eliminated by introducing the standard template of specifications & cycle time of ordering of valves got reduced.
KEYWORDS: Cycle time, Kaizen, Lean Manufacturing, Cycle time implementation tools, Basic problem solving techniques.
I. INTRODUCTION
Susan Plizg[1] have analyzed that customer satisfaction is essential to companies wanting to remain competitive in today’s business environment. The incredibly fast-paced lifestyle of most Americans demands that companies deliver products and services without delay. Customers no longer find it acceptable to wait: Pizzas must be delivered within 30 minutes, stores must offer instant credit, and tax preparers must provide quick-return income tax refunds. Time has become an increasingly valuable commodity for companies as well as individuals. Organizations hope that reducing the time it takes to satisfy customers’ needs will encourage customers to return. Imagine manufacturing a product or performing a service in half the time it currently takes. Unfortunately, managers at most companies cannot sideline day-to-day operations to conduct a thorough time-management analysis. Nor do they have the tools and detailed plan to implement one. They need a third party’s objective analysis.
Eliminating rework - The most logical step for companies to take in reducing cycle time is eliminating unnecessary work that causes long delays in completing a specific process. As a result, companies must eliminate waste and rework any activity that doesn‟t add value for the customers. The decision to eliminate unnecessary work is certainly not revolutionary, but the means by which the Motorola methodology decides which activities in the cycle to eliminate are unique. Instead of using employee opinion to determine the value of tasks performed, Motorola‟s cycle-time reduction bases this judgment on the customer‟s opinions. Using this evaluation method, Motorola‟s team determines which tasks add value in the eyes of the customer and which tasks do not.
M. Bala kumar and D.Rajenthirakumar [2] have studied that Lean Manufacturing is a management philosophy derived mostly from the Toyota Production System (TPS). It is an Applied methodology of scientific, objective technique that cause work tasks in a process to be performed with a minimum of non-value adding activities resulting in greatly reduced wait time, queue time, move time, administrative time, and other delays. Their prime objective is to evolve and test several strategies to eliminate waste on the shop floor. Their study focused on Improving the Productivity of the Compressor assembly plant by reducing the cycle time using lean tools. The non-value added activities which are identified in the assembly line will be eliminated using lean tools.
distribution, marketing etc. and thus all level of a firm‟s management. A case study is presented to motivate practitioners to implement in small & medium scale Industries.
Kaizen is a Japanese word that has become common in many western companies. The word indicates a process of continuous improvement of the standard way of work (Chen et al., 2000). It is a compound word involving two concepts: Kai (change) and Zen (for the better) (Palmer, 2001). The term comes from Gemba Kaizen meaning „Continuous Improvement‟ (CI). Continuous Improvement is one of the core strategies for excellence in production, and is considered vital in today‟s competitive environment (Dean and Robinson, 1991). It calls for endless effort for improvement involving everyone in the organization (Malik and YeZhuang, 2006).
As per Cycle time guide book of SEMATECH[4] provides a perspective on the classification of the many CTI implementation tools and can help you select the appropriate tool. With few exceptions, the tools described require training in the form of workshops or courses.
The CTI implementation tools are grouped into the following categories:
Assessment
Goal setting
Barrier removal
Paper is organised as follows, Section II describes background and related work / problem definition. After problem definition the basic problem techniques is given in section III. Proposed Methodology and discussion is given in Section IV. Section V gives the experimental results. Finally, Section VI presents Conclusion.
II. MATERIALSANDMETHODS
The procurement process of Thermax is mentioned below:
Issue of enquiries as per approved vendor list of Customers.
Follow up for receiving the quotations / offers from bidders.
Co-Ordination with Engineering dept & bidders to resolve all the technical queries.
Review of commercial offers & to prepare the cost comparison of various offers of individual item.
Participate in Negotiations & closing the orders.
Releasing the Purchase order documents.
Monitoring pricing history for the respective items.
Follow up for post order drawings & documents from vendors.
To ensure the delivery as per our project schedule.
Co-Ordinate with site for after sales requirement like erection & commissioning, performance tests to be conducted at site, etc.
Detail valve specifications were used as input material in this project.
III. BACKGROUNDANDDEFINITIONOFPROBLEM
In EPC projects, the activity of sending inquiry and receiving offers from the suppliers of various valves taking average 21 days.
This time adds to the valve procurement time thereby delaying the project.
The delay was due to the huge valve tender specifications sent to suppliers. The huge specifications contains following documents:
Valves specification sheet in excel format. (2 Pages)
Datasheet for each type of valve.(Approximate 25 datasheets which is to be filled by bidder during preordering stage)
Codes and Standards document to be followed.
Problems faced by bidders due to these specifications are mentioned below:
Tender documents sent along with specification sheet confused the suppliers as two different documents had to be referred.
Mismatches in specifications lead to number of discussions over phone and at office.
Filling of datasheets for each type of valve is time consuming activity.
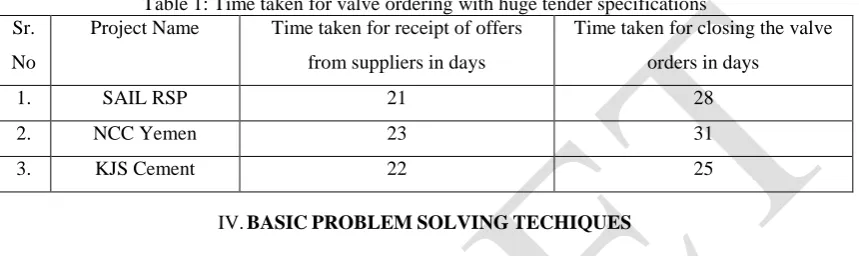
Times taken for closure of valve orders of various executed projects with above mentioned specifications are shown in below table 1.
Historical data of last three projects were taken as reference and time taken for closure of ordering were calculated. For SAIL RSP project the total number days taken was 28 days, for NCC Yemen project total number of days taken 31 days & for KJS Cement project the total number of days taken were 25 days.
Table 1: Time taken for valve ordering with huge tender specifications Sr.
No
Project Name Time taken for receipt of offers from suppliers in days
Time taken for closing the valve orders in days
1. SAIL RSP 21 28
2. NCC Yemen 23 31
3. KJS Cement 22 25
IV. BASICPROBLEMSOLVINGTECHIQUES
There are various techniques to analyse and solve work related problems. They are usually recognized as “Basic Problem Solving Techniques”. Every technique has its own merit and demerit. The members of quality circle need to be trained in the application of these techniques. The following techniques are more commonly used:
1. Brain storming :
Brain storming is a technique used to gather ideas about given problem. These ideas may primarily be concerned with diagnosing the cause of given problem or ways of tackling it. Every member gets a turn to suggest his / her ideas at this stage. The circle leaders prepare the maximum number of ideas that will be useful to solve the problem. Evaluation of ideas produced is initiated only after all the ideas have been collected, listed, displayed by the circle leader in such a way that they can be seen by all members of the circle. These ideas are then subjected to criticism. Every member is free to criticize and discuss merits and demerits of various ideas at this stage. At the end of brain storming session only few ideas are suggested earlier will remain for further consideration.
2. Data Collection:
Data collection is an important activity in the problem solving process of quality circle. The collected data provides a basic for further action. Such a data may be numerical or observations, expert opinion, etc. Analyzing and solving irrespective of its nature, such as low output, high cost, poor quality etc, inevitably involves collection relevant data. Data collected may be generally of two types:
Variable data or continuous data.
Attribute data or discrete data.
In many case the data required may be available with some departments. In other cases where data may not be readily available, it has to be generated by making observations over a period of time and recording them systematically. A check sheet enables to gather variety of data in a systematic fashion.
3. Data analysis:
After data is collected, it is analysed and information is extracted through the use of statistical methods such as Brain Storming, Cause and effect diagram, Pareto analysis etc. Quality circle members should develop the habit of discussing a problem on the basis of the data and respecting the facts recorded by it.
V. PROPOSEDMETHODOLOGYANDDISCUSSION
For this type of problem above techniques were preferred for analysing the problem.
Data related to last executed projects were collected & various brain storming sessions are conducted & various ideas are exchanged to arrive at a solution.
To remove the datasheets of valves from the tender specifications as all the required data are already covered in specification sheet.
To add all codes & standards in the specifications sheet of valves. This reduces additional document in the tender specification.
By considering above points, we have introduced a standard specification template in excel depicting datasheets of all types of valves. (Only 2 – 3 Pages of specifications)
The bidder receives all mandatory attributes of a particular valve required for submitting the offer. VI. EXPERIMENTALRESULTS
After implementing standard specification template following results were achieved for various projects.
Table 2 shows the cycle time taken for closure of valve ordering after implementing standard specifications template. For Gulbarga Project the total time taken for ordering valves is 15 days.
For Grasim project the total time taken for ordering of valves is 14 days. For India Cement project the total time taken for ordering of valves is 15 days.
Table 2: Time taken for valve ordering after implementation of standard template of specifications. Sr.
No
Project Name Time taken for receipt of offers from suppliers in days
Time taken for closing the valve orders in days
1. Gulbarga 07 15
2. Grasim 06 14
3. India Cement 05 15
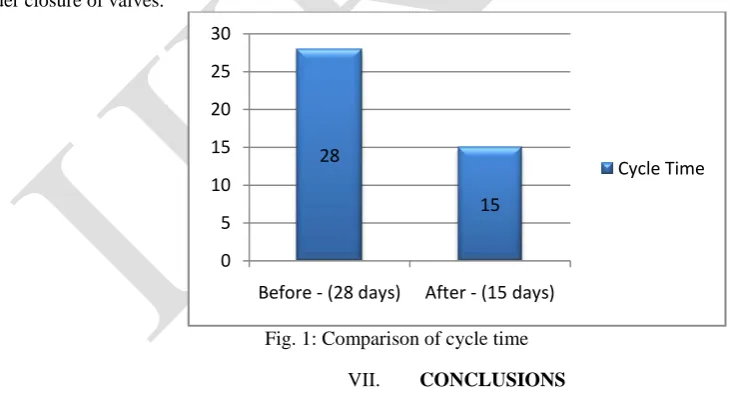
The comparison of cycle time of ordering of valves after implementing new methodology is shown in below graph. Total time taken before implementation of standard valve template is average 28 days & after implementation of standard specification template is average 15 days. Hence the standard specification template reduced cycle time of order closure of valves.
Fig. 1: Comparison of cycle time VII. CONCLUSIONS
The standard specification template eliminates waste in the earlier specifications. The wastes in the specifications are:
28
15
0 5 10 15 20 25 30
Before - (28 days) After - (15 days)
Datasheets which is to be filled by suppliers.
Mismatches in the specification sheet and datasheets.
After implementing the standard specification template the cycle time of ordering reduced from 28 days to 15 days & reduces per man day of cost of 13 days.
This reduction in cycle time leads to early ordering of industrial valves which helps to achieve the project requirements and reduces the delay of the project.
REFERENCES
[1] Susan Plizga. (1994), “Cycle-Time Reduction: “As Is” vs “Should Be” Quality Digest.
[2] M. Bala kumar and D.Rajenthirakumar, (2013), “Improving Productivity in Assembly line by reducing cycle time – Kaizen Approach”, Proceedings of the National Conference on Manufacturing Innovation Strategies & Appealing Advance MISAA2013 April 19, 2013, PSG College of Technology, Coimbatore, India.
[3] Marcelo Bertalmio, Luminita Vese, Guillermo Sapiro, Stanley Osher, “Simultaneous Structure and Texture Image Inpainting”, IEEE Transactions On Image Processing, vol. 12, No. 8, 2003.
[4] Rajesh Gautam, Sushil Kumar and Dr. Sultan Singh, (2012), “Kaizen Implementation in an Industry in India: A Case Study”, IJRMET Vol. 2, Issue 1, Apri l 2012.