BARLOW, STEVEN TODD. Spatial Knowledge Acquired Through Navigation In A Large-Scale Virtual Environment. (Under the direction of Sharolyn Converse.)
The effects of changes in elevation, route distance, route complexity, and non-spatial
A LARGE-SCALE VIRTUAL ENVIRONMENT
by
TODD BARLOW
A dissertation submitted to the Graduate Faculty of North Carolina State University
in partial fulfillment of the requirements for the Degree of
Doctor of Philosophy
PSYCHOLOGY
Raleigh 1999
APPROVED BY:
_____________________________________ _____________________________________
Biography
I’ve always been fascinated by maps. The first map I remember clearly was framed and mounted on our townhouse wall in Toronto. It was a map of the United States. Each state was a different colored piece of felt. My grandmother made it. It was big move from Alabama to Toronto. I think she wanted us to remember where we were from. Many of the states had small trinkets attached to them. The trinkets represented a theme commonly associated with that state. Nevada had a pair of dice attached to it. Hawaii had a pineapple. Mississippi had cotton. Not every state had its own theme. I don’t remember anything about New Hampshire, Vermont, Maine, and those other small cold places.
As a kid, I remember talking with my dad about the location of this or that.
Invariably, he would use cardinal directions to describe a location. "It’s about 300 yards east of the north end of the park." Although I had no idea what he was talking about I would nod my head knowingly and try not to let what he said confuse me. Since then I’ve found myself using cardinal directions. I’ve also found myself looking into people’s eyes and seeing that same empty look my dad probably saw in my eyes. Like me, they are probably thinking "I’m not Lewis and I’m not Clark. Don’t bother with your east-west gibberish. Give me left, right, up and down."
remembering the routes to soccer fields all over the Washington DC metropolitan area. By extension, I thought I knew how to get to almost anything I had visited previously- "one trial learning" you might say. Much to my chagrin, the first time I was behind the wheel on a date, I was driving to the movies when I suddenly realized I had no idea where I was going. I had headed off in the "right" direction only to find myself in a unfamiliar area with no
recognizable landmarks. I stopped the car and called my father for directions. [Note to all male readers: I swear this is the last time I ever stopped and asked somebody for directions.]
Given the trouble I found myself in on that first date, it should come as no surprise that I consider my sense of direction far above average. When I first met my wife, she was selling car phones. They were the latest toy for people with $1200 to burn. Her job required her to drive all over the place to meet people at their offices, homes, restaurants, and
wherever they found convenient. More than once she called me and said "I’m trying to get to <someplace> and I’m at <nowhere near where she should be>. What do I do?" Then I would give her step-by-step instructions from her origin to her destination. I don’t remember ever failing to get her where she wanted to go. However, that may be as much an artifact of my selective memory as it is a testament to my knowledge of the our hometown. By the way, she will still sell you a telephone for $1200 and you don’t have to commit to a service plan.
everybody wants to be like me." In light of our differences and our desire to remain married and happy that we are married, I no longer ask her to read maps while I’m driving. If we need directions somewhere, we write them out before we start driving.
When I enrolled at State, I had no idea what topic I might select for my dissertation. I had toyed with the idea of maps and navigation for my Master’s thesis. Intelligent
transportation systems were beginning to get funding. In-vehicle navigation systems were some of the first components to be investigated. Fortunately, a very helpful faculty member (Thanks Dr. Boles!) steered me away from it. He pointed out that none of the faculty had any experience in the area. If I chose that topic, I would be completely on my own. After
conferring with two other people familiar with the this sort of thing (Thanks Mom and Dad!) I agreed.
By the time I finished my Ph.D. coursework, I still had no idea what I wanted to study. I had, by that time, begun playing a very addictive computer game. I wasted many, many hours in front of my computer doing "research" on navigation in virtual environments. At some point, it dawned on me that I could use my addiction to my advantage. Even though I had already decided on the methodology and had a hazy idea about the independent and dependent variables, I had to convince my committee that doing research on virtual
dissertation unique and limited the amount of research I had to include in my literature review. Thus my dissertation was born.
This document is the final, presentable, officially-sanctioned version of my research. In no way does it represent the amount of work, worry, sleep deprivation, aggravation with computers, cursing at the developers of free software, and time away from my family that is an innate part of completing a dissertation. While working on a dissertation may, at times, seem like a solitary task, few people are solely responsible for their accomplishments. I’ve found the faculty in the Psychology Department at State to be interesting, committed to high quality research, and supportive of almost everything I’ve done. Most importantly, my family has worked around my schedule for the past few years whenever I my dissertation called me. Though they were not be able to help me think, analyze, or write, they were, without
Table Of Contents
List Of Tables ...ix
List Of Figures...xi
Introduction ... 1
Overview of Cognitive Maps ... 3
Literature Review ... 4
Structure of Cognitive Maps and Environmental Knowledge ... 4
Spatial Knowledge ... 7
Environmental Characteristics ... 20
Virtual and Simulated Environments ... 28
Summary ... 42
Research Variables and Hypotheses... 46
Non-spatial Knowledge ... 46
Changes in Elevation... 48
Distance between Rooms ... 50
Route Complexity... 51
Summary ... 53
Method ... 53
Overview of Procedure... 53
Experimental Design ... 54
Independent Variables ... 55
Dependent Variables ... 56
Learning Trials ... 57
Post-Learning Assessment of Environmental Knowledge ... 58
Participants ... 61
Materials and Apparatus... 61
Virtual Environment... 61
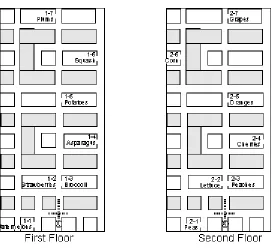
Floorplan ... 62
Rooms... 65
Joystick... 66
Crosshair... 68
Procedure... 68
Familiarization with the VE ... 69
Training with the Joystick in the VE... 70
Learning the Environment ... 70
Tests of Knowledge of the Virtual Environment ... 71
Overview ... 74
Participant Questionnaire ... 75
Learning Trials ... 78
Data Screening ... 78
Relationship Between Dependent Measures and Participant Characteristics ... 86
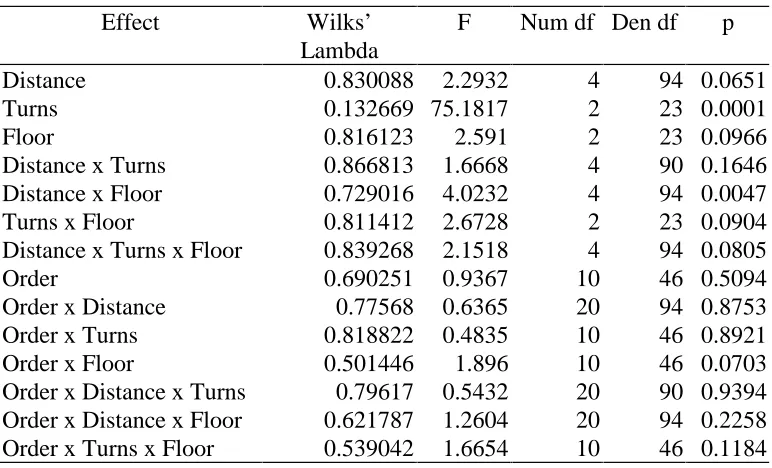
MANOVA Analysis of the Out Data for Trials 1 - 5 ... 87
Analysis of Learning Data by Trial ... 99
ANOVA Analysis of the Back Data for Trials 1 - 5 ... 119
Post Learning Trials Measurements ... 122
Measures of Knowledge of the VE ... 122
Types of Routes... 123
Data Screening ... 124
Relationship Between Dependent Measures and Participant Characteristics ... 126
Route Distance Estimation Task ... 127
Pointing Task - Azimuth Estimation... 133
Pointing Task - Elevation Estimation... 142
Room Location Decision Task ... 152
Navigation Task ... 153
Comparison of Memory for Known and Novel Routes ... 157
Summary of Post Learning Trial Measurements ... 159
Discussion ... 161
Navigation Performance During Learning Trials ... 161
Navigation Performance while Searching for the Target ... 164
Navigation Performance while Returning to the Starting Point ... 171
Memory for the VE After the Learning Trials... 173
Tests of Spatial Memory ... 173
Interpretation of Results ... 174
Assessment of Support for Hypotheses ... 176
Independent Variables and Hypotheses... 180
Conclusions ... 199
Critique of this Research ... 204
Number of Independent Variables... 204
Nature of Independent Variables... 204
Dependent Variables ... 205
Future Research ... 206
VEs and Spatial Cognition ... 207
References ... 209
Appendix A ... 214
List Of Tables
Table 1 Procedure for Using Landmarks to Navigate in a VE ... 29
Table 2 Experimental Design - Learning Trials ... 54
Table 3 Experimental Design - Post-learning Assessment - Known Routes ... 55
Table 4 Experimental Design - Post-learning Assessment - Novel Routes ... 55
Table 5 Dependent Variables ... 61
Table 6 Summary of VE Characteristics ... 62
Table 7 Room Names in the Virtual Environment... 66
Table 8 Route Distance, Turns, and Floor for Learning Trials. ... 71
Table 9 Participant Gender... 75
Table 10 Participant Age ... 75
Table 11 Participant Year in School... 75
Table 12 Participant Self-Assessment of Sense of Direction... 76
Table 13 Frequency of Computer Use... 76
Table 14 Prior Joystick Use... 76
Table 15 Wingman Warrior Joystick Use ... 76
Table 16 Computer Game Experience ... 77
Table 17 First-Person Computer Game Experience... 77
Table 18 Computer Game Frequency... 77
Table 19 Correlation Between Out Data and Back Data... 79
Table 20 Correlations Between Dependent Variables for Out Data ... 81
Table 21 Correlations Between Dependent Variables for Back Data ... 81
Table 22 POD and EED Outliers Using a Standardized Score of 3.29 as a Cutoff ... 85
Table 23 Distributions of Raw POD and EED Data ... 85
Table 24 Distribution of Transformed (square root) POD and EED Data ... 86
Table 25 Correlations Between Participant Characteristics and Dependent Measures for Out Data in Learning Trials... 86
Table 26 Correlations Between Participant Characteristics and Dependent Measures for Back Data in Learning Trials... 87
Table 27 MANOVA Test Criterion and F Approximations for Trials 1 - 5 ... 88
Table 28 ANOVA Results for Effects That were Significant Using the Multivariate Criterion... 88
Table 29 Significant Differences Among Trial POD Means. ... 89
Table 30 Significant Differences Among Trial EED Means... 89
Table 31 MANOVA Test Criterion and F Approximations for Trial 1 ... 99
Table 32 ANOVA Results for Effects Which Were Significant Using the Multivariate Criterion... 100
Table 33 MANOVA Test Criterion and F Approximations for Trial 2 ... 102
Table 34 ANOVA Results for Effects Which Were Significant Using the Multivariate Criterion... 102
Multivariate Criterion... 104
Table 37 MANOVA Test Criterion and F Approximations for Trial 4 ... 111
Table 38 ANOVA Results for Effects Which Were Significant Using the Multivariate Criterion... 111
Table 39 MANOVA Test Criterion and F Approximations for Trial 5 ... 115
Table 40 ANOVA Results for Effects Which Were Significant Using the Multivariate Criterion... 115
Table 41 Summary of Significant Effects in Analysis of Out Data in Learning Trials 1 - 5 ... 119
Table 42 Results of Back Data ANOVA for Trials 1 - 5 ... 120
Table 43 Outliers Using a Standardized Score of 3.29 as a Cutoff for Known Routes ... 124
Table 44 Outliers Using a Standardized Score of 3.29 as a Cutoff for Novel Routes ... 124
Table 45 Correlations Between Dependent Measures for Known Routes ... 125
Table 46 Correlations Between Dependent Measures for Novel Routes ... 126
Table 47 Correlations Between Participant Characteristics and Post-Learning Dependent Measures... 126
Table 48 ANOVA Results for DEA for Known Routes ... 127
Table 49 ANOVA Results for Distance Estimation Data for Novel Routes... 132
Table 50 ANOVA Results for Pointing Task-Azimuth Accuracy for Known Routes... 134
Table 51 ANOVA Results for Pointing Task-Azimuth Accuracy for Novel Routes... 136
Table 52 ANOVA Results for Pointing Task-Elevation Accuracy for Known Routes ... 143
Table 53 ANOVA Results for Pointing Task-Elevation Accuracy for Novel Routes ... 146
Table 54 ANOVA Results for Room Location Decision (RT) Task for Novel Routes... 152
Table 55 MANOVA Results for Navigation Task for Novel Routes ... 153
Table 56 ANOVA Results for Navigation Task for Novel Routes That Were Significant Using the Multivariate Criterion... 154
Table 57 Comparison of Route Types ANOVA Results for DEA... 158
Table 58 Comparison of Route Types ANOVA Results for AA ... 158
Table 59 Comparison of Route Types ANOVA Results for EA... 159
Table 60 Summary of Significant Effects in Analysis of Post-Learning Trials Tests... 160
Table 61 Possible Patterns of POD and EED Scores ... 162
Table 62 Possible Patterns of ANOVA Results Following a Significant MANOVA ... 163
Table 63 Summary of Support for Hypotheses ... 177
Table 64 Mean RT in Room-Location-Decision Task for Each Level of the Four Independent Variables ... 178
Table 65 Comparison of Mean RTs ... 179
List Of Figures
Figure 1. Azimuth and elevation directions in relation to participant’s
virtual body position... 59
Figure 2. VE Floorplan... 63
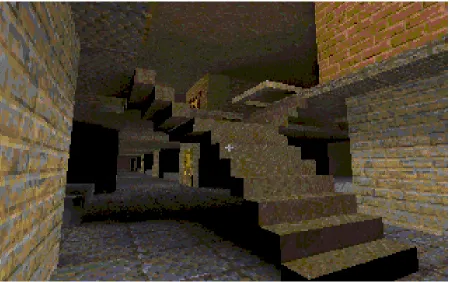
Figure 3. View from starting point in the virtual environment ... 64
Figure 4. Practice Environment Floorplan ... 69
Figure 5. Distribution of raw POD and EED Out data and Back data. ... 80
Figure 6. Distribution and means of standardized POD and EED for Out data and Back data... 82
Figure 7. Scatter plot of standardized POD and EED scores for Out data ... 83
Figure 8. Distribution and means of standardized POD and EED by subject for Out legs ... 84
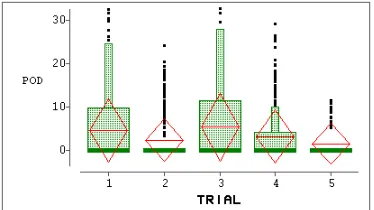
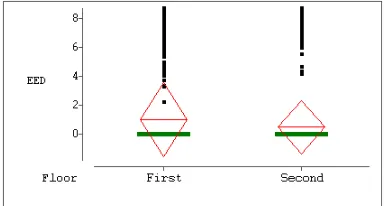
Figure 9. POD as a function of Trial for trials 1-5 ... 90
Figure 10. EED as a function of Trial for trials 1 - 5 ... 90
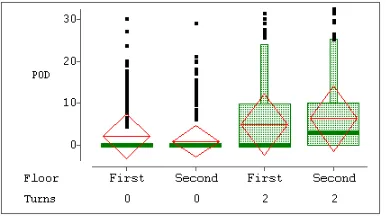
Figure 11. POD as a function of Distance for trials 1-5. ... 91
Figure 12. EED as a function of Distance for trials 1 - 5 ... 91
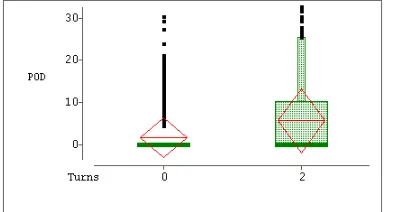
Figure 13. POD as a function of Turns for trials 1 - 5... 91
Figure 14. EED as a function of Floor for trials 1 - 5 ... 92
Figure 15. POD as a function of Distance and Turns for trials 1 - 5... 93
Figure 16. POD as a function of Distance and Floor for trials 1 - 5... 94
Figure 17. EED as a function of Distance and Floor for trials 1 - 5... 95
Figure 18. POD as function of Turns and Floor for trials 1 - 5 ... 95
Figure 19. POD as a function of Distance, Turns, and Floor for trials 1 - 5 ... 97
Figure 20. EED as a function of Distance, Turns, and Floor for trials 1- 5 ... 98
Figure 21. POD as a function of Turns for trial 1 ... 100
Figure 22. POD as a function of Distance and Floor for trial 1 ... 101
Figure 23. POD as a function of route turns for trial 2... 103
Figure 24. POD as a function of Distance for trial 3... 105
Figure 25. EED as a function of Distance for trial 3 ... 105
Figure 26. POD as a function of Turns for trial 3 ... 106
Figure 27. EED as a function of Floor for trial 3 ... 106
Figure 28. POD as a function of Floor and Turns for trial 3 ... 107
Figure 29. POD as a function of Order, Distance, and Turns for trial 3 ... 108
Figure 30. EED as a function of Order, Distance, and Turns for trial 3... 109
Figure 31. EED as a function of Order, Turns, and Floor for trial 3 ... 110
Figure 32. POD as a function of Distance for trial 4... 112
Figure 33. EED as a function of Distance for trial 4 ... 113
Figure 34. EED as a function of Floor for trial 4 ... 113
Figure 35. POD as a function of Floor and Turns for trial 4 ... 114
Figure 36. EED as a function of Floor for trial 5 ... 116
Figure 37. POD as a function of Distance, Turns, and Floor for trial 5 ... 118
Figure 39. POD as a function of Turns... 120
Figure 40. POD as a function of Distance... 121
Figure 41. POD as a function of Distance and Turns... 122
Figure 42. DEA as a function of Turns for known routes ... 128
Figure 43. DEA as a function of Floor for known routes... 128
Figure 44. DEA as a function of Distance x Turns for known routes ... 129
Figure 45. DEA as a function of Distance x Floor for known routes... 130
Figure 46. DEA as a function of Turns x Floor for known routes ... 131
Figure 47. DEA as a function of Elevation for novel routes ... 133
Figure 48. DEA as a function of Order x Turns for novel routes... 133
Figure 49. AA as a function of Distance for known routes... 134
Figure 50. AA as a function of Floor for known routes ... 135
Figure 51. AA as a function of Distance x Turns for known routes ... 135
Figure 52. AA as a function of Group for novel routes... 137
Figure 53. AA as a function of Distance x Turns for novel routes ... 137
Figure 54. AA as a function of Distance x Group for novel routes... 138
Figure 55. AA as a function of Turns x Group for novel routes ... 139
Figure 56. AA as a function of Elevation x Group for novel routes ... 140
Figure 57. AA as a function of Turns x Elevation x Group for novel routes ... 141
Figure 58. AA as a function of Order x Distance x Group for novel routes ... 142
Figure 59. EA as a function of Distance for known routes ... 143
Figure 60. EA as a function of Floor for known routes... 144
Figure 61. EA as a function of Distance x Floor for known routes... 145
Figure 62. EA as a function of Distance for novel routes ... 147
Figure 63. EA as a function of Turns for novel routes ... 147
Figure 64. EA as a function of Elevation for novel routes ... 148
Figure 65. EA as a function of Distance x Turns for novel routes ... 148
Figure 66. EA as a function of Distance x Elevation for novel routes ... 149
Figure 67. EA as a function of Turns x Elevation for novel routes... 150
Figure 68. EA as a function of Distance x Turns x Elevation for novel routes... 151
Figure 69. EA as a function of Order x Distance for novel routes ... 151
Figure 70. POD as a function of Turns... 155
Figure 71. POD as a function of Elevation... 155
Figure 72. POD as function of Turns x Elevation ... 156
Figure 73. POD as function of Distance x Elevation x Group ... 157
Figure 74. AA as a function of Route Type ... 158
Figure 75. Average POD for all trips ... 165
Figure 76. Number of trips in which POD was greater than 0 and average POD for those trips ... 166
Figure 77. Average EED for all trips... 166
was greater than 0 and ratio of these two numbers ... 168 Figure 80. Faster but longer route from room to starting-point... 172 Figure 81. Hierarchical structure of environmental knowledge with
integrated spatial and non-spatial knowledge ... 175 Figure 82. Effect of estimated distance on azimuth accuracy ... 186 Figure 83. Effect of estimated distance on elevation accuracy when
The research described in this document is designed to explore knowledge about large-scale virtual environments gained through direct navigation in the environment. Large-scale space cannot be viewed, in whole, from a single vantage point. A large-Large-scale space requires spatial and temporal summation because a person must move through the
environment in order to experience it. Direct navigation is first-person movement through an environment. Movement and direction of movement are under the control of the person in the environment. The virtual environment, in this research, was presented and experienced through a desk top display and control.
This research examined the effects of four independent variables on navigation in a virtual environment and memory for the environment. The independent variables are: route length, route complexity, changes in elevation, and semantic grouping. The first three variables are objective environmental characteristics. Each has been shown to influence cognitive representations of real-world environments. The fourth variable, semantic grouping, is a subjective characteristic of the environment. It is influenced by objective environmental characteristics and influences encoding and recall of spatial relationships in the environment.
that looks at the effect of changes in elevation on the development of cognitive maps. None of those studies systematically varied route-elevation change for environments learned through direct navigation. Investigations of the effects of semantic grouping have been pursued independent of the research on environmental characteristics. The research
described here was done to determine whether there is an interaction between these two types of variables.
The research also has practical importance. In the area of intelligent transportation systems, an understanding of the development of cognitive maps can be useful in designing driver-training procedures, route-planning systems, and route-guidance systems. The same knowledge can be applied to other domains in which navigation and understanding of the environment are critical, e.g., aircraft navigation, ship navigation, and off-road navigation. As virtual environments become less expensive and more prevalent, the relationship between navigation in the real-world and virtual environments must be understood. While the
environment used in this study is not an immersive environment like those used in military crewstation or aerospace research, the same technology is being used by the Marines as a team-training tool.
This document is comprised of six major sections. The first section (this section) describes the purpose of the research and briefly reviews the concept of cognitive maps. The second section reviews the relevant research regarding the four independent variables
describes the analysis of the data. The sixth section interprets the analysis and discusses the findings.
Overview of Cognitive Maps
The term “cognitive map” was introduced by Tolman (1948) to explain performance of rats while they navigated a maze. The rats behaved as if they had developed a survey representation or “map” of the maze.
The term “cognitive map” is a metaphor for the structure of environmental knowledge and the method of its use (Downs, 1981). It is an inappropriate metaphor because
environmental knowledge is not stored in a unitary spatial format (Montello, 1992). It is the misinterpretation of Tolman’s work that has caused problems for the metaphor (Downs, 1981). Tolman was trying to describe a process- not a product. At no point did Tolman specify which properties of the mental map are equivalent to a cartographic map.
Unfortunately, many of the inferences people draw about cognitive maps are based on their experience with cartographic maps. However, a cartographic map cannot be used to explain a cognitive map. Neither the cartographic map nor the cognitive map is the real-world. To say that a mental map is like a cartographic map is to misunderstand what a cartographic map represents. It also provides no explanation of the structure and processes of spatial cognition.
The following commonalities can be found across most research on cognitive maps:
• A cognitive map is a construct used to describe knowledge of large-scale environments.
knowledge about the spatial aspects of the world (Downs & Stea, 1977).
• This process translates spatial information into a representation within memory that will be useful at a later date. Object identification, location, and temporal qualities are acquired, organized, and stored for future use.
• Cognitive mapping is a purposeful and goal-directed activity.
Still, there is no dominant viewpoint in the study of memory for large-scale
environments (McGuinness, 1992). Research findings differ because of the environments in which the data are collected, the means of learning about the environment, and the measures used to assess knowledge of the environment. Researchers from a variety of fields have contributed to the research in this domain. This diversity in backgrounds is evident in the goals of the researchers.
Research in these areas has focused on understanding how cognitive maps are formed, how they are used, the effects of the environment on their formation and use, the design of navigational aids, the design of geographic information systems, and the tracking of criminal behavior. While most studies focus on the accuracy of mental representations, the underlying focus has been on the contribution these representations make to the achievement of
individual goals and objectives (Canter, 1991).
Literature Review
Structure of Cognitive Maps and Environmental Knowledge
is brought together to support spatial behavior. The task and environment influence the form and content of the knowledge applied at any one time.
In many cases, people’s environmental knowledge is incomplete and inaccurate. Inconsistencies and inaccuracy in spatial behavior reflect the incompleteness, distortion, and asymmetries in this knowledge (e.g., Anooshian, 1996; Lloyd & Cammack, 1996; Sadalla, Burroughs, & Staplin, 1980). For example, a common result of distance-estimation is asymmetrical estimates between two points. The estimated distance from A to B is consistently different than the estimated distance from B to A.
The inaccuracies in people’s cognitive representation of the environment arise from an interaction between complex environments, existing environmental knowledge, and navigation goals. Even if an environment can be objectively defined, people encode the environment differently. People select the salient aspects of their environments based on past experience in their own navigation and the current navigational needs (Golledge, 1991c). As would be expected, given these interactions, the inconsistencies in knowledge are not
common across individuals (Lloyd & Heivly, 1987).
Personal events and actions, i.e., episodic memory, also affect environmental
knowledge. The acquisition of spatial knowledge is based, mostly, on direct experience, i.e., moving through the environment (Gale, Golledge, Pellegrino, & Doherty, 1990). During the early stages of learning a new environment, much of the environmental knowledge is stored as episodic memory. Since each individual selects and encodes personally-relevant cues while encoding environmental information, acquisition of environmental knowledge is highly individualized. Even in complex environments, many aspects of the environment can also be ignored without adverse effects on navigation (Gale, Golledge, Pellegrino, & Doherty,
1990).
Several researchers (Hirtle & Jonides, 1985; McNamara, 1986; Hirtle, 1995) propose that environmental knowledge is stored in a hierarchical or partially hierarchical form. In hierarchical models, higher levels of the hierarchy contain less detailed knowledge than lower levels. As one progresses farther down the hierarchy, each node represents a smaller and smaller part of the environment. Partially hierarchical models allow relationships between lower-level nodes to be encoded without passing through the connecting higher-level nodes. Hierarchical clusters are formed by semantic grouping of locations/objects/buildings and by environmental characteristics.
Distance relationships between points, within or between hierarchical clusters, are determined by characteristics passed up or down within the cluster. At lower levels in the hierarchy, the relationships among nodes is topological. Between-cluster measurement is probably influenced by distance between dominant reference points (Golledge, 1991c). As mentioned earlier, the cartographic map metaphor does not accurately describe cognitive representation of the environment. A two-dimensional or three-dimensional structure, with metric, Euclidean relations, does not exist.
Although semantic grouping affects the storage and retrieval of spatial knowledge, it is not clear whether semantic knowledge and spatial knowledge are integrated into the same structure. Some researchers support the contention that one structure holds both types of information (e.g., Merrill & Baird, 1987). Others, (e.g., Clayton & Chattin, 1989) propose that spatial and semantic knowledge may be stored in different structures. Yet both sets of researchers agree that semantic information can assist the encoding of spatial information and can facilitate its retrieval. As shown by Golldege (1991c) and Hirtle and Mascolo (1986) the ease of encoding and retrieval alters memory for the environment.
Spatial Knowledge
This section describes empirical research on the content and structure of
Reference Points. Reference points are salient locations or objects possessing strong semantic relationships with several other locations. They define a region through perceptual or symbolic significance (Holding, 1992). Reference points and landmarks are not
synonymous. A landmark is a physical feature of a route which signals a navigational decision, or a physical feature of a region permitting maintenance of geographical orientation.
Sadalla, Burroughs, & Staplin (1980) studied the function of spatial reference points as points around which environmental knowledge is arranged. They believed reference points define the location of a larger set of non-reference points. Each reference point is associated with a set of non-reference points. The distance between a non-reference point and its reference point may be defined in terms of proximity, i.e., the relationship is topological. The relationship between two non-reference points is found by establishing the relationship between two reference points and then between the reference points and the non-reference points. They studied memory for a college campus.
In the first experiment, participants indicated the distance between two points by showing their location on a grid. For each pair, the reference point was shown as an origin or destination. They found asymmetry in distance estimates when one of the points was a
In a second experiment, 15 locations were selected to create two types of prime-target pairs. The primes were neutral locations, i.e., they were neither high nor low reference locations. The targets were either high reference or low reference locations. Triads were created in which a neutral location was equidistant from a high and a low reference point. When presented with the prime and target, participants responded if they thought the pair were farther or closer than 600 yards. They found the reaction time (RT) for neutral-low pairs was greater than the RT for high pairs. Participants responded faster to neutral-high pairs than to equidistant neutral-low pairs. Accuracy was neutral-high and equal for both types of pairs.
In a third experiment, they investigated the effect of reference points on direction judgments. As in the previous experiment, prime-target pairs of locations were created. The prime was either a high or low reference point. The target was a neutral location.
Participants were shown a spatial relationship between the prime and the target. They had to verify the accuracy of the proposed direction between the prime and target. RT was faster when the high reference location was the prime compared to when the low reference location was the prime.
The results of these three experiments suggest that knowledge of large-scale environments contains reference points around which other, non-reference points, are organized. The cognitive distance between reference and non-reference points is
points would occur at a higher-level of the hierarchy than non-reference points. The
asymmetry of the representation also suggests that the spatial location of non-reference points is stored as a topological relationship with respect to a reference point. It does not appear that there is a metric representation of the environment.
Spatial Hierarchies and Environmental Features. McNamara (1986) investigated how spatial relations among objects in an environment are encoded in memory. He arranged object names, on the floor, in a 20 x 24 ft. space divided into four regions of equal size, i.e. a 2 x 2 grid. The regions were separated by black lines on the floor. Two groups learned the locations of the objects through direct experience. One group could move in the space without regard to the black lines. The other group had to treat the lines as boundaries. To move from one region to another the participant had to walk around the line dividing the two regions. McNamara was interested in the effect of these spatial regions on distance estimates within and across the regional boundaries. He arranged the objects so that there were
equidistant intra-region and inter-region object pairs. After participants memorized the location of the objects, McNamara tested their memory for the environment using object-name recognition, direction estimation, and Euclidean distance-estimation.
primed by a closer object compared to priming by a more distant object. The size of the distance effect was larger when the prime and target were in the same region than when they were in different regions.
Participants estimated the direction between inter-region object pairs. McNamara found that direction judgments were distorted to correspond with superordinate relations between the objects. In other words, for two objects in different regions, the regional alignment affected the direction estimation. If the two objects were in vertically-aligned regions, direction estimates were distorted so that the objects were more vertically aligned than they originally appeared. Similarly, if the two objects were in horizontally-aligned regions, direction estimates were distorted so that the objects were more horizontally aligned than they originally appeared. The size of the distortions depended on the distance between objects. As the distance between the objects increased, the distortion decreased.
Regional boundaries and object distance also influenced distance estimations. Participants underestimated distance between objects in the same regions and overestimated distances between objects in different regions. They overestimated distances between close objects and underestimated distances between far objects. The size of this effect was smaller for objects in the same region than for objects in different regions.
As a result of this research McNamara proposed that spatial knowledge is stored in a partially hierarchical structure. In a hierarchical structure, the spatial knowledge is stored in a branching tree. Higher levels of the tree contain more general knowledge. Lower levels contain more detailed knowledge. In a partially hierarchical structure, spatial relations among lower-level nodes attached to different higher-level nodes, i.e., in different regions, can be directly encoded.
Subjective Influences on Spatial Hierarchies . McNamara showed that spatial proximity and environmental characteristics can affect the structure of spatial memory. Hirtle and Jonides (1985) showed that spatial memory is influenced by factors other than physical characteristics of the environment.
Hirtle and Jonides used recall order and distance-judgments to study the structure of memory for a college town and campus. They asked students at the University of Michigan to memorize and recall 32 landmarks in central Ann Arbor (the town in which the university is located). All of the students had attended the university and had lived in the town for at least 2.5 years. There were 14 recall trials. Four trials were uncued free recall. On ten trials, participants were cued with a location name.
For the distance-judgment tasks, the researchers created triplets of locations in which two anchors were assigned to one target. The distances from the anchors to the target were approximately equal and the anchors were in different directions from the target.
locations was larger or smaller than a standard distance, i.e., a modulus. The second task was a magnitude-estimation task. Participants gave a distance estimate, from 1 to 100, for the distance between two locations.
Hirtle and Jonides used the ordered-tree algorithm to analyze the recall protocols. The analysis output is an ordered tree with unidirectional, bi-directional or non-directional clusters. The clusters indicate the order in which subsets of locations are recalled consistently across all cued recall trials. There was similarity in recall strings across participants which suggests there is similarity in memory representation of the campus and town. They assessed the validity of the trees by seeing if the trees helped predict performance in the distance-judgment tasks.
In the first distance-judgment task, the distance between locations was either shorter or longer than the standard. Some location pairs were intra-cluster pairs. Some were inter-cluster pairs. For short distances, participants tended to perceive incorrectly a distance between locations as longer than the standard when the locations were in different clusters. For longer distances, participants tended to perceive incorrectly a distance as shorter when the locations were within the same cluster.
In the magnitude-estimation task, participants’ estimates were accurate for intra-cluster and inter-intra-cluster distances. Inter-intra-cluster distance estimates were greater than estimates for intra-cluster distances of equal length.
distances, and (2) attenuating intra-cluster distances. The evidence suggests that spatial processing is a function of spatial and non-spatial components.
Hirtle and Jonides concluded that semantic (i.e., non-spatial) information affects both encoding and retrieval of spatial information. If the semantic information affects a person’s ability to access spatial information, the semantic information will affect the person’s cognitive map of the environment. For example, the ease of access to spatial information alters the perception of distance and direction.
Hirtle and Mascolo (1986) looked at the effect of semantic labels on the acquisition of spatial information from maps. Two maps of 10 points were constructed using the labels from two conceptually distinct sets of locations (derived experimentally). The layout of the points on the two maps was identical. The points on both maps formed eight critical triads. Each triad formed an isosceles triangle. The distance between the anchor and two targets was equal. One of the targets was within the same conceptual set, the other target was in the other conceptual set. The difference between the two maps was the position of the two labels. Hirtle and Mascolo expected that swapping the position of two labels would affect the clustering of points.
Participants learned the locations on one map through a series of study-reconstruction periods. They studied the map and then, when presented with two anchor locations, placed points in relation to the anchors. The purpose of this task was to focus learning on the relationships between points rather than on absolute locations.
magnitude-estimation task. In the comparative-judgment task, participants indicated which of 2 points was closer to a referent.
The effect of clustering was found for both dependent measures. In the magnitude-estimation task, participants’ estimates of intra-cluster distances were shorter than estimates of equal-length inter-cluster pairs. Similarly, in the comparative judgment task, participants judged intra-cluster pairs as closer than equidistant inter-cluster pairs.
In a second experiment, they tried to create semantic clusters by manipulating the presentation of locations during map learning. While learning the map, one location from each conceptual set was always presented with locations from the other conceptual set. They were trying to force the semantic clustering of locations. The dependent measures were the same as in the first experiment. The results were similar to those of the first experiment which suggests that the learning strategy had no effect on clustering of locations.
The authors concluded that semantic labeling of points can produce semantic clusters which alter memory for spatial locations. Clustering appears to be the result of the integrated storage of semantic and spatial information. The verbal labels of the points affect encoding and retrieval of the location of the points. Semantically-related labels and locations are encoded together. During retrieval, semantically-related labels and points are remembered as being closer in space than semantically-unrelated points.
Functional and Spatial Relationships. Merrill and Baird (1987) investigated the
the context of environmental knowledge, association can be defined semantically or spatially. The relationship between locations is influenced by the physical separation of the locations and the subjective distance between them.
In the first experiment, they measured perceived relatedness among buildings on a college campus and in the surrounding town. The intent was to determine which aspects of the buildings were most relevant to judgments of relatedness. Participants sorted index cards containing names of all campus buildings and some buildings in town. They sorted the piles according to "what seems to go together" and were told to use as few piles as possible. Inspection of the piles showed that some participants used functional groupings while others used spatial groupings. Functional sorting was more prevalent than spatial sorting.
In a second experiment, participants were presented with prime-target pairs of building names. Participants were asked to indicate if the two buildings were both local, i.e. they responded “Yes” or “No.” The prime-target pairs of local buildings were created so that there were three types of association between pairs: spatial and functional, functional-only, and no association. They found that RT for spatial and functional pairs were shorter than RT for functional-only and unrelated pairs. Reaction-time for functional-only pairs did not differ from RT for unrelated pairs.
where there were several equidistant buildings, the relative prominence of the buildings was influential.
The fourth, and final, experiment, employed the same task as in the second
experiment. Three types of prime-target pairs were created: (1) prime-target pairs of spatially proximal but functionally unrelated buildings were formed from the primes and responses in the third experiment; (2) pairs of buildings that were spatially proximal but functionally unrelated and were rarely or never given as responses in the third experiment; (3) pairs of buildings that were neither spatially proximal nor functionally related and did not appear to be related based on the results of the third experiment. There was no priming effect when the prime was a spatially proximal but functionally unrelated building.
The authors concluded that spatial relationships are not the sole source of organization in spatial memory. Functional relationships also influence the storage and retrieval of spatial information. Additionally, priming effects can be found when the prime-target relationship is functional only but the effect is small in comparison to the effect of a spatial and functional relationship.
In the first experiment, participants saw either a fact or a building name. They had to indicate on which campus the building or the building associated with the fact was located. There was a significant spatial priming effect. RT for a building or fact was faster when primed by a close building or fact for a close building in comparison to priming by a far building or fact for a far building.
In another experiment, participants were presented with prime-target pairs in one of three experimental conditions: (1) a fact about a building primed the name of the building, (2) a fact primed the name of a near building, (3) a fact primed the name of a far building. On each trial, the prime was displayed, followed by the target. Participants had to decide on which campus the building was located. RT was controlled because an accuracy-RT trade-off had been apparent in a previous experiment. In this study, error rate was used as the dependent measure. The error rate was greatest for pairs in the far condition and smallest for pairs in which a fact about the building primed the building name.
The results of these experiments suggest that spatial and non-spatial information can be integrated in the same memory representation. The authors compare these results to those of other experiments (e.g., McNamara, Altarriba et al., 1989) in which participants had to distinguish between real building names and fake names. No priming effect was found when the distance between primes and targets was manipulated.
judgments, like those in McNamara, Altarriba et al. (1989) use the nonmetric representation. Spatial priming does not occur in recognition tasks because location is not stored in a
categorical manner. Spatial priming occurs in location-judgment tasks because people have to access their spatial representation. (this does not mean that the metric representation is accurate. It means that some interpoint distances have been stored.)
In addition, the current results suggest that the facts about the campus buildings were stored with the metric information- otherwise the priming would not have occurred. Spatial knowledge and non-spatial knowledge are integrated into the same memory structure.
Environmental Characteristics
This section describes research on the influence of environmental characteristics on navigation and memory for the environment. The environment plays an important role in navigation and the development of cognitive maps. During navigation, a person’s goals interact with knowledge of the environment. Knowledge of the environment affects the formation of plans based on the affective and (non)metric spatial knowledge available to apply to the task of planning and executing the route. Navigation, in turn, affects knowledge of the environment. As navigation succeeds or fails, the person’s cognitive map is modified (Kitchin, 1994).
Errors in Navigation. Williamson and Barrow (1994) studied navigation errors in
everyday behavior. They found that errors in navigation are most often due to environmental factors or inattention. They asked participants to record instances of problems they
experienced while traveling. The authors classified the errors into nine categories. Four types of errors accounted for 72 percent of the errors. The four categories were:
• Turning in the wrong direction in places where the participant should have turned in the opposite direction or not turned. These errors occurred most frequently in familiar environments.
• Missing a turn by passing by the turn or not perceiving the turn. These errors occurred most frequently in familiar environments.
• Misconception of location by realizing the current location was not the expected location or did not appear as expected. These errors occurred most frequently in familiar
environments.
Participants, when recording the errors, were also asked to describe possible reasons for the errors. The reasons were classified into five categories. Three of the categories accounted for 90 percent of the errors. These were:
• Environmental causes such as (a) inadequate or misleading signs, (b) perceptual confusion arising from homogenous surroundings or unavailability of landmarks, (c) complexity of roadway or hallway layout, (d) changes in the environment since the last time the participant had visited.
• Inattention to current location or progress along a route.
• Inadequate knowledge of the location of the destination or appearance of the destination. This type of error was apparent when traveling new routes in a familiar environment. The participant may not recognize a familiar landmark from a novel location. It also occurred when planning routes to a new location. Planning and preparation were not sufficient.
The types of errors and their causes suggest that environmental factors can cause navigation errors. Three of the four most frequent errors can be attributed to environmental causes. Only the participant’s inability to plan a route can be solely attributed to lack of knowledge or planning by the participant. Of the causes proposed by the participants, 43 percent of the errors are attributed to environmental causes.
wilderness. His conclusions indicate that environmental characteristics affect these people’s navigational choices.
Natural routes exist which lead the lost person in a particular direction. These include game trails, false shoulders, angled ridge lines, old railroad beds, and connected clearings. In cases where people lose sight of their trail, they don’t realize that brush or trees may change their view of a readily accessible trail. This happens more frequently when people move downhill from the trail into a clearing. Similarity of terrain also leads people to think they are in one place instead of another.
Syrotuck also found that some people travel the path of least resistance- regardless of direction. Alternative paths were chosen based on "looks." Almost all people traveled downhill, even when it was not the way back to their destination.
As shown by the previous two studies, environmental characteristics can affect navigation. Garling, et. al. (1986) and Weisman (1981) list three classes of environmental characteristics that should be considered when studying navigation in a human-made environment: differentiation, visual access, and complexity of the layout.
• Differentiation refers to different sections of a building being distinguishable.
• Visual access pertains to whether different areas of the building can be seen from other areas.
The research described in the following section addresses environmental complexity. These articles focus on the effects of route length, turns, and changes in elevation on route and survey knowledge.
Route Characteristics. Byrne (1979) examined the effect of route length, number of turns, and complexity of surroundings (i.e., rural or urban environments), on route length estimates. Participants estimated route lengths for routes in urban or rural settings, of 300m, 500m, or 750m, and were straight or had 2-4 turns. Distance was estimated using a magnitude-estimation procedure. Byrne found significant effects for all three independent variables. Rural routes were judged to be longer. Straight routes were judged to be shorter. Shorter routes were overestimated in comparison to longer routes.
In a second experiment, participants were asked to draw road junctions on a piece of paper. True junction angles varied from 60-70 degrees or 110-120 degrees. He found that most estimates, for both conditions, were closer to 90 degrees.
Byrne concluded that environmental information is stored heuristically. Instead of a metric representation containing veridical distance and direction, he proposed that the mental representation is a network map which preserves topological relations, i.e., order of locations and turns. Neither the distances between locations nor the precise angles at which roads meet are encoded.
Changes in Elevation. Garling, Book, Lindberg, and Arce (1990) looked at how
had to choose the higher location and estimate the difference in elevation in meters. The true difference in elevation ranged from 5 to 48 meters. Participants were accurate (70% to 100% accuracy) in choosing which location was higher. Their analysis of the elevation difference estimations was not conclusive. However, the choice data suggest that location elevation is stored as part of spatial knowledge.
In a second experiment, participants performed a choice reaction time task. Garling et al. presented them with two location names in sequence. The first name appeared and then the participant pressed a key to make the second name appear. Participants had to indicate which location was either higher or lower. The task changed across trials. RT was measured. They found a significant difference in RT for pairs of locations. The difference did not seem to be related to the distance between the two locations. Correlations between distance and RT were small and negative. Instead, the difference appeared to be related to the difference in elevation. Participants took longer to choose between two locations when the difference in elevation was smaller. The absence of a distance effect and the presence of an elevation effect suggest that elevation and route distance can be retrieved separately. One possibility is the use of elevation reference points which are used to judge relative elevation. This could explain the lack of a distance effect.
There were 3 phases: learning, integration, and testing. Each participant walked one of the routes. During this walk, the experimenter stopped the participant and named the landmarks. Participants walked the route again but provided landmark name and distance information before reaching the first landmark. After completing the second walk, the participants named the landmarks in the order they appeared on the route. They then went to the starting point of the second route via a route that took them away from the original route. It was not the shortest route between the two starting points. They learned the second route in the same manner as they learned the first route.
Integration occurred in one of three conditions. In the first condition, participants walked back to the start of the first route and received the integration instructions. In the second condition, participants received the instructions at the start of the second route. In the third condition, participants walked from the start of the second route to the start of the first, via a stairway leading directly between the two, and back again. They then received the integration instructions. In all conditions, the instructions told the participant that the two routes were vertically-aligned (i.e., one route was above the other route). Participants then walked the route at whose start point they received the integration instructions. At each landmark, they pointed toward the other landmarks. RT and azimuth were recorded.
Montello and Pick found that azimuth error was greater when pointing toward
traveling between the two routes did not affect pointing accuracy. RT was greater when pointing toward landmarks on the other route.
Floorplan Complexity. O’Neill (1991a) attempted to develop an objective measure of the physical environment and measure its influence on cognitive mapping and navigation. He proposes that floor plan layout greatly influences navigation and a person’s ability to develop an understanding of a building’s layout.
His measure of floor plan complexity was based on the topological connections between choice points. A choice point is a location where a person must choose between two or more directions of travel. O’Neill considered intersections of two or more hallways and turns, where there is no intersection, as choice points. He emphasized the importance of choice points in the development of cognitive maps because people make navigation decisions at choice points.
O’Neill proposed the InterConnection Density (ICD) as a measure of floor plan complexity. It represents the density of paths between locations. ICD is the average number of choice points directly connected to a choice point. This is calculated by summing, across all choice points, the number of choice points directly connected to each choice point and dividing by the number of choice points.
required to travel from start to finish, (b) the number of incidents of backtracking, and (c) the number of wrong turns.
There were significant differences, between the route with the highest ICD and the lowest ICD, for travel time, number of backtracking instances, and number of wrong turns. For each measure, the value was greater for the route with highest ICD.
In similar studies in different environments, O’Neill (1991b; 1992) found a similar relationship between ICD and navigation.
Virtual and Simulated Environments
Virtual environments, as presented in this research, have only been possible for the past 15 years. However, simulated environments are not restricted to virtual environments. As shown by the research reviewed below, film, models, and video have been used to study cognitive maps developed during interaction with simulated environments.
The research suggests that the same physical characteristics of the real-world that are important in the development of cognitive maps are also important in the development of cognitive maps of virtual environments. Darken (1996) lists characteristics he considers the defining characteristics of virtual environments (extent, detail, density, scale, dimension, and restriction) which capture many of the same concepts used by Garling, et. al. (1986) and Weisman (1981).
This section, like the previous section on environmental characteristics, reviews research employing virtual environments to study environmental cognition.
Virtual Environments and Environmental Characteristics. Darken and Sibert (1996a) showed how the structure of a virtual environment affected navigation in the environment. The environment was a large open sea with islands separated by large distances. Participants had to search the space for ships. Their perspective on the environment was that of a pilot in an airplane. In the two conditions in which grid lines were superimposed on the
They found that movement in sparsely-populated space led to disorientation much of the time. Participants in the environments without the grid lines were less able to form an accurate representation of the environment. People need structured movement for effective navigation and spatial-knowledge acquisition.
Darken and Duckworth (1994) also showed that a relationship exists between the tools and cues in the virtual world and the behavior and strategies employed by people navigating in that world.
Using an environment similar to that used by Darken and Sibert (1996), participants explored the virtual space to see as much of it as possible. They then searched for a target. Upon finding the target, they were asked to return to the start position. Darken and
Duckworth performed a GOMS analysis of navigational behavior. Their analysis reveals that the environment affected navigation through the use of landmarks and districting.
Successful exploration relied on maintaining sight of the landmarks. As shown in the three-step process below, participants used landmarks as an orienting feature while exploring the space.
Table 1 Procedure for Using Landmarks to Navigate in a VE
1. Acquire orientation and position information by getting directional and distance information from landmarks.
2. Learn space by moving through space while maintaining orientation and position with respect to landmarks.
They also found evidence of “districting”, which they define as the partitioning of the space into smaller units which are more easily searched. Districting occurs when some aspect of the environment allows the partitioning of the environment. When this is possible, participants followed these steps to search the space:
1. Acquire orientation and position within district.
2. Move along district borders and note relationship to immediate neighbors.
3. Learn space by moving within a district. Note relationship of objects within district. 4. Search space for target within district. Search new district if target is not found.
5. If orientation of district and district alignment is lost, move to neighboring districts until it becomes familiar. Restart search if district border connections are lost. Backtrack within district to reestablish district orientation.
Virtual Environment (VE) as a Real-world Surrogate. Arthur, Hancock, and Chrysler (1993) examined virtual reality as a means for studying tasks requiring spatial representation. Participants studied the arrangement of nine objects on the floor. They viewed the objects in either a virtual world, the real-world, or the real-world from a fixed viewpoint. After
studying the objects, participants rank-ordered the distance between the three pairs.
They found no difference between groups in estimating the distances between objects. These results suggest that VE can simulate spatial relations.
Bailey and Witmer (1994) trained people to navigate in a building or in a virtual environment of the same building. All participants studied route directions and photographs of landmarks for a complex route and then were assigned to one of three rehearsal groups: (1) VE rehearsal in VE building, (2) building rehearsal in the actual building, and (3) rehearsal through verbal rehearsal of route directions while referencing photographs. After rehearsal, all participants were tested for navigation performance in the actual building.
Route performance was measured by the number of wrong turns and travel time. Participants trained in the building made fewer wrong turns than those trained in the VE. Participants trained in the VE made fewer wrong turns than those trained verbally. There was no difference in travel time between the real-world and VE groups. Participants in both groups completed the route more quickly than participants in the verbal-rehearsal group.
Navigation Simulation. Gale, Golledge, Pellegrino, and Doherty (1990) compared navigation training in the real world and while watching a video tape of the same
environment. Participants in the video training condition navigated poorly in comparison to those trained in the real-world. However, memory for scenes was equivalent between the two groups.
neighborhood condition, the experimenter led the participant on the first trial, when learning the route through direct experience. On the remaining four trials, the experimenter gave the participant little help. In both conditions, after the 1st, 3rd, and 5th trials on each route participants completed scene recognition tests. For routes learned via videotape, a final navigation test in the neighborhood occurred after the 5th learning trial.
For participants learning the route through direct experience, the time required to travel the route dropped from the 1st to the 4th trial. By the 3rd trial, the mean number of mistakes was effectively zero. The difference in errors across trials was significant as was the difference in travel time.
Navigation performance in the neighborhood following the 5th video trial was similar to performance during the first 3 trials in the direct experience conditions. Seeing the route five times on video was roughly equivalent to one traversal of the route in the field.
There was no difference in scene recognition between participants in the direct experience and video learning conditions. In both conditions, participants recognized views of choice points better than they recognized views of houses along the route. This suggests that choice points are learned first and better than non-choice points.
Goldin and Thorndyke (1982) compared the spatial knowledge acquired via direct navigation or simulated navigation through an environment.
Participants toured an unfamiliar area of Los Angeles, by bus or by viewing a film taken from a car on the same route. The tour lasted 24 minutes and contained eight buildings the experimenters designated as landmarks. The bus and film stopped briefly at each
supplementary information: (a) a concurrent description of the route which provided distances, directions, and street names, (b) a map prior to taking the tour or seeing the film, (c) or no supplementary information.
The participants were then given a landmark-recognition test, location-sequencing test, route distance-estimation test, orientation test, and Euclidean distance-estimation test. Goldin and Thorndyke proposed that the first test assessed landmark knowledge; the 2nd, 3rd, and 4th tests assessed route knowledge; the 5th test assessed survey knowledge.
They found that participants who saw the film recognized landmarks better than participants who took the bus tour and recognized non-choice points better than choice points. Tour participants recognized choice points better than non-choice points. Film participants who did not receive the concurrent description performed better than film participants receiving the concurrent description. There was no effect for supplementary information for the tour group.
Neither group performed well on the location sequencing test. Yet the difference between the two was significant. The film group performed better than the tour group. The type of supplementary information also affected accuracy. The concurrent description group performed worse than the other two groups.
Although both groups’ accuracy was poor, tour participants were more accurate in orientation estimates than film participants. Participants provided with maps prior to the tour or film were less accurate than the control or concurrent description groups.
When estimating Euclidean distance between landmarks, there was no difference between the film and tour groups. Participants who received the map prior to viewing the film gave more accurate estimates than the other participants in the film group. All participants' estimates were less accurate than their route distance estimates.
The minimal differences between the tour and film groups suggest that exposure to a simulated environment can provide information similar to that of direct experience.
Hunt (1984) studied how people learn new buildings by simulating navigation through a building prior to arriving at the building. In this experiment, the simulation consisted of a small-scale three-dimensional model of the building and a series of slides following a path through the building. Participants were assigned to one of three conditions. In the simulation condition, participants viewed the slides and the model simultaneously before seeing the real building. In the building condition, participants traveled the simulated route in the real building. Participants in the control condition did not see the building or the simulation prior to testing.
There were two measures of environmental knowledge: “mental image” of the building, and navigation ability in the building. There were three tests to assess the participant’s mental image.
• Participants matched photographs to the names of locations in the building.
• They identified the shape of the building by picking from 1 of 4 shapes.
• They identified the floor on which a series of 9 rooms was located.
• They marked the location of 9 rooms on a plan of the building.
To test navigation ability, participants performed nine navigation tasks in which they traveled from one location to another in the building. The control group only participated in the navigation test.
Some of the tests required knowledge not shown explicitly in the simulation or on the tour of the building. Other tests were taken directly from the simulation or tour. The
simulation group performed better than the tour group on those tasks that were not directly related to the simulation or tour. The simulation group also performed better than the control group in all but one of the tasks. In contrast, the tour group performed well only when the test assessed knowledge presented during the tour and in the same order as in the tour. The tour group performed better than the control on only five of the tasks.
The results suggest that identification of sites and sequential ordering are important but not sufficient for effective navigation. They also show that simulation can lead to an understanding of spatial arrangement of the environment.
Orzech (1986) evaluated the use of a simulated environment setting to enhance people’s abilities to navigate in a building. She compared two simulation groups and a control group on their ability to navigate in a maze-like environment. Participants in the same-maze group interacted with a simulation of the same environment used for the
The different-maze group used a computer simulation that did not correspond to the real-world space. In both simulation groups, some participants received a map of the maze prior to their using the simulation.
Travel time in the simulation and real-world was one to two minutes. The maze was contained in a 34’ x 45’ area. After completing three simulation trials, participants were told to navigate through the real-world maze. They then returned to the start point.
Orzech found that only the presence of a map improved the same-maze simulation group above the other groups. Within the map condition, exposure to the same maze during simulation, resulted in fewer errors, faster times, and less distance traveled.
During the reversal task (walking back through the path from the target to the start), there was no effect of simulation. All groups improved, i.e., there were fewer errors, less travel time and shorter distance traveled, thereby indicating a rapid learning of the path.
She concluded that simulation is only effective if explicitly associated with the space being simulated. People need to understand the link between the simulation and the real-world. It may be necessary to link orientation, location, distance and direction between the simulation and world.
The improvement and lack of difference in the reversal task may be due to rapid learning of the environment or the inability of participants in the same-maze condition to rotate the simulated environment.
they learned the layout of a large-scale VE. In experiment 1, participants navigated through a virtual building. Their navigation ability was measured longitudinally during 10 different journeys. One group learned the floor plan from a map, the other from controlled exposure to the VE. The VE had 135 rooms, of which 9 contained furniture. There were no landmarks or windows in the VE.
In the simulation condition, participants learned the navigational layout in nine sessions over nine days. In each session, participants visited each of the nine locations in a different order. In the first two sessions, they traveled to each location by following a verbal description of the shortest route. In the remaining sessions, they navigated without help but were subject to help if they did not find the location within 5 minutes. Map participants learned the floor plan by studying the map and then performed the same test as the simulation participants.
To measure knowledge of the building layout, participants in both conditions moved from one location to another. After arriving at a location, they pointed toward each of the other locations, indicated the straight-line distance to the other locations, and the route distance in feet or meters.
After extended practice, participants had near perfect navigation and route distance estimate ability within the VE. Their orientation was similar to people who had worked in the real building for 1-2 months.