Copyright2000 by the Genetics Society of America
The Role of Population Size, Pleiotropy and Fitness Effects of Mutations
in the Evolution of Overlapping Gene Functions
Andreas Wagner
Department of Biology, University of New Mexico, Albuquerque, New Mexico 87131-1091 and The Santa Fe Institute, Santa Fe, New Mexico 87501
Manuscript received February 24, 1999 Accepted for publication November 23, 1999
ABSTRACT
Sheltered from deleterious mutations, genes with overlapping or partially redundant functions may be important sources of novel gene functions. While most partially redundant genes originated in gene duplications, it is much less clear why genes with overlapping functions have been retained, in some cases for hundreds of millions of years. A case in point is the many partially redundant genes in vertebrates, the result of ancient gene duplications in primitive chordates. Their persistence and ubiquity become surprising when it is considered that duplicate and original genes often diversify very rapidly, especially if the action of natural selection is involved. Are overlapping gene functions perhaps maintained because of their protective role against otherwise deleterious mutations? There are two principal objections against this hypothesis, which are the main subject of this article. First, because overlapping gene functions are maintained in populations by a slow process of “second order” selection, population sizes need to be very high for this process to be effective. It is shown that even in small populations, pleiotropic mutations that affect more than one of a gene’s functions simultaneously can slow the mutational decay of functional overlap after a gene duplication by orders of magnitude. Furthermore, brief and transient increases in population size may be sufficient to maintain functional overlap. The second objection regards the fact that most naturally occurring mutations may have much weaker fitness effects than the rather drastic “knock-out” mutations that lead to detection of partially redundant functions. Given weak fitness effects of most mutations, is selection for the buffering effect of functional overlap strong enough to compensate for the diversifying force exerted by mutations? It is shown that the extent of functional overlap maintained in a population is not only independent of the mutation rate, but also independent of the average fitness effects of mutation. These results are discussed with respect to experimental evidence on redundant genes in organismal development.
O
VERLAPPING or partially redundant gene func- why genes with overlapping functions have been re-tions are ubiquitous in eukaryotes. Their presence tained, in some cases for hundreds of millions of years. spans the entire taxonomic range from unicellular or- This holds especially for many partially redundant genes ganisms to mammals. They are observed in proteins of in vertebrates, the result of ancient gene duplications any function, be it enzymatic, structural, or regulatory in primitive chordates (Sharman andHolland1996; (Basson et al. 1986; Hoffman 1991; Lundgren et al. Bailey et al. 1997). This is even more puzzling given 1991;Higashijimaet al. 1992;Goldstein1993;Cadi- that duplicate and original genes can diversify very rap-ganet al. 1994; Gonza´les-Gaita´net al. 1994; Li and idly after duplication (CireraandAguade1998;Tsaur Noll1994a,b;CondieandCapecchi1995;Goodson et al. 1998; Zhanget al. 1998), especially if the action and Spudich 1995; Hanks et al. 1995). Weak or no of natural selection is involved. Thus, are overlapping phenotypic effects of a knock-out mutation in a gene gene functions merely the transient remnants of past thought to play an important biological role are often gene duplication events, a snapshot of a diversification the first indicators of such redundancy. Further analysis process that will eventually be complete? Or are they then typically reveals one or more related genes with perhaps maintained because of their protective role functions similar to that of the mutated gene. With against otherwise deleterious mutations? These ques-some potential exceptions, partially overlapping gene tions are attracting increasing interest (Tautz 1992; functions can be traced to (often old) gene duplications. Thomas1993;Cookeet al. 1997), and for good reasons. While the evolutionary origins of most partially redun- Sheltered from some deleterious mutations, partially dant gene functions are obvious, it is much less obvious redundant genes may be important sources ofevolution-ary novelties on the biochemical level.
This article deals with the two perhaps most serious
Address for correspondence: Department of Biology, University of New
objections to the persistence of overlapping gene
func-Mexico, 167A Castetter Hall, Albuquerque, NM 87131-1091.
E-mail: [email protected] tions as a buffer against mutation. The first objection
concerns the population size required to stably maintain overlapping gene functions in a population. Even neu-tral mutations in genes with overlapping functions are likely to lead to diversification of the gene’s functions. Counteracting this evolutionary force is a much slower process of “second order” selection for maintaining overlap (Wagner 1999), a process that acts on ences in functional overlap among genes. These differ-ences are selectively neutral, but genes with greatly over-lapping functions are less likely to undergo deleterious mutations than genes with distinct functions. Over time, genes with greater functional overlap will be preferen-tially retained in a population. Because of the indirect nature of this process, populations have to be large to sustain the amount of variation in overlap on which selection can act. A past contribution has shown that the required population sizes are not impossibly large (Wagner 1999). Here, it is shown that even in small populations, pleiotropic mutations that affect more than one of a gene’s functions simultaneously can delay functional divergence by orders of magnitude. More-over, in contrast to the maintenance of genetic variation in fluctuating populations, the evolution of functional overlap may be predominantly influenced not by occa-sional population bottlenecks but by occaocca-sional popula-tion size bursts.
The second potential objection regards the fact that most naturally occurring mutations are likely to have much weaker fitness effects than the rather drastic
“knock-out” mutations that lead to detection of partially Figure1.—(a) A group of genes regulated by a transcrip-redundant functions in the laboratory. Given weak fit- tion factor (TF). (b) After duplication of the transcription factor gene, the same genes are now regulated by both original ness effects of many mutations, is the selection process
and duplicate. (c) Over time, each factor may lose the ability outlined above strong enough to compensate for the
to regulate some of the genes, such that only a subset of genes diversifying forces exerted by mutations? It is shown that
(hatched) are regulated by both factors. the evolution of mean fitness and functional overlap
are effectively decoupled. This implies that the average effect of deleterious mutations on fitness does not
greatly influence the evolution of functional overlap cific enzymatic reactions, may be restricted in their abil-ity to evolve functional overlap. The specificabil-ity of their and vice versa. This also has implications on the genetic
load associated with overlapping gene functions, as dis- function may be part of the reason why housekeeping genes are rarer among the documented cases of func-cussed below.
To address the above questions, this contribution uti- tional overlap.) Consider the case of a transcription factor (Figure 1a), regulating the expression of multiple lizes a conceptually simple mathematical model that
relies on three main assumptions (Wagner1999). First, genes involved in a developmental process. Transcrip-tion factors occupy a prominent role in the many exam-the greater exam-the functional overlap among genes, exam-the
greater the fraction of mutations in either gene that ples of genes with overlapping functions (Joyneret al. 1991;Weintraub1993;Maconochieet al. 1996). After are phenotypically neutral. Second, both neutral and
nonlethal deleterious mutations cause gene functions duplication (Figure 1b) and diversification (Figure 1c), the functional overlap among duplicate and original to diverge. A third assumption, already implicit in the
above discussion, is that overlap among gene functions can be viewed as the subset of genes regulated by both factors. Microarray technology (Schena1996) has made is a quantifiable variable, at least in principle.
While the first two assumptions are unproblematic, the quantification of such overlaps a realistic goal: per-turb the activity of each factor in separate experiments, the third requires further comment. Two examples
illus-trate its validity. Overlapping gene functions are espe- measure the resulting change in gene expression pat-terns, and assess which subset of genes is affected simi-cially prominent among regulatory developmental genes,
spe-patterns that are not completely congruent (Li and modeled by others (Ohno 1970;Neiand Roychoud-hury1973; Kimura and King 1979; Maruyama and Noll1994a,b;Hankset al. 1995). Here, the extent of
spatiotemporal overlap in two expression domains can Takahata1981;Watterson 1983;Ohta1987; Mar-shall et al. 1994; Walsh 1995). Also, empirical data be taken as a measure of functional overlap. Recently
developed automated image processing technology to suggest that the complete elimination of one gene’s function may be much less frequent than commonly quantify the concentration of multiple gene products
in a developing embryo at single cell resolution enables assumed (Allendorf et al. 1975; Ferris and Whitt such quantification (Kosmanet al. 1998). 1976, 1979;NadeauandSankoff1997).
Summary of previous results:Because results from a previous contribution (Wagner1999) are used below, MODEL AND RESULTS
they are briefly reviewed here. In this earlier article, it was assumed that all nonneutral mutations, occurring The model is concerned with a population of haploid,
at a rate of 2(1⫺r) per two genes with overlap r, are randomly mating organisms with nonoverlapping
gen-effectively lethal. The evolution of the distribution of erations. The assumption of haploidy is chosen merely
because it exposes most clearly the key evolutionary functional overlap, pt(r), in a population was studied principles at work. The genic mutation rate is denoted under this assumption. The recurrence equation as ( Ⰶ 1). Neutral mutations that do not affect
any aspect of the function of a gene product are not
pt⫹1(r)⫽
(1⫺2)pt(r)⫹2
冮
10 zpt(z)mr(r|z)dz
(1⫺2)⫹ 2
冮
10 zpt(z)dz
(2) considered.
The central concept of the model is the notion of
partially redundant or overlapping gene functions, and describes the distribution pt(r) of r in generation t of a that the overlap in two gene’s functions can be quanti- large population (N ⬎50; Wagner1999). It can be fied. Specifically, let the variable r, rⱕ0ⱕ1, denote a shown that the mean functional overlap among two measure of the functional overlap of two genes. If r⫽ genes r⫽兰1
0 rp(r)dr reaches a nonzero
mutation-selec-1, then two genes have completely identical functions; tion equilibrium independent of the initial condition if r ⫽ 0, there is no overlap in the gene’s functions. and approximated by
If two genes have overlapping functions, then some
mutations that eliminate one gene’s function will be r∞⫽
冪
2mrr 23r ⫺3r2⫹1
. (3)
neutral because the function is covered by the other gene. This is conceptualized in the following way: if r⫽
1 (identical functions), all mutations are neutral; if r⫽ Here,2
mris the variance of the effect of mutations on 0, no mutation is neutral; and if 0⬍r⬍1, the rate of r, defined as2
mr⫽兰10(r *⫺ rr)2mr(r *|r)dr *. This
approx-neutral mutations is some function f(r). The simplest imation holds for values of r∞ in the interior of (0,1), case is that of a linear relation, in which the rate of requires no further assumptions about the distribution neutral mutations per two genes is given by 2r (neglect- of mutational effects, and is independent of the muta-ing terms of order2). While this linear relation is used
tion rate. It is in good agreement with numerical results throughout most of this section, the consequences of (Wagner1999). When this model was extended to n relaxing this assumption are explored. genes with overlapping functions, it was found that (i) Not only can mutations affect fitness, but also they the extent of overlap maintained in mutation-selection may change the functional overlap among two genes, balance is statistically indistinguishable from that for which will in general lead to a divergence in gene func- the two-gene case, and (ii) linkage relations are not tions. This is modeled by a conditional probability
den-likely to favor or disfavor the evolution of overlap. These sity mr(r *|r), which denotes the probability that the
func-results motivate the restriction to the two-gene case with tional overlap r * after mutation of two genes with
tight linkage analyzed below. overlap r before mutation lies in the interval (r *, r *⫹ For small population N Ⰶ
1, it was found that func-dr *). To leave the formalism as general as possible, only
tional overlap diminishes (functions diverge) at a rate the minimal assumption that mutation reduces r on
approximated by average by a factorris made, i.e.,
d具rt典
dt ⫽lnr
2具rt典2
(1 ⫺2)⫹ 2具rt典. (4)
冮
1 0r *m(r *|r)dr *⫽ rr, (1)
Here, 具rt典 denotes the mean functional overlap in an where 0⬍ r⬍ 1. Because a value of r⫽ 0.5 means
ensemble of small populations. In the absence of selec-that each mutation reduces r by1⁄
2 on average (a very
tion, mutations (1) would lead to an exponential decline rapid divergence rate),r⬎0.5 is used here. Complete
in 具rt典 from an initial value of one immediately after loss-of-function mutations could be modeled as an
im-gene duplication. The most important feature of (4) is portant special case, but are not considered here,
the functional overlap between two genes, the lower the increased rate of nondeleterious mutations can be main-tained among genes in large populations, and (ii) func-rate at which functions continue to diverge. The reason
tions diverge, albeit very slowly, in small populations. is that most mutations that affect r are neutral for large
Evolution of functional overlap and of mean fitness
r but deleterious for small r. This leads to a reduction
are decoupled:In this article the assumption of lethality in r following a polynomial rather than an exponential
of nonneutral mutations is relaxed. Specifically, fitness rate.
of an organism w is interpreted as a probability of sur-In sum, if all nonneutral mutations have severely
dele-vival, and nonneutral mutations in an organism with terious effects, then (i) functional overlap and thus an
fitness w reduce fitness by a factorw:
冮
1 0w *m(w *|w)dw *⫽ ww. (5)
This formula, completely analogous to (1), allows for an increase in fitness provided that the variance of muta-tional effects on fitness2
mw⫽兰10(w*⫺ ww)2mw(w*|w)dw*
is large, but also ensures that mutations reduce mean fitness on average by a factor w ifw ⬍ 1. Of interest is the evolution of the joint distribution of functional overlap and fitness pt(r,w), as well as the moments riwj
t⫽兰10兰10riwjpt(r,w)drdw. In a large population, pt(r,w) will evolve according to
pt⫹1(r,w)⫽(1/Dt)[(1⫺ 2)wpt(r,w) ⫹ 2w
冮
10zrpt(zr,w)mr(r|zr)dzr
⫹ 2w
冮
1 0冮
1
0(1⫺ zr)pt(zr,zw)
⫻ mw(w|zw)mr(r|zr)dzrdzw]. (6)
The denominator
Dt⫽ (1⫺2)wt ⫹2rwt⫹ 2w(wt⫺ rwt) (7)
is a normalization factor representing the fraction of individuals surviving from one generation to the next. In the numerator, (1 ⫺ 2)wpt(r,w) is the fraction of individuals that do not undergo mutation in genera-tion t and that survive into the next generagenera-tion.
Figure 2.—Mean fitness evolution and mean functional overlap in mutation-selection balance. (a) Mean functional overlap at mutation-selection equilibrium for w⫽ 0.9, i.e., nonneutral mutations reduce fitness on average by 10%. Dots and bars represent mean fitness and one standard deviation as obtained from Monte Carlo simulations. Mean equilibrium overlap scales linearly withmr/(1⫺ r), whereris the mean reduction in functional overlap caused by mutation, andmr is the standard deviation of this reduction. The solid line represents the analytical prediction (3) forw⫽0, i.e., where all nonneutral mutations are lethal. Note that equilibrium overlap maintained is statistically indistinguishable from that in the lethal case (solid line). (b) One minus mean fitness (dots and bars) and correlation between fitness and functional overlap (solid line) in mutation-selection equilibrium. The dashed line represents√. Note that despite the high mutation rate ⫽10⫺2used here for reasons of computational
Figure 4.—Population size fluctuations and evolution of overlap. Shown are mean and standard error of overlap in an ensemble of 50 populations after 5000 generations of evolu-tion. The simulation was started at a mean overlap of 0.28, which is the mean overlap at mutation-selection balance in a very large population, as predicted by (3) for the parameters used (r⫽ 0.09,w⫽ 0, mr ⫽ 0.05, ⫽ 0.25). Solid bars correspond to a population of constant size (Ne⫽N ) such
that Nehas the value indicated on the abscissa. Open bars
correspond to populations of fluctuating size with the same value of Neas for the adjacent solid bar, where each
popula-tion spent tL⫽250 generations in a regime of large population
size (NL⫽ 10,000) and tS⫽250 generations in a regime of
small population size, NS. NSwas calculated from (9) as NS⫽
Figure 3.—(a)Dependency of mean fitness at
mutation-f NeNL/(NL⫺Ne(1⫺f )), with f⫽tS/(tL⫹tS). Mean overlap
selection equilibrium, plotted as 1⫺w, on w, the average
for Ne ⫽5 and constant population size was equal to 1.5⫻
factor by which mutations reduce fitness. N⫽5⫻104, mw⫽
10⫺5, a value too small to appear on the plot.
0.05, 104 generations simulated. Dots represent population
means, bars one standard deviation. (b) Dependency of mean functional overlap at mutation-selection equilibrium on the mutation rate. Note the logarithmic scale for the mutation rate. Computational feasibility alone motivated the choice of
a rough estimate for the correlation (r,w) between range for. Note that even for high mutation rates,
equilib-fitness and overlap in mutation-selection balance. The rium overlap is statistically indistinguishable from the
analyti-cal prediction (3), represented by the solid horizontal line. estimate, derived in the appendix, suggests that this
w⫽ r⫽0.9,mr⫽0.05,mw⫽0.01, N⫽500/generations correlation is small; i.e., simulated.
(r,w)⫽ Cov(r, w)
√
Var(w)Var(r)is of order√
. (8) 2w兰10zrpt(zr,w)mr(r|zr)dzr is the fraction of individuals This crude approximation (seeappendix) is fully sup-with fitness w that undergo a neutral mutation changing ported by numerical results, exemplified in Figures 2 r from some value zrto r and that survive into the next and 3. Figure 2 shows that both in cases where mutations generation. Finally, 2w 兰1
rate is varied over two orders of magnitude (figure 3b). pear that the concept of effective population size (HartlandClark1997) from population genetic the-Further, the difference between w and one is of the
ory holds the answer to this question. For populations order regardless of the values ofr(Figure 2, c and
that spend a fraction f of their time in a regime of small d) orw(Figure 3a). In sum, functional overlap at
equi-Nby having a small population size NS, and a fraction
librium is independent of the mutation rate and of the
1⫺f in a regime of large Nby having a large NL, one
severity of mutational effects on fitness (w). Conversely,
calculates the (inbreeding) effective population size as mean equilibrium fitness is not sensitive to changes in
the rate at which mutations lead to a decay of
redun-dancy (r). In this sense, evolution of redundancy and Ne⫽
NSNL fNL⫹ NS(1⫺f )
. (9)
fitness are decoupled. The reasons for this are discussed
below. A population of fluctuating size with a given Neshould
Transient population size bursts may be sufficient to then behave in exactly the same manner as a population
maintain redundancy: While the maintenance of func- of constant size N⫽Ne. Numerical results from Figure
tional overlap by means of natural selection requires 4 indicate that this is not the case for the evolutionary large populations (N Ⰷ1), overlap may decay relatively process studied here, because fluctuating and constant slowly in small populations (Wagner 1999). This populations with the same Ne show different mean
prompts a question as to what fraction of time a popula- overlap.
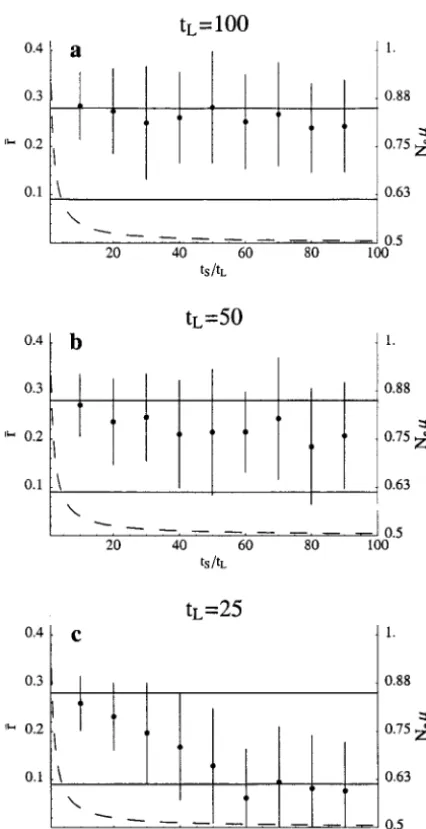
tion of fluctuating size has to spend in a large Nregime Figure 5 shows more extensive numerical results for for overlap to be maintained by selection. It might ap- the evolution of overlap under fluctuating N, where a population spends alternatingly tS generations in a
regime of small N, in which redundancy will decay under the influence of drift, and tL generations in a
regime of large N, where selection will maintain func-tional overlap. The figure shows mean funcfunc-tional over-lap in a population ensemble after 105generations, as
a function of the ratio tS/tL of time spent in the small Nregime. For comparison, a dashed line shows Ne
Figure5.—Influence of fluctuations in Non functional overlap. Dots and bars correspond to mean and standard deviation of functional overlap 具r典 among two genes in an ensemble of 50 populations after 105generations of simulated
evolution with fluctuating population size. The simulation was started at a mean overlap corresponding to the upper horizontal line, which is the mean overlap at mutation-selec-tion balance for a very large populamutation-selec-tion from (3). The lower horizontal line is the value to which functional overlap would decline from this initial value after 105 generations if the
population ensemble was under the sole influence of drift for the parameters used here. In the simulation, the population ensemble spent alternatingly tSgenerations in a regime of low
N (dominated by drift) and tLgenerations in a regime of
high N(dominated by selection). This cycling was repeated until 105 generations had elapsed and was continued after
that until the end of the next period of small Nwas reached. At that time, ensemble overlap statistics were evaluated. The dashed curve represents the value of Neas a function of tS
and tL, where Neis the inbreeding effective population size
calculated from tSand tL. For the entire range of this plot, the
values of Nesuggest that the evolutionary dynamics should
be dominated by drift, such that the mean ensemble overlap should be close to the lower horizontal line (Wagner1999, Figure 7). However, as long as⬎50 generations are spent in each cycle of large population size (tLⱖ 50), the influence
of selection continues to be appreciable, even if only a small fraction of time is spent in the large population regime. Only for smaller tLdoes drift dominate if tS/tL⬎50. For reasons of
computational feasibility, it was the mutation rate and not the population size that was varied. N⫽1000,S⫽0.0005,L⫽
as calculated via (9), where f⫽ tS/(tL ⫹tS). Note that ulated by each of two genes encoding a transcription
factor (see Figure 1). Assume that, over time, mutations Ne is smaller than one for all the values of tS and tL,
such that drift should dominate the dynamics of overlap randomly eliminate the capability to carry out some of these functions in each of the genes, such that only a (Figure 7 inWagner1999). However, for many of the
values of tS and tL in Figure 5, populations maintain fraction r⫽kr/k of the original k functions is still
per-formed by both genes. In this context, mutations with levels of overlap indistinguishable from or close to those
in mutation-selection balance for infinite populations, pleiotropic effect can be viewed as those that eliminate more than one, say l, function. If k is sufficiently large, despite the fact that they spend only a small fraction
of time in the large Nregime. Whereas the absolute then the probability that such a pleiotropic mutation is neutral is approximated by rl. As a consequence, for amount of time tLspent per cycle in the large Nregime
is clearly important in determining how much overlap a given overlap r, the probability f(r) that a mutation eliminating l functions is neutral is given by f(r)⫽ rl. is maintained, it is equally clear from Figure 5 that
substantial overlap is maintained even for transient In other words, the more extensive pleiotropic effects are, the smaller the protective effect against mutations bursts in N. For instance, Figure 5a shows that
func-tional overlap close to that observed in mutation-selec- afforded by a given overlap r. Only in the absence of pleiotropic effects does the simple relation r⫽f(r) hold. tion equilibrium (infinite population size) is maintained
if the population spends only one-hundredth of its time, In practice, mutations span a range of pleiotropic ef-fects, suggesting that f(r)⬍r, under the constraints that or 100 out of 10,000 generations in the large Nregime.
A caveat to these results is that computational limitations f(1)⫽1 and f(0)⫽0. Below, the effect on the evolution of redundancy of a moderate degree of pleiotropy (l⫽ in simulating large populations necessitated modulating
rather than N to simulate changes in N. Note also 2, 3) via the relation f(r)⫽ rlis explored (Figure 6a). The evolution of具rt典, the mean functional overlap in that the specific values of tSand tLnecessary to maintain
overlap will depend on multiple factors, such as the a population ensemble evolving under the influence of genetic drift, can be approximated by an ordinary location of the mutation-selection equilibrium, the
vari-ance in overlap introduced by mutation, and probably differential equation even the selection regime (soft selection vs. hard
selec-tion;HartlandClark1997). Unfortunately, an analyt- d具rt典
dt ⫽lnr
2具rt典1⫹l
(1⫺2)⫹ 2具rt典l, (10) ical approach to this problem, which could both
circum-vent computational limitations and account for these which is a simple extension of (4) to lⱖ1. Here, one factors, is currently not at hand. unit of time corresponds to one (discrete) generation, Why is Nenot a reliable indicator for the evolution and lⱖ1 is the exponent in the function f(r) ⫽ rl. A
of overlap (Figure 4) in fluctuating populations? Even solution to this equation can be obtained as an implicit in the absence of analytical predictions for the change function by a separation of variables, yielding
of r in fluctuating populations, it is safe to say that
this must have to do with the different evolutionary
冢
1 lnr冣冤冢
1⫺2 2
冣 冢
1 l
冣 冢
1⫺1
具rt典l
冣
⫹ln具rt典冥
⫺t⫽0 dynamics of genetic variation and functional overlap.Genetic variation gets lost much faster in small
popula-for the initial condition 具r0典 ⫽ 1. From this form of
tions than in large populations. I surmise that this is
the solution, one can directly determine the time x not true in the case of functional overlap. Whereas the
necessary for 具r典 to decrease from one shortly after a amount of genetic variation maintained in a fluctuating
gene duplication to a value of x. Let us consider the population may be most heavily influenced by the
popu-special case of the times tk⫽ (1/2)k necessary to reduce
lation bottlenecks, the amount of functional overlap 具 rt典to (1⁄
2)k. One can show that
may be most heavily influenced by the largest
popula-tion sizes. t
k⫹1⫺tk⫽ ⫺
冢
1 lnr
冣冤冢
1⫺2 2
冣冢
2lk
l
冣
(2l⫺1)⫹ln 2
冥
⬀2 lk(2l⫺1)l . Pleiotropic effects slow down divergence of gene
functions:Among the many possible relations of
func-(11)
tional overlap r and the probability f(r) that a mutation
leading to a loss of one or more functions in one gene The times tk⫹1 ⫺ tknecessary for successive halving of
具rt典not only scale as 2k, i.e., each consecutive halving of is phenotypically neutral, only f(r) ⫽ r has been
ex-plored so far. The following scenario illustrates the role functional overlap takes twice as long, they also scale as 2l. Thus, how fast functional overlap will decay depends that pleiotropic mutations may have in this relation and
motivates a more general mathematical form for f. Con- critically on the extent of pleiotropy of mutations. Fig-ure 6b shows the decrease of functional overlap from sider duplicate and original of a gene shortly after a
gene duplication, where both copies carry out each of 具r0典 ⫽ 1 obtained from a numerical solution of (10)
(solid lines) and from Monte Carlo simulations (dots k functions. These could be k spatiotemporal expression
domains, in which each of the two genes are involved and bars) for realistic mutation rates ( ⫽2.5⫻10⫺6)
reg-ensemble overlap clearly slows down as the extent of more and more likely to eliminate nonredundant func-tions as the functional overlap between two genes de-pleiotropy increases. However, over longer evolutionary
creases. Because such mutations are deleterious and are timescales than those depicted here, differences among
eliminated from the population, the decay of overlap the different degrees of pleiotropy are more dramatic
via neutral mutations and drift is slowed down. If most than Figure 6b suggests. Figure 6c shows, on a
linear-mutations have effects on many of a gene’s functions, log scale, the times1/2,1/4, and1/8obtained from (11)
one may observe significant functional overlap (congru-as a function of l. It shows that (i) for an incre(congru-ase of l
ent expression patterns, etc.) maintained over long evo-from 1 to only 3, each of these times increases by a
lutionary timescales. This is because most mutations will factor 10 to 100 and (ii) for l⫽3, the time to decrease
also affect the few unique functions of a gene and thus
具r典by each additional factor of1⁄
2increases by
approxi-be deleterious. In this case, extensive functional overlap mately a factor 10.
may not indicate effective buffering against mutations. In sum, even moderate degrees of pleiotropy lead to a
severe constraint on how much genetic drift can reduce functional overlap among genes. The intuitive
explana-DISCUSSION tion is simple: mutations with pleiotropic effects are
The model explored here rests on three simple as-sumptions: (i) genes have functions that overlap in a quantifiable way; (ii) overlapping functions affect the probability of mutations being neutral; and (iii) muta-tions, on average, reduce functional overlap. As in any mathematical model, simplifications and abstractions were made. A haploid system has been modeled to illus-trate the issues discussed below most clearly.
Purifying and directional selection:The model does not incorporate advantageous mutations leading to novel functions. Instead, its restriction to purifying selec-tion and neutral mutaselec-tions reflects an implicit assump-tion that genes diversify mostly by (i) loss of some of their functions and, thus, functional specialization, or (ii) acquisition of new functions by neutral mutations. Whether this is the case may well depend on the type of genes considered. For instance, genes involved in self-recognition or reproductive functions are more likely to be subject to positive selection for diversification (Cir-era and Aguade 1998; Ting et al. 1998; Tsaur et al. 1998). On the other hand, many of the most striking examples of partial redundancies come from genes em-bedded in highly conserved developmental pathways, such as that of muscle determination (Weintraub 1993). In these cases, there may be a limited potential for the evolution of novel functions, such that
diver-Figure6.—Pleiotropy slows the decay of functional overlap. (a) The function f(r)⫽ rlillustrates how the probability of
neutral mutations for two genes of a given functional overlap r is influenced by the number of functions l affected per mutation. (b) Evolution of functional overlap具r典in a popula-tion ensemble (20 populapopula-tions) under the influence of drift as a function of the degree of pleiotropy l. Dots and bars represent means and standard deviations as obtained from a Monte Carlo simulation. The solid lines are numerical solu-tions of (10);r⫽ 0.5,mr⫽0.05,w⫽0, ⫽2.5⫻10⫺6. As l is increased from 1 to 3, the decay of r slows. (c) Times
xuntil具r典decreases from 1 to x as a function of the degree of pleiotropy l as calculated from (10). A linear increase in l leads to an exponential increase inx; r⫽ 0.9,mr⫽0.05,
gence by specialization may be prevalent (Force et al. evolved (Crow and Kimura 1965; Kondrashov and Crow1991;Maynardand Smith1978;Perrotet al. 1999). Corroborating evidence comes from
experi-ments where a gene from an invertebrate (before dupli- 1991;OttoandGoldstein1992). On the other hand, diploids carry a higher mutational load (mean fitness cation) can substitute for the function of one of its
duplication products in very distantly related verte- reduction due to deleterious mutations) than haploids, because they carry twice as many alleles (e.g.,Crowand brates, or vice versa. If the vertebrate gene had evolved
radically new functions, such substitution might not be Kimura1965). The higher mutational load counteracts the effects of masking, raising the question of which of possible. Examples include nautilus and decapentaplegic
from Drosophila melanogaster and their respective coun- these two forces wins out in the evolution of ploidy levels. The question has been studied by various authors, terparts MyoD and BMP in mammals (Venuti et al.
1991;Padgettet al. 1993). However, the restriction to mostly in the framework of modifier theory (Perrotet al. 1991;Bengtsson1992;OttoandGoldstein1992). divergence by neutral mutations should not be read as
an exclusive endorsement of one evolutionary scenario. The answer depends on details of parameters such as recombination rates and degree of dominance. It is rather an acknowledgment that this scenario is
relevant for many developmental genes. There are key differences in the questions studied here from those at issue in existing models of the
evolu-Mutational load and deleterious mutations: For the
model studied here, mean fitness and mean functional tion of ploidy levels. First, the increase in frequency of original gene and duplicate (corresponding to the rise overlap among genes are only weakly correlated at
muta-tion-selection balance (Figure 2). The reason is the fol- of diploidy from haploid organisms) is not at issue here. Fixation of gene duplications must be a ubiquitous phe-lowing. If organisms in a population have different
fit-nesses, selection acts immediately on these differences, nomenon, because a vast number of known proteins fall into a small number of gene families. Theoretical e.g., via differential survival probabilities. In contrast, if
some organisms in a population have genes with lower work suggests that such fixation is easily accomplished by neutral evolution (even without any selective advan-functional overlap than other organisms, these
differ-ences are selectively neutral until mutations occur at tage through “masking”) provided that duplications oc-cur at a finite rate (Clark1994). At issue is rather the these genes, which takes of the order of 1/generations
per individual. In this case, the genes with the higher question if and how functional overlap is maintained, once established. A second distinction stems from the functional overlap r are less likely to undergo
deleteri-ous mutations (which are then rapidly eliminated by notion of deleterious mutations. It is best illustrated with the example of a set of genes regulated by one selection), and they therefore accumulate slowly in the
population. Thus, one might think of the evolution of transcription factor whose gene has undergone gene duplication and subsequent loss of some functions be-mean fitness and of be-mean overlap as occurring on
differ-ent timescales, and this is what causes them to be effec- tween original and duplicate (Figure 1). As long as all genes are properly regulated by at least one of the two tively decoupled.
As a consequence, mean functional overlap is inde- factors (Figure 1c), no fitness disadvantage will result. However, from the perspective of a classical population pendent of the fitness effects of deleterious mutations
(Figure 2). Whether deleterious mutations have only genetic model, all transcription factor genes that have lost the ability to regulate at least one gene in the set moderate fitness effects, or whether they are invariably
lethal, they are eliminated at a rate much faster than would harbor “deleterious” mutations, because if the allele complementing their missing functions (at a dif-that at which the evolution of overlap occurs.
Con-versely, mean fitness at equilibrium differs from 1 only ferent locus in the case of duplicate genes, at the same locus on a sister chromosome in the case of diploidy) by an amount that is of the order of the mutation rate,
similar to what would be expected from a haploid two- did not occur in the same organism, the organism would have reduced fitness. This creates the somewhat para-locus model with recurrent mutations. This is because
overlap influences only the rate of deleterious mutations doxical situation where an entire gene pool may consist of deleterious alleles that nevertheless complement (1⫺r). Whether r is large or small, the reduction in
mean fitness from 1 is thus still of the order of. An each other functionally, so that no organism with re-duced fitness exists in the population. Thus, where important corollary is that overlapping gene functions
are not maintained because they convey a higher mean multifunctional proteins may undergo specialization after gene duplications via loss of some of their func-fitness on a population with greater functional overlap.
In this sense maintenance of functional overlap is not tions, the notion of intrinsically deleterious mutations may not be a natural one. It may be more expedient to an adaptive phenomenon (Futuyma1998).
Evolution of diploidy and redundant gene functions: call a mutation deleterious only if it actually affects fit-ness. However, even if the notion of “intrinsically” dele-A phenomenon superficially related to the evolution of
redundancy is the evolution of diploidy. Diploids are terious mutations is abandoned, the question remains whether overlapping gene functions influence mean able to “mask” the fitness effects of deleterious alleles,
The answer is yes, but to no significant extent. In the may be lost slowly in small populations. It would clearly be desirable to have a measure of effective population simple case where all deleterious mutations are lethal,
mean equilibrium fitness is 1 ⫺ 2if two genes have size suitable to predict the decay of redundancy in fluc-tuating populations.
completely diverged in function; it is 1⫺2(1⫺ r) if
mean equilibrium overlap is equal to r. Thus, differences Population sizes with N Ⰷ 1 are realistic for most microorganisms and some invertebrates. However, even in mutational load are small. This result will not be
greatly affected if deleterious mutations have less severe in higher vertebrates, census population sizes are some-times well within this realm, although population sizes effects, because mean equilibrium fitness is still of order
1⫺ . may undergo frequent bottlenecks. For example, a study
by Avise et al. (1988) reports a discrepancy between Decoupling of the evolution of overlap and
redun-dancy shows thatrand its associated standard deviation current population sizes and historical population sizes in three vertebrate species including catfish (Arius felis) of mutational effects mr are the only parameters
de-termining the evolution of functional overlap. Although and redwing blackbirds (Agelaius phoeniceus). Census population sizes suggest a number of 107and 2 ⫻107
functional overlap can be measured, as discussed above,
such measurements are not available, and thus it is diffi- breeding females, respectively. However, data on mito-chondrial DNA variation suggest that past population cult to estimate these parameters from experimental
data. As far asmris concerned, it is perhaps most im- sizes must have been substantially smaller (Aviseet al. 1988). Nevertheless, even if large population sizes are portant that some mutations must increase functional
overlap among genes for selection to sustain overlap sustained over only short periods of time, functional overlap among genes might be maintained in such pop-(Wagner 1999). Ample indirect evidence that this is
the case comes from the many examples of functionally ulations. More data on population size history would be required to determine whether population bursts convergent proteins in various organisms (Doolittle
1994). Measurement ofris hampered by two additional are frequent enough even in organisms normally char-acterized by small N.
factors, the significant stochastic component in the
evo-lution of overlap (see below) and its dependency on An observation unrelated to the significance of popu-lation fluctuations can be made from the results shown the nature of the genes considered.
Population size fluctuations and redundancy:Natural here. “Error” bars shown in Figure 5 represent the stan-dard deviation of functional overlap among populations populations differ from the constructs of theoretical
population genetics in many ways, e.g., mating does not within a population ensemble. Because these popula-tions spend a significant amount of time in the small occur at random, individuals show a clumped spatial
distribution, and populations fluctuate in size. Such de- Nregime, they are monomorphic most of the time. This means that the standard deviation shown is a good viations can be dealt with effectively by calculating an
effective population size Neaccording to standard for- measure of differences in functional overlap among
populations evolving in parallel. These diffferences are mulas (Hartl and Clark 1997). A recent survey on
the relation of Neand N in a large number of vertebrate obviously large (Figure 5), which is due to variation in
the number of mutations reducing overlap that go to and invertebrate populations suggests that fluctuations
in population size are by far the most important factor fixation. In some populations, several such mutations may have gone to fixation, in others only few. This holds influencing Ne(Frankham1995).
Population size is a key factor in determining whether not only for populations evolving in parallel, but would also apply to multiple gene pairs evolving in parallel in selection can maintain functional overlap among genes.
Only if the influence of drift is weak, i.e., in populations one lineage. The importance of stochastic effects may help explain why some developmental genes duplicated with large size N, can overlap be maintained
indefi-nitely, or even be built up from disjoint functions early during chordate evolution have preserved greater functional overlap than others. Examples might include (Wagner1999). Perhaps surprisingly, Nedoes not seem
to be sufficient to predict the dynamics of overlap in members of the MyoD gene family (Weintraub1993), where significant overlap in functions has been main-fluctuating populations (Figure 4). With some caveats
due to computational limitations and the absence of tained, vs. members of the hedgehog gene family, which have almost completely diverged in expression pattern analytical predictions, the results shown in Figure 5
sug-gest that short spikes (e.g., 50–100 generations every (BitgoodandMcMahon1995).
Pleiotropy slows the decay of overlap in small
popula-10,000 generations) in Nmay sometimes be sufficient
to sustain high levels of functional overlap. The reason tions:A large fraction of an organism’s genomic gene content may be expressed during the development of for the inadequacy of Ne to predict the dynamics of
overlap has to do with the different evolutionary dynam- each organ system (ThakerandKankel1992;Datta et al. 1993). This suggests that each developmental gene ics of genetic variation (for which Newas designed) and
functional overlap. Whereas genetic variation gets lost participates in many developmental processes, in line with evidence from many well-studied genes, which are much faster in small populations than in large
Such developmental multifunctionality is comple- derestimated given the vast amount of time that has elapsed since these duplications occurred.
mented by biochemical multifunctionality of proteins. Transcription factors exemplify this well (Figure 1). If each gene regulated by a transcription factor is viewed
as one function of that factor, then most transcription LITERATURE CITED factors are multifunctional. The abundance of
multi-Allendorf, F. W., F. M. UtterandB. P. May,1975 Gene
duplica-functionality in regulatory genes, both developmentally tion within the family Salmonidae. II. Detection and determina-and biochemically, suggests that pleiotropic effects of tion of the genetic control of duplicate loci through inheritance studies and the examination of populations, pp. 415–432 in
Iso-mutations should be pervasive, as Wright (1968)
al-zymes IV: Genetics and Evolution, edited byC. L. Markert.
Aca-ready foresaw. In other words, most mutations may af- demic Press, New York.
fect more than one function of a developmental gene. Avise, J. C., R. M. BallandJ. Arnold,1988 Current versus historical population sizes in vertebrate species with high gene flow: a
Now what does this have to do with the evolution of
comparison based on mitochondrial DNA lineages and
inbreed-functional overlap? ing theory for neutral mutations. Mol. Biol. Evol. 5: 331–344. Envision a scenario such as that shown in Figure 1, Bailey, W. J., J. Kim, G. P. WagnerandF. H. Ruddle,1997
Phyloge-netic reconstruction of vertebrate Hox cluster duplications. Mol.
where a transcription factor regulating the expression
Biol. Evol. 14: 843–853.
of multiple genes undergoes gene duplication, and sub- Basson, M. E., M. ThorsnessandJ. Rine,1986 Saccharomyces cerevis-sequently the original and the copy lose some of their iae contains two functional genes encoding 3-hydroxy-3-methyl-glutaryl-coenzyme A reductase. Proc. Natl. Acad. Sci. USA 83:
functions. In small populations, functional overlap will
5563–5567.
decay according to (4). The key feature of this equation Bengtsson, B. O.,1992 Deleterious mutations and the origin of is that the reduction of overlap proceeds more and the meiotic ploidy cycle. Genetics 131: 741–744.
Bitgood, M. J.,andA. P. McMahon,1995 Hedgehog and Bmp genes
more slowly as more and more functions get lost. This
are coexpressed at many diverse sites of cell-cell interaction in
is because as the number of functions not covered by the mouse embryo. Dev. Biol. 172: 126–138.
the other genes increases, the likelihood that a loss- Cadigan, K. M., U. GrossniklausandW. J. Gehring,1994 Func-tional redundancy: the respective roles of the two sloppy paired
of-function mutation affects a unique function and is
genes in Drosophila segmentation. Proc. Natl. Acad. Sci. USA
deleterious increases as well. This slowing down in evolu- 91:6324–6328.
tion is quite drastic. Pleiotropic mutational effects con- Cirera, S.,andM. Aguade,1998 Molecular evolution of a duplica-tion: the sex-peptide (Acp70A) gene region of Drosophila
sub-tribute further to this phenomenon. A simple argument
obscura and Drosophila madeirensis. Mol. Biol. Evol. 15: 988–996.
presented above suggests that if a mutation affects l Clark, A. G.,1994 Invasion and maintenance of a gene duplication. functions at a time, then the probability of a mutation Proc. Natl. Acad. Sci. USA 91: 2950–2954.
Condie, B. G.,andM. R. Capecchi,1995 Mice with targeted
disrup-in one of two genes with overlap r bedisrup-ing neutral is of
tions in the paralogous Hox genes Hoxa-3 and Hoxd-3 reveal
ge-order rl. Thus, if pleiotropic mutations affect a
suffi-netic interactions. J. Cell. Biochem. Suppl. O: A7–A109.
ciently large number l of functions, then mutations will Cooke, J., M. A. Nowak, M. BoerlijstandJ. Maynard-Smith,1997 Evolutionary origins and maintenance of redundant gene
expres-often have deleterious effects even if r is large. This
sion during metazoan development. Trends Genet. 13: 360–364.
should lead to a further slowing down of the decay of Crow, J. F.,andM. Kimura,1965 Evolution in sexual and asexual redundancy, an intuition confirmed by analytical and populations. Am. Nat. 99: 439–450.
Datta, S., K. StarkandD. R. Kankel,1993 Enhancer detector
simulation results (Figure 6). As the number of
func-analysis of the extent of genomic involvement in nervous system
tions affected by a mutation increases linearly, the time development in Drosophila melanogaster. J. Neurobiol. 24: 824–841. until overlap decays from one to a given value increases Doolittle, R. F.,1994 Convergent evolution: the need to be
ex-plicit. Trends Biochem. Sci. 19: 15–18.
exponentially (Figure 6c).
Ferris, S. D.,andG. S. Whitt,1976 Loss of duplicate gene
expres-Knock-out mutations—a severe kind of genetic per- sion after polyploidization. Nature 265: 258–260.
turbation—of many developmental genes in vertebrates Ferris, S. D.,andG. S. Whitt,1979 Evolution of the differential regulation of duplicate genes after polyploidization. J. Mol. Evol.
have weak phenotypic effects. This suggests that
signifi-12:267–317.
cant functional overlap has been maintained among the Force, A., M. Lynch, F. B. Pickett, A. Amores, Y. L. Yanet al., 1999 genes in question, many of which are the product of Preservation of duplicate genes by complementary, degenerative
mutations. Genetics 151: 1531–1545.
ancient gene duplications having occurred sometime
Frankham, R.,1995 Effective population size/adult population size
before the origin of tetrapodsⵑ400 million years ago ratios in wildlife: a review. Genet. Res. 66: 95–107.
(Wrayet al. 1996). Such preservation of functional over- Futuyma, D.,1998 Evolutionary Biology, Ed. 3. Sinauer, Sunderland, MA.
lap is not the “default” fate of duplicated genes, as
sev-Goldstein, L. S. B.,1993 Functional redundancy in mitotic force
eral recent studies on the rapid functional
diversifica-generation. J. Cell Biol. 120: 1–3.
tion of duplicated genes show (Cirera and Aguade Gonza´les-Gaita´n, E. M., M. Rothe, E. A. Wimmer, H. Taubertand H. Ja¨ckle,1994 Redundant functions of the genes knirps and
1998;Tsaur et al. 1998;Zhanget al. 1998). Thus, it is
knirps-related for the establishment of anterior Drosophila head
likely that some evolutionary force is responsible for
structures. Proc. Natl. Acad. Sci. USA 91: 8567–8571.
its preservation. Natural selection is likely to play an Goodson, H. V.,andJ. A. Spudich,1995 Identification and
molecu-lar characterization of a yeast myosin I. Cell Motil. Cytoskel. 30:
important role in this process, either actively
main-73–84.
taining overlap in large populations or passively
de-Hanks, M., W. Wurst, L. Anson-Cartwright, A. Auerbachand
laying its decay in small ones. Even if selection only A. L. Joyner,1995 Rescue of the En-1 mutant phenotype by
replacement of En-1 with En-2. Science 269: 679–682.
un-Hartl, D. L.,andA. G. Clark,1997 Principles of Population Genetics, of Drosophila: II. Divergence versus polymorphism. Mol. Biol. Evol. 15: 1040–1046.
Ed. 3. Sinauer, Sunderland, MA.
Venuti, J. M., L. Goldberg, T. Chakraborty, E. N. Olsonand Higashijima, S., T. Michiue, Y. EmoriandK. Saigo,1992 Subtype
W. H. Klein,1991 A myogenic factor from sea urchin embryos determination of Drosophila embryonic external sensory organs
capable of programming muscle differentiation in mammalian by redundant homeo box genes BarH1 and BarH2. Genes Dev.
cells. Proc. Natl. Acad. Sci. USA 88: 6219–6223.
6:1005–1018.
Wagner, A.,1999 Redundant gene functions and natural selection. Hoffmann, F. M.,1991 Drosophila abl and genetic redundancy in
J. Evol. Biol. 12: 1–16. signal transduction. Trends Genet. 7: 351–355.
Walsh, J. B.,1995 How often do duplicated genes evolve new func-Joyner, A. L., K. Herrup, B. A. Auerbach, C. A. DavisandJ. Rossant,
tions? Genetics 139: 421–428. 1991 Subtle cerebellar phenotype in mice homozygous for a
Watterson, G. A.,1983 On the time for gene silencing at duplicate targeted deletion of the en-2 homeobox. Science 251: 1239–1243.
loci. Genetics 105: 745–766. Kimura, M.,andJ. L. King,1979 Fixation of a deleterious allele at
Weintraub, H.,1993 The MyoD family and myogenesis: redun-one of two “duplicate” loci by mutation pressure and random
dancy, networks, and thresholds. Cell 75: 1241–1244. drift. Proc. Natl. Acad. Sci. USA 76: 2858–2861.
Wray, G. A., J. S. LevintonandL. H. Shapiro,1996 Molecular Kondrashov, A. S.,andJ. F. Crow, 1991 Haploidy or diploidy:
evidence for deep precambrian divergences among metazoan Which is better? Nature 351: 314–315.
phyla. Science 274: 568–573. Kosman, D., J. ReinitzandD. H. Sharp,1998 Automated assay of
Wright, S.,1968 Evolution and the Genetics of Populations. University gene expression at cellular resolution, in Pacific Symposium on
of Chicago Press, Chicago.
Biocomputing 1998, edited by R. B. Altman, K. Dunker, L.
Zhang, J., H. F. RosenbergandM. Nei,1998 Positive Darwinian HunterandT. E. Klein.World Scientific, Singapore.
selection after gene duplication in primate ribonuclease genes. Li, X.,andM. Noll,1994a Compatibility between enhancers and
Proc. Natl. Acad. Sci. USA 95: 3708–3713. promoters determines the transcriptional specificity of
goose-berry and goosegoose-berry neuro in the Drosophila embryo. EMBO Communicating editor:A. G. Clark
J. 13: 400–406.
Li, X., andM. Noll,1994b Evolution of distinct developmental functions of three Drosophila genes by acquisition of different cis-regulatory regions. Nature 367: 83–87.
APPENDIX: AN ORDER-OF-MAGNITUDE
Lundgren, K., N. Walworth, R. Booher, M. Dembski, M. Kirschner
et al., 1991 mik1 and wee1 cooperate in the inhibitory tyrosine ESTIMATION FOR THE CORRELATION OF
phosphorylation of cdc2. Cell 64: 1111–1112. FITNESS AND FUNCTIONAL OVERLAP
Maconochie, M., S. Nonchev, A. MorrisonandR. Krumlauf,1996
Paralogous Hox genes: function and regulation. Annu. Rev. One can derive from (6) a recurrence equation for
Genet. 30: 529–556. rtand solve for r at equilibrium by setting r
t⫽rt⫹1. This
Marshall, C. R., E. C. RaffandR. A. Raff,1994 Dollo’s law and
yields
the death and resurrection of genes. Proc. Natl. Acad. Sci. USA
91:12283–12287.
Maruyama, T.,andN. Takahata,1981 Numerical studies of the
r⫽(1⫺2)rw⫹2(rr
2w)⫹2
rw(rw⫺r2w) (1⫺2)w⫹2rw⫹2w(w⫺rw)
, (A1)
frequency trajectories in the process of fixation of null genes at duplicated loci. Heredity 46: 49–57.
Maynard Smith, J.,1978 The Evolution of Sex. Cambridge University
Press, New York. which can be rewritten as
Nadeau, J. H.,andD. Sankoff,1997 Comparable rates of gene loss and functional divergence after genome duplications early in
Cov(r,w)⫽ r w⫺r w
vertebrate evolution. Genetics 147: 1259–1266.
Nei, M.,andA. K. Roychoudhury,1973 Probability of fixation of
nonfunctional genes at duplicate loci. Am. Nat. 107: 362–372. ⫽ 2
1⫺ 2
关
rw r⫹ w(w⫺rw)⫺ rr2w
Ohno, S.,1970 Evolution by Gene Duplication. Springer, New York. Ohta, T.,1987 Simulating evolution by gene duplication. Genetics
115:207–213. ⫺ rw(rw⫺r2w
兴
. (A2)Otto, S. P.,andD. B. Goldstein,1992 Recombination and the evolution of diploidy. Genetics 131: 745–751.
Each of the terms in the square brackets on the
right-Padgett, R. W., J. M. WozneyandW. M. Gelbart,1993 Human
hand side is of order unity or less. (Note that 1 ⬎
BMP sequences can confer normal dorsal-ventral patterning in the Drosophila embryo. Proc. Natl. Acad. Sci. USA 90: 2905–2909. 兰1
0兰10riwjp(r,w)→0 as i, j → ∞.) It follows that the
co-Perrot, V., S. RicherdandM. Valero,1991 Transition from hap- variance of r and w in mutation-selection balance is of loidy to diploidy. Nature 351: 315–317.
order of the mutation rate, i.e., very small. By
calcu-Schena, M.,1996 Genome analysis with gene expression
microar-rays. Bioessays 18: 427–431. lating the equilibrium value of rk in the same way, it
Sharman, A. C.,andP. W. H. Holland, 1996 Conservation, duplica- can be shown that at mutation selection equilibrium tion, and divergence of developmental genes during chordate
Cov(rk, w)⫽ rkw⫺ rkw is of order for all k ⬎ 1. In
evolution. Neth. J. Zool. 46: 47–67.
other words, rk w⬇rk
w. Substituting this approximation
Tautz, D.,1992 Redundancies, development and the flow of
infor-mation. BioEssays 14: 263–266. into (A1), w andcancel out, and one easily obtains
Thaker, H. M.,andD. R. Kankel,1992 Mosaic analysis gives an estimate of the extent of genomic involvement in the
develop-r⬇rr 2 ⫹
rw(r⫺r2) r⫹ w(1 ⫺r)
. (A3)
ment of the visual system in Drosophila melanogaster. Genetics 131: 883–894.
Thomas, J. H.,1993 Thinking about genetic redundancy. Trends
This can be rewritten to yield Var(r) ⬎ rr2⫺r2 ⫽
Genet. 9: 395–398.
Ting, C. T., S. C. Tsaur, M. L. WuandC. I. Wu,1998 A rapidly w(1⫺ r)r/(1⫺ w).
evolving homeobox at the site of a hybrid sterility gene. Science Using (6) to establish an equation for the mean
fit-282:1501–1504.
ness w at equilibrium, one can show that the variance
Tsaur, S. C., C. T. Ting, and C. I. Wu, 1998 Positive selection
whereas the above form for Var(r) suggests that Var(r) is Var(w)⫽w2⫺w2⫽ 2
1⫺ [(1⫺ w)rw⫺
2
wrw2⫹ ww
of order unity. Taken together, this indicates that
⫺ 2
ww2 ⫹ 2
mw(r⫺1)].
(r,w)⫽ Cov(r,w)