SELFED PROGENY OF DOUBLED MONOPLOID MAIZE STOCKS1
G. F. SPRAGUEZ, W. A. RUSSELL3, and L. H. PENNY2 Received January 28, 1960
M O N O P L O I D S occur normally in maize with low frequency and may be identified in the seedling stage by means of an appropriate system of genetic markers (CHASE 1949). A small percentage of such monoploid plants may ex- hibit sectorial diploidization. When sectors include all or parts of the ear and tassel, some seeds are produced upon self-fertilization. Each plant arising from such a seed is presumed to be completely homozygous since it represents, in a double state, the chromosomal complement of a single gamete. Since the fre- quency of detectable mutations is, to a great degree, a function of the genetic uni- formity of the experimental material and of the techniques used, it was felt that doubled monoploid stocks would provide excellent material for a study of muta- tions affecting quantitative traits in maize.
Some of the changes observed in the present study were qualitative and, on the basis of limited data, appear to result from changes at a single locus. These were of limited interest, and no detailed data on them will be presented. The changes of primary interest were those whose effects led to significant changes in one or more of the several quantitative attributes studied. Since there are definite limi- tations in the types of analyses that may be used in a study of quantitative changes, the term “mutation” will be used in a broad sense, with no implication as to the exact nature of the change involved.
MATERIAL A N D METHODS
Monoploids were isolated from stocks representing diverse genetic origins ranging from long-time inbred lines to synthetics. Seeds resulting from the self- fertilization of the monoploid plants were used as source material for this study. Such seeds were planted the following season and the resulting plants self-polli- nated. The following year a progeny row was grown, representing each self- pollinated ear. Self-pollination was continued, and at harvest time two siblings were saved from each progeny row. This procedure was continued through SUC- cessive generations. No conscious selection was practiced in any generation, ex-
1 Contribution from the Iowa Agricultural and Home Economics Experiment Station, Ames,
Iowa, and the Crops Research Division, Agricultural Research Service, U . S. Department of Agriculture cooperating. Journal Paper No. 3745 of the Iowa Agricultural and Home Economics Experiment Station. Project 1140.
2 Principal Agronomist and Agronomist, Crops Research Division, Agricultural Research Service, U. S. Department of Agriculture, respectively.
856 G . F. SPRAGUE, et al.
cept for the one necessary restriction that each selfed ear saved have a minimum of 150 kernels. If a monoploid plant is designated as So, the diploid progeny re- sulting from self-pollination of such a plant as
s,,
etc., this study covered gen- erations froms.,
throughs,.
Seeds produced in each generation were dried, shelled, and placed in cold storage until needed.Qualitative changes in phenotype are directly observable. Quantitative changes are less readily recognized. All direct comparisons were made in replicated plant- ings to ensure that observed variation had some genetic basis. The material avail- able for study was assigned to experiments on the basis of
s,
origin. Each experi- ment, with two minor exceptions, consisted of progenies from the parental S2,the two S,, the four S,, and the eight S, ears tracing to a single S, plant. Using the remnant seed of these parental ears, each item was planted in replicated ten-plant progeny rows. The field design was a randomized block with ten replications. Eleven such progeny sets were grown, each as a separate experiment. Individual plant records were obtained for eight attributes in each experiment. I n addition, individual plant records for date of silking were taken in three of the 11 experi- ments.
Stands were good, but not entirely uniform. A mean was calculated for each plot to minimize unequal frequencies, and an analysis of variance was performed on the plot means. An analysis of means would be expected to indicate significant differences if a mutant form had become fixed in the homozygous condition. It also might be possible to obtain a significant difference in means from compari- sons between normal and segregating progenies if the mutant form represented a relatively large change. Significant differences were ignored unless they were consistent with the hierarchal structure of the experiment. With this restriction, only changes resulting in significant differences between parent and progeny o r between siblings within a given generation were considered as representing ge- netic changes.
Significant differences arising through chance would be expected to be distrib- uted at random among the 105 comparisons possible among the 15 entries com- prising a single experiment. Of such comparisons only 21 are consistent with the parent-progeny or between-sibling relationships imposed by the hierarcha1 structure. Therefore, the great majority of significant differences arising from chance should be inconsistent with the hierarchal structure. Actually the majority of the significant differences observed were consistent with genetic expectations indicating that chance differences could play no more than a minor role in the present study.
Changes for which segregation was still occurring would be expected to increase the “within plot” variances. Variances were calculated for each plot, and an analysis of variance of these variances was made. Environmental variability was
so great, however, that few of the analyses indicated significant differences. This approach was not pursued further, and thus, the only valid estimate of genetic change presented was that provided by the analysis of plot means.
of an F, generation and that had become homozygous for the phenotypic change. I n the majority of the experiments, this limited mutation frequency estimates to the gametes involved in the production of the parental SI, S,, two S, and four S,
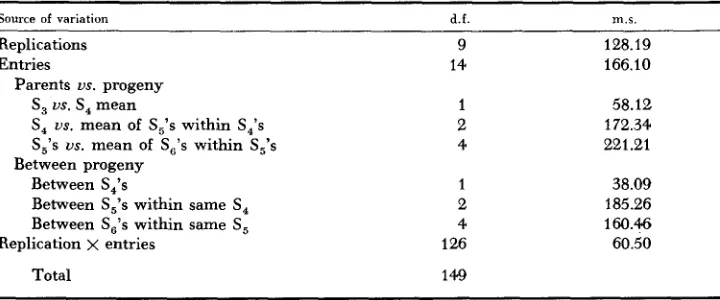
plants-or a total of 16 gametes. If the possibility of detecting a segregating progeny were accepted, the number of gametes tested per experiment would be increased to 32. An illustration of the form of the analysis of variance used is illustrated in Table 1. The variability associated with “entries” may be partitioned in a number of ways. Since the item of primary interest was the variation among progenies, the partition illustrated was chosen. The t test was used for estimating the significance of differences between the means using replication x entries as an estimate of a:.
E X P E R I M E N T A L RESULTS
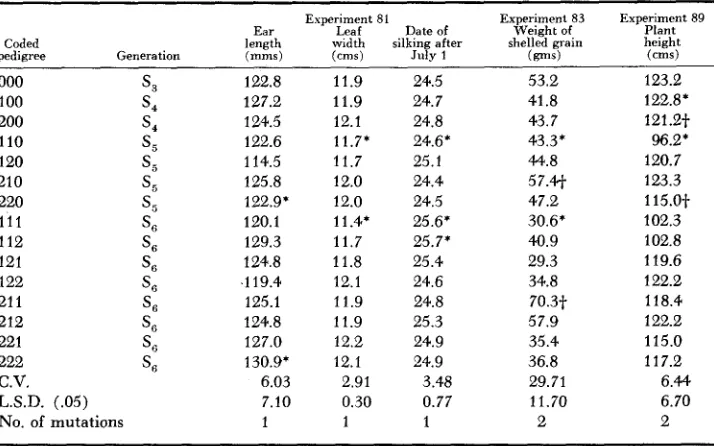
It appears unnecessary to present detailed records of entry means for each attribute in each experiment. Typical results are presented in Table 2. Signifi- cant differences inconsistent with the hierarchal structure were ignored. I n the data on ear length presented in Table 2, entry 120 had a mean ear length of 114.5 mm. This value differs significantly from entries 100 and 110. However, the sibling progenies of this ear grown as entries 121 and 122 were not signifi- cantly different from entries 000 or 100. Significant differences of this pattern might be attributed to the vagaries of sampling and were not counted as muta- tions. If it is assumed that a significant difference was conditioned either by several genes or by the effect of a heterozygote, then reversals of the type sug- gested by contrasts of entry 120 with its parent and progeny could have a logical explanation. Entry 222 differed significantly from its parent 220 and was con- sidered as representing one mutational change. This procedure introduces a pos- sible bias, since performance records were not available for S, progenies. It would appear, however, that this bias would not materially exceed five percent.
TABLE 1
An illustration of the form of analysis of wnriance used for each attribute in the several experiments. (Ear length mm, ezperiment 80)
Source of variation
~ d.f.
Replications Entries
Parents us. progeny S, us. S, mean
S , us. mean of S,’s within S,’s
S,’s us. mean of S,’s within S,’s Between progeny
Between S,’s
Between S,’s within same S, Between Se’s within same S ,
Replication x entries
9 14
1
2
4
1
2 4 1 26
m.s.
128.19 166.10
58.12 172.34 221.21
38.09 185.26 160.46 60.50
858 G . F. SPRAGUE, et al.
TABLE 2
Representative data indicating the type of parent-progeny differences that were interpreted as mutational changes
Coded
pedigree Generation
Experiment 81
Ear Leaf Date of
length width silking after ("s) (ems) July 1
000
s,
100 s4
200
s*
110 S S
120 s 5
210 s 5
220 S S
111 sli
112 SI5
121 S6
122 S6
21 1
s
fi212
s,
221 sli
222
s
fiC.V. L.S.D. (.05)
No. of mutations
122.8 127.2 124.5 122.6 114.5 125.8 122.9* 120.1 129.3 124.8 ,119.4 125.1 124.8 127.0 130.9' 6.03 7.10 1 11.9 11.9 12.1 11.7* 11.7 12.0 12.0 11.4, 11.7 11.8 12.1 11.9 11.9 12.2 12.1 2.91 0.30 1 24.5 24.7 24.8 24.6' 25.1 24.4 24.5 25.6' 25.7' 25.4 24.6 24.8 25.3 24.9 24.9 3.48 0.77 1
Experiment 83 Weight of
shelled grain
( P S I
53.2 41.8 43.7 43.3* 4.1.2 57.41 47.2 30.6' 40.9 29.3 34.8 70.3-f 57.9 35.4 36.8 29.71 11.70 2 Experiment 89 Plant height
(cms) . ,
123.2 122.8* 121.2-f 96.2* 120.7 123.3 115.0-t 102.3 102.8 119.6 122.2 118.4 122.2 115.0 11 7.2 6.44 6.70 2
*
+
Items marked by a common superscript represent significant parent-progeny differences each of which was inter- preted as a single mutation.TABLE 3
Total number of mutations per attribute for each of the 11 families (experiments)
Wt of Total ~ ... No. of No. of Wt. per shelled Date of ,
Expt. Plant Leaf tassel kernel Ear Ear 100 grain of expen- no. helaht width branches rows length diameter kernels Der plant silking ments
80 81 82 83 85 86 87 88 89 90 91 Total
1 1 1 0 1 1 0 2 7
2 1 1 2 2 I 2 1 1 13
1 1 2 0 1 0 0 1 2 8
2 2 0 0 1 1 1 2 9
1 1 2 0 1 0 1 0 6
1 0 0 1 2 0 0 0 4
1 2 1 0 0 0 0 1 5
0 1 0 0 2 0 0 0 3
2 2 3 3 2 2 4 2 2 22
1 0 1 1 0 1 0 0 4
2 2 2 1 2 0 0 0 9
14 13 13 8 14 6 8 9 5 9 0
gametes if segregating progenies are assumed to produce a recognizable effect). Experiments 85 and 89 were exceptions to this rule. Experiment 85 involved five and experiment 89 involved 11 tested plants. An average for all experiments indicates a mutation rate of approximately six mutations detected per attribute per 100 gametes tested.
With quantitative traits, it is conceivable that one mutation might affect more than a single attribute. This possibility was explored by comparing the time of
detection and the subsequent distribution pattern of all possible pairs of presumed mutations. When this was done, the number of independent mutations was reduced by approximately 25 percent. The correspondence of distribution does not constitute proof of pleiotropism, but it appears desirable to accept the more conservative figure of 4.5 mutations per attribute per IO0 gametes tested.
If a mutation rate, U, is assumed, then the probability that a haploid having
sectors of diploid tissue in the male and female inflorescence or a homozygous diploid will give rise to heterozygous progeny through mutation at a single locus is equal to 2u. Since all progenies were perpetuated by self-fertilization, any heterozygosity arising by mutation would be halved in each succeeding genera- tion. Since new mutations could arise in each generation, the total heterozygosity at any generation could be expressed as 2u ( 1
+
%
+
%
+
%
+
- -
-) = 4u,as shown by
HALDANE
(1936). The frequency of heterozygous plants could not be determined accurately in these experiments; thus, this method could not be used for estimating the mutation rate. The only estimates of mutation rates that could be obtained were those based upon the number of significant changes pre- sented in Table 3.The estimated value, 4.5 per attribute per IO0 gametes, cannot be interpreted in terms of mutations per locus without a considerable number of simplifying assumptions. The necessary assumptions appear to be so unrealistic that calcu- lated values have little significance. They do, however, suggest either that the mutation rate is substantially greater than the commonly accepted figure, I 0-5,
or that the number of loci is substantially greater than previous estimates of 5000 (CROW 1948).
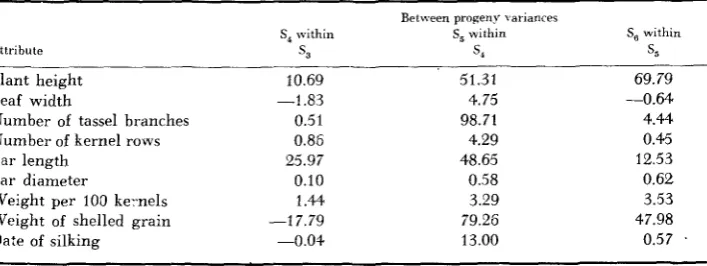
Additional evidence supporting mutation as the mechanism causing increased genetic variability can be obtained from the analysis of variance, particularly the three “within generation” estimates. If the significant differences among siblings or between parent and progeny were solely the result of some form of
structural hybridity arising in the haploid parent, the between-progeny variances with self-fertilization would be expected to decrease in subsequent generations according to the series
%,
N, ‘/8
-
- -.
Data bearing on this point are presented in Table 4. The values presented are estimates of genetic variance averaged over the 11 experiments. The variance estimates for the individual experiments were obtained from the relationship U,’ = U; -4,
where U,’ is the genetic variance, U; is the mean square variance for the appropriate “between-progeny” com-860 G . F. SPRAGUE, et al.
TABLE 4
Average estimates of genetic variance for the three “between progeny” partitions for each attribute studied
Attribute
S, within
s,
Between progeny \ ariances S, within
s 4
Plant height Leaf width
Number of tassel branches Number of kernel rows Ear length
Ear diameter
Weight per 100 ke-nels Weight of shelled grain Date of silking
10.69 -1.83
0.51 0.86 25.97 0.10 1.44 -17.79
-0.04
51.31 4.75 98.71 4.29 48.65 0.58 3.29 79.26 13.00
Se within
s,
69.79 -0.64
4.44 0.45 12.53
0.62 3.53 47.98
0.57 .
~-
important factor and suggests that the process inducing variation must be a con- tinuing one.
The very considerable variation among the estimates for the “between-prog- eny” components is a result of the small number of degrees of freedom. Thus, the mean square for each of the subdivisions is poorly estimated and would have a large associated standard error. Disregarding the algebraic magnitude, the fre- quency with which the difference between a particular “between” mean square was less than the error estimate suggests a definite trend. The percentages of negative estimates for between S,, S,’s within S,, and SG’s within S j were 59.0,
37.41, and 23.1, respectively. A more detailed statistical treatment of the available data appears unwarranted. The analysis used indicates that genetic variability increases with continued self-fertilization. More precise estimates of genetic variability must come from a different experimental approach. Seed preparation for such studies is currently underway.
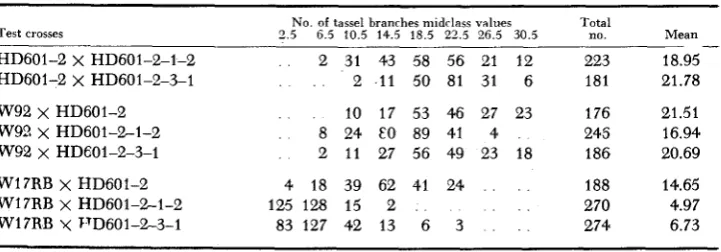
Evidence for genetic change also is provided by crosses of S, lines within a family to their S, parent and by crosses of S, and S, lines to unrelated tester inbreds. The pertinent data for one such series of comparisons involving the attribute, number of tassel branches, are presented in Table 5. The F, distribu- tions from crosses involving the S, lines HD601-2-1-2 or HD601-2-3-1 with their S, parent, H D 601-2, were significantly different, indicating that the two distributions could not be considered as random samples drawn from a single homogeneous population. When each of these three lines was crossed to either W92 or W17RB as a common tester parent, x 2 was highly significant for each set of F, distributions.
TABLE 5
F , distributions for a number oj tassel branches in test crosses comparing related
S , and S , lines from a single family
No. of tassel branrhes midclass values Test crosses 2.5 6.5 10.5 14.5 18.5 22.5 26.5 30.5
Total no.
HD601-2 X HD601-2-1-2 HD601-2 X HD601-2-3-1 W92 x HD601-2
W92 x HD601-2-3-1 Wl7RB x HD601-2 W17RB y VD601-%3-1 W92 X HD601-2-1-2
Wl7RB X HD601-2-1-2
2 31 43 58 56 21 12 2 11 50 81 31 6 10 17 53 46 27 23 8 24 EO 89 41 4 2 11 27 56 49 23 18 4 18 39 62 41 24
83 127 42 13 6 3 125 128 15 2
223 181 176 245 186 188 270 274
Mean
_ -
18.95 21.78 21.51 16.94 20.69 14.65 4.97 6.73H D 601-2-3-1 were shown to be genetically unlike. In one of two comparisons, H D 601-2-3-1 was indicated as genetically distinct from H D 601-2. The differ- ences between 2-1-2 and 2-3-1 and between these and the parent form HD 601-2
must have been of recent origin. Some type of mutation appears to provide the best explanation for these observed differences. Dissimilar genotypes and modi- fier backgrounds may account for the differences observed between the two sets of crosses involving unrelated tester material.
Combining ability: The original S, line and one or more of its divergent S,
generation derivatives were crossed to two long-time inbred lines, WF9 and B14,
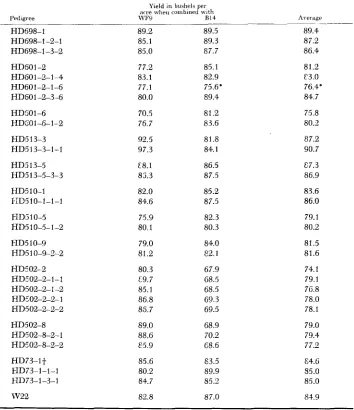
and the test crosses evaluated in replicated yield trials. The material comprising each family was grown as a separate experiment with each entry replicated ten times. Standard field plot techniques were used. The data are presented in Table 6.
A
significant difference between S, parent and S, progeny was observed in two of the 38 contrasts. In these instances, the lower yield was associated with earlier maturity. The proportion of significant differences observed was n o greater than might be expected on the basis of sampling. If more than a single genetic change would be required to modify yield performance at the hybrid level, the time period involved was too short to expect significant differences even though a high mutation rate might be involved. Furthermore, the only mutations that could be expressed in the test crosses would be those having some degree of dominance.DISCUSSION
Attempts to obtain a n estimate of mutation rate for loci conditioning quantita- tive traits involve a number of unwieldly problems. First, the methodology is.
862 G. F. SPRAGUE, et al.
TABLE 6
Yield in bushels per acre for test crosses comparing original S , lines and one or more of their S, generation derivatives
Pedigree HD698-1 HD698-1-2-1 HD698-1-3-2 HD601-2 HD601-2-1-4 HD60 1-2-1 -6 HD601-2-3-6
HD SO 1-6 HDS01-6-1-2 HD513-3 HD513-3-1-1 HD5 13-5 HD5 13-5-3-3 HD510-1 I-ID5 10-1-1-1 HD3 10-5 HD510-5-1-2 HD5 10-9 HD510-9-2-2 HDc'02-2 HDc'O2-2-1- 1 HD502-2-1-2 HD5 02-2-2- 1 HD502-%2-2 HD502-8 HD502-8-2-1 HD502-8-2-2 HD73-lt RD73-1-1-1 E-ID73-1-3-1
w 2 2
Yield in bushels per acre rvheii combined with
WF9 R I 4 Average
~~~ 89.2 85.1 85.0 77.2 83.1 77.1 80.0 70.5 76.7 92.5 97.3 E8.1 85.3 82.0 84.6 75.9 80.1 79.0 81.2 80.3 c9.7 85.1 86.8 85.7 89.0 88.6 E5.9 85.6 80.2 84.7 80.8 89.5 89.3 87.7 85.1 82.9 75.6' 89.4 81.2 83.6 81.8 84.1 86.5 87.5 85.2 87.5 82.3 80.3 84.0 82.1 67.9 68.5 68.5 69.3 69.5 68.9 70.2 68.6 83.5 89.9 85.9 87.0 89.4 87.2 86.4 81.2 C3.0 76.4' 84.7 75.8 80.2 87.2 90.7 87.3 86.9 83.6 86.0 79.1 80.2 81.5 81.6 74.1 79.1 76.8 78.0 78.1 79.0 79.4 77.2 €4.6 85.0 85.0 81.9
-
Yield d.fference significant a t the 5 percent level+
111173 was derived from the inbred line ll:\:LL.of the s'gnificant genetic changes obtained in the present study is sufficiently great to warrant some speculation as to a possible cause.
(1932). Pachytene preparations of monoploid plants exhibit varying degrees of apparent chromosome doubleness. This doubleness may arise from foldback areas within chromosomes or non-homologous association between chromosomes.
If such non-homologous pairing gives rise to genetic crossing over, then the result- ing gametes might possess structural dissimilarities. Zygotes derived from such gametes might be heterozygous for various types of chromosomal aberrations which could give rise to duplication-deficiency phenomenon in any progeny resulting.
However, the seeds used to initiate the present study had their origin in diploid sectors on the ear. Also functional pollen is shed from only diploid sectors of the tassel. Since d;ploid maternal tissue is involved in both cases, it is presumed that meiosis would be normal and that non-homologous pairing would be of little or no importance. While the material used in this study was not subjected to cyto- logical analysis, there are additional reasons to feel that chromosomal aberrations could have played only a minor role in the observed changes. Reciprocal translo- cations would lead to semisterility, which was not observed. Duplications would lead to severe gametic competition and would rapidly be eliminated. All of the chromosomal deficiencies known in maize are lethal in the homozygous condition and most are haplo-lethal in the male gametophyte. Inversions, depending upon
the size of the inverted segment, would lead to some reduction in fertility. Again, such types were not observed, but they could have been overlooked. The selection of seed ears that possessed a minimum of 150 kernels, as mentioned earlier, would impose some restriction against plants carrying a major chromosome aberration. Furthermore, the evidence presented in Table 4 indicates that the process involved is continuing and not limited to the monoploid phase. The testcross data in Table 6 provided no evidence for sterility and would appear to rule out any possibility of involvement of either homozygous inversions or translocations.
Several mutable gene systems have been reported for maize. For the most part these appear to be rather specific in their effects and to affect only a limited number of attributes. If a mutable gene system were postulated to account for the present results, it would have to have an effect on a number of different quantitative attributes; and each of the monoploids involved in this study must have carried such a system. This appears quite unlikely unless one further assumes that, in some manner, the monoploid condition is either directly or indirectly responsible for the origin or is the result of the mutable system. Any resulting instability would need to have its origin in something other than major chromatin rearrangements for the reasons just outlined. Furthermore, if such an explanation were valid, one would have to assume either that a large number of
such changes was involved in each monoploid parent or that any of a large number of loci could have a n important influence on each of the attributes studied. The possibility that monoploidy may play some role in the origin of mutable systems is conceivable. The possibility that genetic instability may be wide- spread throughout the maize genome has been established by MCCLINTOCK
864 G . F. SPRAGUE, et al.
that if mutable systems are involved in the present study, they must represent a special class, since the increase in frequency appears to have been restricted to quantitative traits leaving qualitative effects not markedly in excess of normal expectation. This argument has definite limitations, since the parental material used in the production of monoploids carried relatively few genes that would have been satisfactory as markers. Furthermore, nothing is known as to the number of loci where mutational changes could produce an effect on a quantita- tive trait such as plant height. If a sufficiently large number of loci were assumed, then the apparent discrepancy between frequencies of changes affecting quantita- tive and qualitative traits might disappear.
The possible role of monoploidy as a causal factor in the origin of mutable systems can be evaluated only when comparable studies have been conducted with long-time inbred material. Seed preparation for such a study has been finished, but the field comparisons remain to be completed.
The estimates of frequency of genetic change provided by this study are sub- ject to several types of bias, The restriction that any ear saved to propagate a line must have a minimum of 150 kernels would ensure the elimination of all lethals and sublethals. It would also reduce the estimates of frequency of occur- rence for changes having a markedly depressing effect on yield level. The pro- cedures used in the identification of genetic changes would preclude the detection of anything except major changes. For example, the data provide a strong sug- gestion of small stepwise changes that were not significant in any direct parent- progeny comparison but that were highly significant when
s,
us.s,
comparisons were made. Changes of this sort were ignored in the mutation frequency tabu- lations. Presumably, also, other changes that failed to achieve significance in the present study may represent real alterations and would have been judged signifi- cant had a larger number of replications been used.In several instances, significant differences were observed between parent and progeny that were not retained in subsequent generations. These could be con- sidered as chance deviations, segregation, or some form of reverse mutation. If
the mutation rate is as high as the present data sugqest, the possibility of reverse mutations or additional changes whose effects simulate reverse mutations cannot be ignored. However, in the present case significant differences of this sort were excluded from the tabulation. Other mutations may have gone undetected be- cause of failure to become established in a homozygous condition.
Significant differences between parent and progeny, subject to the restrictions just outlined, were interpreted as representing a changed condition at a single locus. This would appear to be the simplest interpretation possible. However, there remains a possibility that the observed changes represent the culmination
of a series of changes each having a smaller and nonsignificant effect. If this were true, each significant change might result from the multigenic alteration rather than a single locus effect. Each of these possibilities would lead to an underesti- mation of the true mutation frequency.
in one line of descent a difference in plant height might be apparent in one of two S, progenies. The other S, progeny could be heterozygous for the same muta- tion, and this change might be established as a distinct type in either the S, or S,
generation. This may have been a factor in the present study. An attempt has been made, however, to minimize this possible bias by disregarding changes in different lines of descent which led to similar mean values. Thus two or more significant parent-progeny differences in S, or S, characterized by similar means were recorded as representing only a single mutation. Any duplications remaining would, of course, lead to an overestimation of the mutation frequency. It is the opinion of the authors that any net bias is in the direction of underestimation rather than overestimation.
If the mutation rate of normal inbred lines of corn is as high as these studies suggest, one might question how stability of appearance and performance could be maintained, It is a well-established fact that changes in phenotype do occur, since long-time inbred lines, when exchanged and maintained by different workers over a period of time and under different environments, become notice- ably distinct. The degree of stability achieved is probably a direct result of the continuing selection practiced. In propagation of an inbred line, recognizable deviants would be avoided at pollination time unless they appeared to be of superior type. A second selection for typical plants would occur at harvest time. Thus, any mutations causing recognizable deviations from type would tend to be rapidly eliminated.
S U M M A R Y
Doubled maize monoploids would be expected to be completely homozygous since they arise from a single monoploid gamete. A detailed study was made of a series of doubled monoploids involving their S, through S, progenies. Significant differences between means were observed for each of the quantitative traits measured. Such significant differences were interpreted as resulting from some type of mutational change. The rate observed was 4.5 mutations per attribute per 100 gametes tested. The various factors that might influence the reliability of the observed mutation rate are discussed.
L I T E R A T U R E CITED
BRINK, R. A., and R. A. NILAN, 1952 CHASE, SHERRET S., 1949
CROW, J. F., 194.8 FORD, L. E., 1952 HALDANE, J. B. S., 1936
The relation between light variegated and medium varie-
Monoploid frequencies in a commercial double cross hybrid maize, gated pericarp in maize. Genetics 37: 519-544
and in its component single cross hybrids and inbred lines. Genetics 34: 328-332. Alternative hypotheses of hybrid vigor. Genetics 33: 477-487.
Some cytogenetic aspects of maize monoploids and monoploid derivatives.
The amount of heterozygosis to be expected in an approximately pure Ph.D. Thesis. Iowa State College. Ames, Iowa.
866 G . F. SPRAGUE, et al.
MCCLINTOCK, BARBARA, 1933 The association of non-homologous parts of chromosomes in the The origin and behavior of mutable loci in maize. Proc. Natl. Acad. Sci. U. S. 36:
Chromosome organization and genic expression. Cold Spring Harbor Symposia Quant.
Induction of instability at selected loci in maize. Genetics 38: 579-599.
mid-prophase of meiosis in Zea mays. Z. Zellforsch. U Mikroskop. Anat. 19: 192-237. 344-355.
Biol. 16: 13-47. 1950
195 1
1953