Copyright 0 1988 by the Genetics Society of America
The Estimation of Parental Genotypes by the Analysis
of a
Fixed
Number
of
Their Offspring
A.
Barbadilla and H. Naveira’
Departamento de G d t i c a y Microbiologia, Facultad de Ciencias, Uniuersidad A u t 6 n m de Barcelona, BeUaterra (Barcelona), Spain
Manuscript received June 30, 1987 Revised copy accepted February 24, 1988
ABSTRACT
When genotypes are cryptic in adult organisms but visible in young life-stages, it is possible to estimate the genotypes in parents after the examination of a fixed number of their offspring. Thus, in Drosophila, males collected in the wild can be crossed to females of a homozygous laboratory
stock, and the identification for genotype of seven larvae is largely enough to guarantee a correct diagnosis of the two alleles of the father (P = 0.984). On the other hand, when collected females were inseminated in nature, it should be possible to determine the constitution both the female and her mate, after the analysis of a sufficient number of their offspring. Nevertheless, exact formulas for the probabilities of correct diagnoses of parental genotypes in this case have not yet been published. In this paper we derive such formulas, and illustrate their application. The conclusion
we draw from our calculations is that, unless 13 larvae are examined among the offspring, the probability of misdiagnosis is over the 0.05 level. Of course, the errors produced become greater as smaller offspring numbers are analyzed. But in the case of one locus with two alleles, we have derived formulas to correct the observed number of matings and estimate its actual number in the sample, for any offspring sample size. After these corrections, we have been able to calculate estimates of relative mating frequencies in the sampled population, together with their associated errors, which can be subsequently used in studies of adult fitness components, mainly in those dealing with sexual selection:
G
ENOTYPES are not always accessible to direct examination in all the stages of the life cycle of an organism. In Drosophila, for example, chromo- somal polymorphism is observable only in third instar larvae, But there are many other examples of missing parental data in other organisms, usually when deal- ing with allozyme loci (see, for example, LUYKX 1981; SAMOLLOW, DAWSON and RIDDLE, 1983). Therefore, when we are interested in gene or genotype frequen- cies of the adult population, a serious problem of estimation arises. That is the case of studies on adult fitness components, like longevity (RUIZ et al. 1986), or sexual selection (ANDERSON and MCGUIRE 1978). The general procedure to overcome the difficulty of cryptic genotypes in adults has consisted of collecting a sample of them, usually males, and mating them in the laboratory with flies of known homozygous genotype (DOBZHANSKY 1944; ANDERSON et al. 1975;RUIZ el al. 1986). The inference rests on the genotypes
observed in the family of each collected male. Thus, about seven larvae should be observed in order to determine the two gene arrangements of the wild male (DOBZHANSKY 1944). ARNOLD (1981) has inves- tigated the properties of two different estimators of
Present address: Department of Genetics, Biological Sciences Building, University of Georgia, Athens, Georgia 30602.
Genetics 119 465-472 (June, 1988).
allele probability in adults after this protocol. Later on, ARNOLD and MORRISON (1985) described a model for another experimental protocol, which consisted of collecting N singly inseminated mothers, from each of whom n offspring were identified for geno- type. Their model, which assumed the Hardy-Wein- berg law, Mendelian laws, and a singly randomly chosen mate per female, provided several estimators of gene frequency in the cryptic parental gene pool.
Therefore, estimating gene frequencies in the adult mating population from family profiles is at present no problem for population geneticists (SOBEL, AR-
NOLD and SOBEL 1986). As a matter of fact, by simply
examining the chromosomes of a single larva among the offspring of each inseminated female collected in nature, two gene arrangements, one of maternal and one of paternal origin, can be determined (AN-
DERSON et al. 1975; DOBZHANSKY 1958; FONTDEVILA
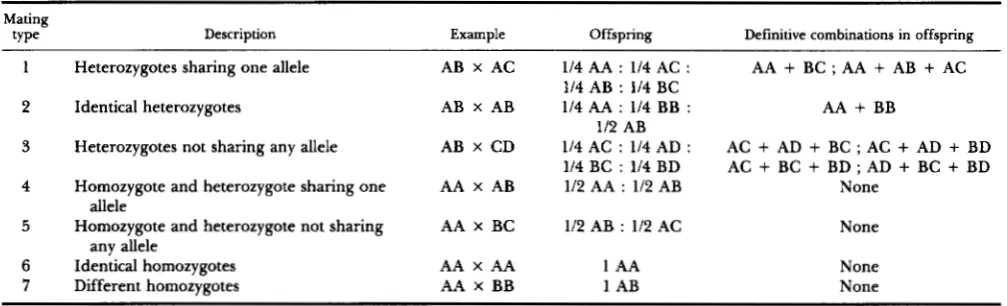
Different kinds of matings between genotypes for one locus with four alleles
Mating
fY Pe Description Example Offspring Definitive combinations in offspring
1 Heterozygotes sharing one allele AB x AC 114 AA : 114 AC : AA
+
BC ; AA i AB+
AC2 Identical heterozygotes AB X AB 114 AA : 114 BB : AA i BB
3 Heterozygotes not sharing any allele AB X CD 114 AC : 114 AD : AC
+
AD+
BC ; AC+
AD+
BD 1 / 4 B C : 1 1 4 B D A C + B C + B D ; A D + B C + B D4 Homozygote and heterozygote sharing one AA x AB 112 AA : 112 AB None
5 Homozygote and heterozygote not sharing AA X BC 112 AB : 112 AC None
6 Identical homozygotes AA X AA 1 AA None
7 Different homozygotes AA X BB 1 AB None
114 AB : 114 BC
112 AB
allele
any allele
ity of misdiagnosing the genotypes of the mating couple, they claim that the probability of such event is extremely small, of the order of 0.005 (but they do not show the calculations they performed to arrive at that conclusion). In this paper we show that both ANDERSON and MCGUIRE’S and, of course, DOBZHAN- SKY’S offspring sample sizes are too small to avoid a considerable amount of misidentifications of mating genotypes.
With regard to ARNOLD and MORRISON (1985), we remove the assumption of the Hardy-Weinberg law, thus giving entry to possible deviations from random mating and to sexual selection among adults, but we keep the other two restrictions: we assume no gametic drive and we assume singly inseminated females. Our aim is to estimate adult mating frequencies in a wild population by collecting a sample of N inseminated females and analyzing in the laboratory the genotypes of a fixed number of their offspring. The table of matings thus obtained, although it is not possible to determine which karotype is male and which is fe- male, can be tested for agreement to random mating expectations (under the assumption of equal geno- type frequencies for both sexes). In addition, if an independent sample of collected adults is identified for genotype, sexual selection can be assessed.
RESULTS
Minimum number of larvae per female: Let us consider a locus with four alleles in a diploid species (four is the maximum number of different genomes implicated in a single mating), for example, a Dro- sophila population polymorphic for four inversions on a given chromosome (A, B, C and D). Wild inseminated females are taken to the laboratory and transferred to individual vials with standard Droso- phila medium. When offspring larvae reach their third instar, a sample of n of them is dissected and
the polytene chromosomes of their salivary glands are analyzed. This sample is used to infer the geno- types of the parents. The problem is to determine how many larvae should be analyzed in order to be at least 95% sure of having correctly identified the parental genotypes. Table 1 shows the different types of matings we should expect. Two broad classes can be distinguished: those where the simple presence of certain offspring genotypes (“definitive combination” of genotypes) is enough to determine unequivocally the parental genotypes (mating types 1, 2, and 3),
and those whose offspring do not offer any genotype marker of parentage (mating types 4, 5, 6, and
7),
the only information on parentage being obtained from family profiles, that is, the ratio of progeny genotypes.The offspring of each collected female are ascribed to a given mating type according to the procedure indicated in Table 2 (first and second columns). This procedure is a simple extension to four alleles of the “Dobzhansky scoring” procedure, cited by ARNOLD
and MORRISON (1985).
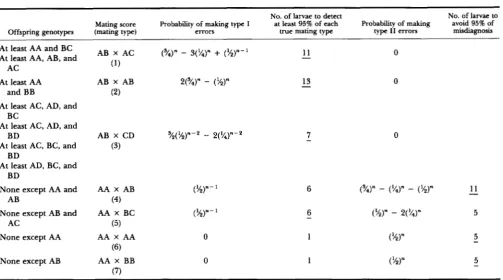
Table 2 is organized so that the two types of mistakes we must confront can be made apparent. First, errors of type I consist of rejecting the null hypothesis when it is indeed true. In our case, that means rejecting, according to the offspring geno- types, a given mating when it did actually happen. The conditional probabilities of these errors, for each mating type, are given in the third column of Table 2 as a function of the number of larvae analyzed per collected mother.
Estimation of Mating Genotypes 467 TABLE 2
summary
of resultsNo. of larvae to detect
Mating score Probability of making type I at least 95% of each Probability of making avoid 95% of Offspring genotypes (mating type) errors true matlng type type I1 errors misdiagnosis
No. of larvae to
At least AA and BC At least AA, AB, and
AC
At least AA and BB
At least AC, AD, and
At least AC, AD, and
At least AC, BC, and
At least AD, BC, and BC
BD
BD
BD
None except AA and AB
None except AB and AC
None except AA
None except AB
AB X CD ?$(%)"*
-
2('/4)"-*(3)
AA X AB (%)"
(4)
( 5 )
(6)
(7)
AA X BC (%)"
AA X AA 0
AA X BB 0
-
11 013
-
07 0
-
~
Underlined numbers correspond to limiting offspring sample sizes.
only when there are no genotypic markers of par- entage, as happens with mating types 4, 5 , 6 and
7.
Taking both kinds of error into consideration, lim- iting offspring sample sizes can be calculated for each mating type (fourth and sixth columns, Table2,
underlined numbers).
We explain mating type 1 and type 4 in detail, and then simply refer to Table 2 for the other mating types.
Mating type 1 includes all the matings between heterozygotes (heterokaryotypes) sharing one allele (inversion), as for example AB X AC. Although four different genotypes should appear in their progeny, each with expected frequency 1 in 4 (Table l ) , it is not necessary to find them all in a sample of third instar larvae in order to determine the correct pa- rental genotypes. There are two "definitive combi- nations'' in the offspring (Table 1): AA
+
BC, andAA
+
AB+
AC. Either of these can be produced only by mating AB X AC; there is no other possibility. Therefore, our problem reduces to that of calculating how many larvae should be examined in order to be 95% sure of finding any of the two definitive com- binations given that this mating had actually taken place.This calculation is most easily performed by tree diagram analysis. Given a sample of n larvae, the probability of combination AA
+
BC (that is, theprobability of finding at least one individual of each of these genotypes in the sample) is
P(AA
+
BC) = 1-
[2(5/)"+
(%)"I
(1)Similarly, for the other definitive combination (AA
+
AB+
AC), P(AA+
AB+
AC)= 1
-
[
x
( L ) " - Z - * ] ;( 2 )
k = n - 2k = O
where
~ n - 2 - k = 3
/ * [ 3 ( 9 / ) " - 2 - k
-
( % ) " - 2 - k ] ,for (n
-
2
-
k) E
NO andI o = 1.
The joint probability of the two definitive combina- tions is
P[(AA
+
BC) U (AA+
AB+
AC)]sponds to the probability of making type I errors, which is given in the third column of Table 2. Also in Table 2, but in the fourth column, it is shown that at least 11 larvae should be examined from each female in order to detect 95% of all these matings. On the other hand, there is no possibility of making type I1 errors, insofar as definitive combinations in the offspring lead to unambiguous determination of parental genotypes.
Mating type
4,
as for example AA X AB, corre- sponds to matings between a homozygote for one allele and a heterozygote for the same allele. These same two genotypes are expected in the offspring sample, each with the same relative frequency (Table 1). Finding these two genotypes in the offspring sample is highly probable, even for relatively small sample sizes ( P = 1-
(%)""; for n = 6, P = 0.969), but this is not enough to exclude other possible parental genotypes. Table 1 shows that genotypes AA+
AB are also expected after two other matings. Thus, we might have missed BB in the n offspring sample after mating AB X AB (mating type 2), or both AC and BC after mating AB X AC (mating type 1). The probability of the first mistake is(x)"
-
(?Qn-
(%)", whereas that of the second is only (%)" - 2(54)", that is, approximately (1.5)" times smaller than the former. Mating type4
can be confused much more easily with mating type2
than with mating type 1. Table 2 shows that only after having examined 11 larvae can we feel reasonably confident ( P = 0.96) of having excluded the possi- bility of this most important mistake.In a similar way, limiting offspring sample sizes can be found for the other mating types. As shown in Table 2, the most disadvantageous situation, in terms of experimental effort, is the mating between two identical heterozygotes: at least 13 larvae should be analyzed in order to detect 95% of actual matings of this type, which, on the other hand, is free of type I errors, because it is always unequivocally identified. Thirteen larvae is, therefore, as a first approximation, the limiting offspring sample size in any experiment where parental genotypes are to be inferred from offspring genotypes. Observed mating frequencies in the sample can then be used directly to estimate relative mating frequencies in the population.
Estimation of mating frequencies for a locus with two alleles: The results just described are equally applicable to loci with more than four alleles, insofar as no novel mating type would be added to the niodel. When only two alleles ( A and a ) for the locus in question exist in the population, the limiting mating type (Aa X A a ) can be more frequent than ever. However, in this case it is not necessary to analyze 13 larvae per female to get rather good estimates of mating frequencies. The importance of the different sources of error in the assignation of parental ge- notypes to each family in this case is easy to quantify
as a function of the number of larvae analyzed per female. Corrections can be performed to calculate estimated mating frequencies from the observed fre- quencies in the sample.
We refer now more closely to the model of ARNOLD
and MORRISON (1985). We have two alleles,
A
anda.
A collected mother carries y copies of the
a
allele. The county must be 0, 1, or2,
and it can be identified with the cryptic genotype of the collected female. We assume that each mother mates with only one father in nature. The parental genotypes are denoted by yo and yl. These parental genotypes p = (yo, y l ) are cryptic to the collector, and it is not possible to distinguish which is the father and which is the mother.For a given mother, examination of n of her offspring yields a profile = (no, nl
,
n2) where (i)n offspring are homozygous for the
a
allele; (ii) n are heterozygous; (iii) n are homozygous for theA
allele. The family profiles A =b:
no 2 0, nl 2 0, n2 2 0,no
+
nl+
n2 = n } are defined in a sample spaceA.
Given a family profile E, it is possible to select parental genotypes p so that the conditional density p r o b bI
p)is maximum. When the mother mates only once and the Mendelian laws of inheritance are valid, the procedure to maximize p r o b b
1
y) is called the "Dob- zhansky scoring procedure," and the score equals yoX y l . This procedure is shown in Table 3.
Six mutually exclusive events Aoo,
. . .
,
A l l are singled out for special consideration (Table 3). In this table, g o o ,.
.
. ,
e l l
are the probabilities of the different kinds of mating in the wild population; a1= 2(%)"
-
(%)"; a2 = (52)""; and a3 =(x)"
-
( ?4)"
-
(%)", where aiare the probabilities of making wrong determinations. The events AOO,. . .
,
A11constitute a partition of the different possible family profiles n in the sample space A. This partition identifies family profiles by the presence or absence of one or more genotypes in a family. The probabil- ities Koo,
. . .
,
K1 1, of each of these six events can be computed from the model specificationprob(g
I
900,.
.
. ,
9 1 1 )= probh
I
y)
prob(41I
900,. . .
,
ell),and are shown in the second column of Table 3. In a collection of N mothers, the numbers NOO,
. . .
, N11 count types of family profiles based on the presence or absence of one or more genotypes. The probability density ofN
= (Noo,.
. .
,
N11) is multinomial, and is given byprobm 1000,
. . .
, 9 1 1 )=
(g)
Kg$' Kg?' K?d2 KT]'Estimation of Mating Genotypes
TABLE 3
Score statistic
(E)
and the DOBWUNSKY score for collected mothers, in the case of one locus with two alleles469
Event F'robability Count ( N ) Score Example
Am = {E: no = n} K~ =
em
+
ell(x)n
+
N m 0 X 0 AA X AA A02 = {E: nl = n) K~~ =eo2
+(el1
+
eol
+
No2 0 X 2 AA Xe O 1 w
e12)(w
e 1 2 w
A22 = {n: 122 = n} K~~ =
ez2
+el1(w
+
N z z 2 X 2 aa X aaA01 = {n: no
+
nl = n, no > 0, nl > 0) K~~ = e o l ( l-
a 2 )+
8 1 1 a 3 No 1 0 x 1 A A x A aA12 = {G: n l
+
nz = n, nl > 0, n2 > 0 ) K~~ =e12u
- a 2 ) +e11a3
N1z 1 x 2 A a x a a A l l ={i:
no+
nl+
nz = n, no > 0, nl > 0, nz > 0) K11 = e l d l - al) NI 1 1 X 1 A a x Aa-
-
Ow, OO1,
eOzr
8 1 1 , elz, 8 2 2 : probabilities of different matings. For one locus and two alleles, 2 = homozygote for one allele, 0 =homozygote for the other allele, 1 = heterozygote. a1 = 2(9/4)"
-
(%)"; az = (%)n-';
a3 = (%)"-
-
(%)n.0
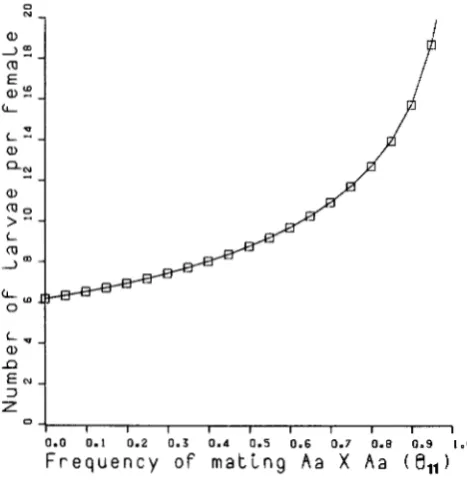
N For a given experimental effort, K ( K = N n; N
a, = number of collected females; n = number of
(0 larvae analyzed per female), it is possible to find the
(L is, the values n and N = K / n which produce a
L - minimum variance of the estimator of a given mating
a, probability. These values always depend on the cor-
-
responding parameter. For example, as is shown in(D Figure 1, the values of n and K / n which lead to a
3.2
E
a
,
:
optimum distribution of effort between N and n , thate
QN a,
> E minimum variance of the estimator of the probability
L (0
L r n
of matings between two heterozygotes (Var(B1 1 ) ) ,
depend on 8 1 1 , the corresponding parameter. As it
is shown there, when 8 1 1 is high, the best strategy is
to collect fewer females and analyze more larvae from
%
a, each female. Similar figures can be obtained for the
n other mating types, sometimes with opposite results
3 (A. BARBADILLA and H. NAVEIRA, in preparation).
L,
E N
z
0 1
I I I I I I 1 I I 1
0.0 0.1 0.2 0.3 0.4 0.5 0.6 0.7 0 . 8 0.9 1.0
F r e q u e n c y o f m a t i n g A a X A a (€I,,) AN ILLUSTRATION
Estimators for the probabilities of the different kinds of matings can be derived directly from Table 3, as a function of corresponding counts and errors:
e,,
= NlJN(1-
a1)601 = (No1
-
NellCXs)/N(1-
01,)
61, = (N1, - NellCllS)/N(1
-
OLp)e,
= [No,-
e,,('/)nN-
e,,('/,)nN]/Ne22 = [N22
-
el2(s/,)nN-
811('/4)nN]/Ndid not mate at random. This conclusion was, never- theless, complicated by the observation that putative genotype frequencies of the adult population were extremely similar to the frequencies expected under Hardy-Weinberg equilibrium, which implies random mating. Our analysis shows that both these two results may be spurious. Our estimates of the different mating frequencies are given in Table 4, under the observed frequencies, together with their corre- sponding standard errors. It is immediately apparent that there is a large difference between observed and
e,,
= 1-
[ell+
e,,
+
e,,
+
e,,
+
0 2 2 1 . estimated numbeis of the SC/TL X SC/TL mating.Of course, relative frequencies of the two gene ar- These estimators are consistent and unbiased. rangements do not change after our corrections, Their variances, which can be calculated also from although genotype frequencies do. These corrected Table 3, are given in the APPENDIX. genotype frequencies are significantly different from
Mating types inferred from the analysis of 6 larvae among the offspring of wild inseminated females of Drosophila pseudoobscura,
polymorphic for two gene arrangements on chromosome 3 (DOBZHANSKY et tal. 1963)
SCISC T L T L SClSC SClSC SClTL SClTL
X X X X X X
Mating types SCISC T L T L TL/TL SCiTL T U T L SClTL Total
Observed (DOBZHANSKY et al. 42.00 4.00 31.00 159.00 36.00 47.00 319.00
Corrected values (this paper) 39.60 3.59 27.11 152.20 25.24 7 1.26 319.00
Estimated probabilities 0.124 f 0.019 0.011 f 0.006 0.085 f 0.017 0.477 f 0.031 0.079 f 0.019 0.224 f 0.030 1.000 1963)
(f SD)
f(SC) = 0.656; f(TL) = 0.344
those expected under Hardy-Weinberg
(x‘
= 7.874, 1 d.f., P = 0.005), due to an excess of heterozygotes over expected. If genotype frequencies are equal for both sexes, genotypes still appear not to be mating at random(x2
= 9.368, 3 d.f., P = 0.025). On the one hand, deviation of genotype frequencies from Hardy-Weinberg expectations in the parental popu- lation may be due to sexual selection acting on males, which ANDERSON et al. (1979) have shown to be an important evolutionary force in this species, although it could be also explained by heterosis in viability (DOBZHANSKY and LEVENE 1948). This question might have been easily resolved by taking an additional sample of genotypes in the adult male population. On the other hand, the significant deviation from what we have called, following DOBZHANSKY et al. (1963), “random mating frequencies,” may be spu- rious. Just as DOBZHANSKY et al. did, we have derived expected mating frequencies under the assumption that genotype frequencies are the same for both sexes. There is no alternative, because with our technique for inferring the parental genotypes we cannot discern which genotype is the father and which is the mother. The lack of fit shown by thex*
test might easily be due to different genotype fre- quencies between males and females in the mating couples. If there is indeed sexual selection among males, our test might produce significant deviations from expected mating frequencies, even if males were mating effectively at random with females. This is our contention. The results of DOBZHANSKY et al. (1963) do not prove conclusively that adults did not mate at random; most probably, they reflect only different genotype frequencies between males and females engaged in mating, differences produced by sexual selection among the males. Again, this question could have been resolved only by taking an additional sample of genotypes from the adult male population.DISCUSSION
We give exact formulas for the probabilities of the different kinds of errors associated with the estima-
tion of adult mating frequencies from observed off- spring genotypes. For a single locus with two alleles it is possible to estimate actual mating frequencies with arbitrary small standard errors, by choosing the offspring sample size, the number of observed mat- ings, or both these numbers.
When more than two alleles for the locus in ques- tion are segregating in the population, the offspring sample size per collected female should not be smaller than 13, unless the corrections derived for the two allele model were also applied here. Then 11 off- spring genotypes should be examined in order to minimize the probability of type I errors associated with mating type 1 (Table 2).
The derivations of our formulae rest on several assumptions, which may be summarized as follows:
No gametic drive.
No viability differences among karyotypes in the laboratory.
No multiple insemination of wild-caught females, or, at least, strong predominance among the off- spring of the progeny sired by the last mated male.
Estimation of Mating Genotypes 47 1
If we desired to estimate the genotypes for several APPENDIX
loci of each mating pair, formulas might be derived
here for one locus, although the complication would mating probabilities are the following: be considerably increased by the much higher num-
For the case of one locus and two alleles the
by
the Same we variances associated to estimators of the differentber of different offspring genotypes and mating
types. var(611) =
"
(1 - cy1)' var(a) + var(b)
N2(1
-
( ~ 1 ) ' We wish to thank B. S. WEIR^^^ two referees for their commentson this manuscript. This material is based on work supported by grant PB85-0071 from the Comisi6n Interministerial de Ciencia y Tecnologia (CICYT), Spain to A.F.
LITERATURE CITED
ANDERSON, W. W., and P. R. MCGUIRE, 1978 Mating pattern and mating success of Drosophila pseudoobscura karyotypes in large experimental populations. Evolution 32: 416-423.
ANDERSON, W. W., TH. DOBZHANSKY, 0. PAVLOVSKY, J. R. POWELL and D. YARDLEY, 1975 Genetics of natural populations. XLII. Three decades of genetic change in Drosophila pseudoobscura.
Evolution 29: 24-36.
ANDERSON, W. W., L. LEVINE, 0. OLVERA, J. R. POWELL, M. E. DE LA ROSA, V. M. SALCEDA, M. I. GASO and J. GUZMAN,
1979 Evidence for selection by male mating success in natural populations of Drosophila pseudoobscura. Proc. Natl. Acad. Sci.
ARNOLD, J., 1981 Statistics of natural populations. I. Estimating an allele probability in cryptic fathers with a fmed number of offspring. Biometrics 37: 495-504.
ARNOLD, J., and M. L. MORRISON, 1985 Statistics of natural populations. 11. Estimating an allele probability in families descended from cryptic mothers. Genetics 109: 785-798.
DOBZHANSKY, TH., 1944 Chromosomal races in Drosophila pseu- doobscura and Drosophila persimilis. Carnegie Inst. Wash. Publ.
DOBZHANSKY, TH., 1958 Genetics of natural populations. XXVII. The genetic changes in populations of Drosophila pseudoobscura
in the American southwest. Evolution 12: 385-401.
DOBZHANSKY, TH., and H. LEVENE, 1948 The genetics of natural populations. XVII. Proof of operation of natural selection in wild populations of Drosophilapseuloobscura. Genetics 33: 537- 547.
DOBZHANSKY, TH., A. S. HUNTER, 0. PAVLOVSKY, B. SPASSKY and B. WALLACE, 1963 Genetics of natural populations. XXXI. USA 76: 1519-1523.
554: 47-1 14.
Var(&)
(1
-
a 2 ) 2 var(c)+
var(d)+ var(e)
+ [af/(l
- a1)~3 var(6)-
-
N2(1 - a 2 ) '
Var(612)
(1 - a212 var(i)
+
var(j)+
var(e)-
+
[af/(l-
a1)'] var(b)-
N2(1
-
O L ~ ) ~Var(&)
var(f)
+
var(g)+
var(h)L
+
+
Genetics of an isolated marginal population of D. pseudoobscura.Genetics 48: 91-103.
evolutionary history of D. hmtii. 11. How much has chro-
mosomal polymorphism changed in colonization? Evolution Var(602) FONTDEVILA, A., A. Rulz, J. OCANA and G . ALONSO, 1982 The
+
36: 843-85 1 . * r
(1
-
ad.>
var(b)]LUYKX, P., 1981 A sex-linked esterase locus and translocation heterozygosity in a termite. Heredity 46: 315-320.
RUIZ, A., A. FONTDEVILA, M. SANTOS, M. SEOANE and E. TORROJA,
1986 The evolutionary history of D. bilwatii. VIII. Evidence for endocyclic selection acting on the inversion polymorphism in a natural population. Evolution 40: 740-755.
SAMOLLOW, P. B., P. S. DAWSON and R. A. RIDDLE, 1983 X-linked and autosomal inheritance patterns of homologous genes in two species of Tribolium. Biochem. Genet. 21: 167-176.
SMITH, R. L. 1984 Sperm Competition and the Evolution of Animal
Mating System. Academic Press, New York.
SOBEL, M. J., J. ARNOLD and M. SOBEL, 1986 Statistics of natural populations. 111. Sequential sampling plans for the estimation of gene frequencies. Biometrics 42: 45-65.
Communicating editor: B. S. WEIR
= N2 Y
var(p)
+
var(q)+
var(g)+
var(m)+
(')'" var(b)+
( Y2)(1
-
a1)2 (1-
a 2 1 2 (var(d)+
2 var(e)+
var(j)) (3i)2"a$2 var(b)+
(1
-
a1)2(1-
a 2 ) 21
where:
Var(a) = N e l l ( l
-
0 1 1 ) ;Var(c) N e o l ( l
-
Var(d) = NB01a2(1
-
a 2 ) ;Var(e) = NBllol3(1 - a s ) ;
Var(f) = N 8 d 1
-
8 0 0 ) ;Var(g) =
~ e ~ , ( % ) ~ [ i
-
(%)"I;
Var(h) = N e l l ( % ) n [ i
-
(%)"I
Var(i) = N012(1 - 0 1 2 )
Var(j) = N012a2(1
-
a 2 )Var(k) = Ne22(1
-
e22)
Var(rn) =
~ e , ~ ( % ) " [ i
-
(%)"I
Var(p) = N&(1
-
e021
Var(q) =
~ e , , ( % ) ~ [ i
-
(%)"I.
Two kinds of error are incorporated in all these variances: that due to the offspring sample size per collected female (error of diagnosis of parental ge- notypes) and that due to the size of the sample of
inseminated females (error of sampling from the
population of inseminated females). Both kinds of
error affect the estimation of mating frequencies in the population.
As an example of the derivation of these formulas
we examme
Var(B11) = (1 - var(a) + var(b)
N2(1
-
a,)?which corresponds to the matings between two iden-
tical heterozygotes, for example Aa X Aa.
Since
e,,
= N,,/N(l-
a,),we have
Var(Bll) = Var[N1l/N(l
-
a,)]= Var[kll/(l
-
a,)] = [~ar(k11)]/(1-
a,)*.The variance of kll(Nll/N) correspond to a binom-
ial distribution, so
Var(kl1) = [kll(l
-
kll)]/N andVar(B11) = [kll(l
-
k11)1/~(1-
all2.This last formula can be expressed as
Var(B1l) = (1