ABSTRACT
HUDNUTT, BETHANY S. Teaching Functions with Dynamic Graphing Tools: A Study of Lesson Plans. (Under the direction of Dr. Hollylynne Lee).
Graphing technologies are replete in high school mathematics courses concerned with the teaching and learning of functions. Much research has been devoted to the examination of student use of such technology but tends not to differentiate between the technology itself and the lesson activities designed to implement that technology.
Relatively little research, in comparison, has focused on how teachers choose to use such technology for teaching about functions and related concepts. This study investigates teachers’ choices on how to implement two dynamic graphing java applets into their lessons about functions.
The investigation primarily uses two frameworks in analyzing lesson activities: Vinner’s (1983) concept images and the APOS (Action, Process, Object, Schema) theory of mathematical knowledge acquisition, initially conceived by Dubinsky and Harel (1992) and expanded upon by Asiala et al (1996).
Using these two frameworks as a guide for analysis, teacher intentions for using the software are examined within their lesson planning process. Analysis of the lessons shows how teachers intend to develop a function’s mathematical structure using the various representations of functions. Findings show a consistency between teachers’ expressed learning goals with how they chose to integrate the software, a reliance on the historical definition of function to develop concept images, and helping students
TEACHING FUNCTIONS WITH DYNAMIC GRAPHING TOOLS: A STUDY OF LESSON PLANS
by
BETHANY HUDNUTT
A thesis submitted to the Graduate Faculty of North Carolina State University
In partial fulfillment of the Requirements for the degree of
Master of Science
MATHEMATICS EDUCATION Raleigh, NC
2007 APPROVED BY
Dr. Karen Hollebrands Dr. Hollylynne Lee, Chair
DEDICATION
To my ever loving husband, David Hudnutt. I could not have accomplished this without you. You complement my whole being in mind, in body, and in spirit.
To my mother who read every word of this document and cared enough to spend many hours providing her gift of words.
To my family and friends for your thoughtful and caring support through this arduous yet rewarding process.
BIOGRAPHY
Bethany Snyder Hudnutt was born as Bethany Lynn Snyder, to the parents of Patricia Peppercorn Groves and James Floyd Snyder on January 3rd, 1972. Bethany graduated high school in 1990 from Upper Arlington, OH and proceeded to her
undergraduate career at Bethany College. Bethany gained her baccalaureate degree from Ohio University in March 1995 in mathematics education.
Since obtaining her undergraduate degree, Bethany has had a variety of professional experiences relating to mathematics education. She taught applied
mathematics at Tri-County Joint Vocational School in Nelsonville, OH until she and her significant other, David Hudnutt, moved to Durham, NC in the summer of 1997. She taught an additional year at South Granville High School in Creedmoor, NC. Beginning September 1998, Bethany worked for Measurement Incorporated as a lead item writer developing standardized tests.
In the summer of 2000 while on jury duty for Durham County, she met the executive director of Shodor, a non-profit company dedicated to the integration of
computational science in education. That fall, Bethany took a position with the company working on materials development for Shodor’s online mathematics education
ACKNOWLEDGEMENTS
I would like to thank my husband, David Hudnutt, and my mother, Patricia
Groves, for their steadfast and unwavering support. You were always there to lend an ear or a shoulder. You both have gifts of wisdom and a knack for understanding my needs and helping me to address them.
Professionally, I would like to thank my advisor Dr. Hollylynne Lee. I knew very soon after we met Hollylynne had a lot of guidance to offer. Through this process of coursework, research, and writing, I have obtained a new level of professionalism in the field. You have encouraged and guided me through it, helping to navigate the often rough waters of the research process. Your time and your insights were invaluable.
I would also like to thank my co-workers at Shodor, and in particular the
TABLE OF CONTENTS
LIST OF TABLES………...viii
LIST OF FIGURES………...….ix
CHAPTER 1 - INTRODUCTION... 1
Software to Promote Understanding of Functions... 4
Description of the Flyer Graphing Activities ... 5
Problem Statement ... 8
CHAPTER 2 - LITERATURE REVIEW... 10
Function Definitions ... 10
Graphing Technologies in the Classroom... 11
Multiple Representations and the Learning of Functions ... 16
Action, Process, Object, Schema (APOS) Framework... 19
Teaching Functions... 24
Theoretical Framework Synopsis ... 26
Research Question ... 28
CHAPTER 3 - METHODOLOGY... 29
Participants and Context of the Study... 29
Data Sources and Methods of Collection... 30
Initial Interview... 30
Lesson Plan Artifacts... 31
Exit Interview... 32
Data Analysis Methodology ... 33
Assertions... 39
Assertion #1 ... 40
Assertion #2 ... 45
Assertion #3 ... 47
Assertion #4 ... 49
Assertion #5 ... 52
Assertion #6 ... 53
Assertion #7 ... 55
CHAPTER 5 - CONCLUSIONS ... 57
Summary of Study within the Framework... 57
Findings... 59
Learning Goals... .59
Function Definitions... .60
Use of Function Representations... .61
Implication and Recommendations………63
For Teaching... .63
For Research... 64
For Software and Supporting Materials... 65
Footnotes………68
REFERENCES ... 69
APPENDICIES………..74
Appendix A - Form for Participant Identification and Selection………...75
LIST OF TABLES
Table 1: Function Analysis Framework (Moschkovich, Schoenfeld, and Arcavi, 1993). 17
Table 2: Data Collection Context ... 32
Table 3: Lesson on Inverse Functions ... 36
Table 4: Lesson on Sine Curve Transformations and Data Fitting... 36
Table 5: Lesson on Least Squares Line ... 37
Table 6: Lesson on Power Function Transformations ... 38
Table 7: Lesson on Parabola Transformations... 38
Table 8: Lesson on Transformations across Function Families... 39
Table 9: Lessons aligned by NCSCoS ... 41
LIST OF FIGURES
Figure 1. Function Flyer Interface... 6
Figure 2. Data Flyer Interface ... 7
Figure 3. Other controls for Data Flyer... 8
Figure 4: Function Framework Synthesis ... 27
CHAPTER 1 INTRODUCTION
Graphing technology potentially influences students' understanding of mathematical functions. This study concerns the impact of graphing technology on teachers’ planning and implementation to meet learning goals for student understanding of mathematical functions. The formation of a well-defined function concept should be a central concern to the teaching of mathematics because functions are fundamental to most mathematical pursuits. For example, the study of advanced pure mathematics ultimately falls into two categories: sets and functions. In applied mathematics, functions are commonly used to develop mathematical models of numerous aspects in the world around us to examine trends and make predictions. Functional models also pervade all branches of science: classical sciences such as physics and chemistry, social sciences such as economics and sociology, natural sciences such as biology and geology, and engineering sciences such as computer science and architecture. Further, Piaget and his colleagues demonstrated children as young as four years old have a qualitative intuitive sense for functional relationships (1968/1977).
State and national curricula reflect the importance of understanding functions, usually including functions as a major organizing strand within the objectives. The
Principles and Standards developed and adopted by the National Council of Teachers of Mathematics (NCTM) specify that “Instructional programs from prekindergarten through grade 12 should enable all students to understand patterns, relations, and functions
specifies that “High school algebra also should provide students with insights into mathematical abstraction and structure.” Specifically in grades 9-12 student should--
• Understand relations and functions and select, convert flexibly among and use various representations for them;
• Understand and perform transformations such as arithmetically combining, composing and inverting commonly used functions…;
• Understand and compare the properties of classes of functions, including exponential polynomial, rational, logarithmic, and periodic functions. (p. 296)
Much of the literature regarding the teaching and learning of functions refers to the learner’s concept image of function, (Vinner, 1983; Vinner and Dreyfus, 1989; Tall, 1989; Slavit 1997; Sfard, 1994; Thompson, 1994). Vinner and Dreyfus found that a learner may know the formal definition of function yet not fully be able to apply it. This is the case, in large part, because the correct application depends upon the learner’s concept image of function, rather than the definition itself.
When deciding whether an example is or is not a function, a learner may apply a mental image believed to be a generic representative of a mathematical object, (Vinner and Dreyfus, 1989). Prior to fully integrating new knowledge, a learner often
compartmentalizes new information and is unaware of potential inconsistencies contained within his/her cognitive schemes.
Hence, from an instructional point of view, before a teacher can expect learners to use and apply functions accurately, the teacher must assist in accurately developing their concept images to encompass the definition. Simply providing definitions is insufficient without assisting the learners in developing an intuition for the mathematical object.
accurately. The NCTM Principles and Standards (2000) stress multi-representational approaches and the important role technology plays in teaching about functions. Graphing without the use of computing technology, often referred to as “graphing by hand,” requires that a person creating a graph to already have an understanding of the behavior of the co-domain in relation to its domain. This is in order to accurately identify and subsequently graph changes in localized behavior such as maxima and minima or curvature.
Technology has the potential to fundamentally alter the order in which a learner develops a concept image for functions. Graphing software potentially inverts the historical sequencing of teaching functional representation or, at least, allows for the concurrent development of multiple representations in the mind of the learner. Software can create the graphical representation of a function which allows the user to investigate globalized functional behavior without any prior understanding of localized behavior. Indeed, teachers can now use technology-generated graphs as a pedagogical tool to help students investigate global functional behavior in order to develop a sense of localized behavior.
In their analysis of research on the teaching and learning of functions, Leinhardt, Zaslavsky, and Stein (1990) note that, “more than perhaps any other early mathematics topic, technology dramatically affects the teaching and learning of functions and graphs,” (p. 7). Teachers can utilize technology to have students make observations and
the use of technology, teachers can expose students at a much earlier stage in their cognitive development to the function concept. This, in turn, allows students to explore the connections among representations enabling the learning of functions to become investigative in nature.
The NCTM supports this view of using technology to enhance student learning. As stated in one of the seven principles in the Principles and Standards, “Calculators and computers are reshaping the mathematical landscape, and school mathematics should reflect those changes. Students can learn more mathematics more deeply with the
appropriate and responsible use of technology. They can make and test conjectures. They can work at higher levels of generalization or abstraction,” (NCTM, 2000, p. 25).
Software to Promote Understanding of Functions
Shodor, a company which promotes the integration of computational science in education, developed two graphing activities, Data Flyer and Function Flyer
(Interactivate, 2007). These activities are available as java applets on Shodor’s
Interactivate website. The intent of these graphing applications is to foster a global understanding of functions through dynamic linking among graphical and symbolic representations as well as output of tabular values. Shodor designed these applets to promote a learner’s ability to generalize behavior within a function family such as linear, quadratic, logarithmic, etc. These applets “allow the manipulation of the constants and coefficients in any function thereby encouraging the user to explore the effects on the graph of the function by changing those numbers,” (Interactivate, 2007).
can recognize patterns of shifts and stretches that exist across all function types (see Footnote 1).
Description of the Flyer Graphing Activities
The Flyer activities are based java applets belonging to Shodor’s larger web-based project, Interactivate (2007). Interactivate contains a collection of over one hundred interactive activities supporting the teaching and learning of mathematics in the K-12 curriculum. The project also offers numerous support materials such as help files, lesson plans, worksheets, and discussions on mathematical concepts presented in the activities.
The Flyer activities offer the dynamic, visual aspects designed in the same spirit the NCTM suggests in its Principles and Standards (2000). From the Technology Principle (2000):
Using technological tools, students can reason about more-general issues, such as parameter changes, and they can model and solve complex problems that were heretofore inaccessible to them (pg 26).
As well,
Dynamic geometry software can allow experimentation with families of geometric objects, with an explicit focus on geometric transformations. Similarly, graphing utilities facilitate the exploration of characteristics of classes of functions (pg 26).
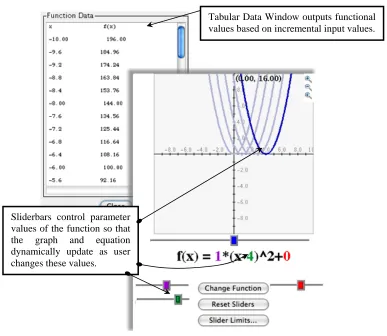
The Function Flyer java applet interface, shown in Figure 1, utilizes color coded slider bars to control parameters from a function entered by the user. The numeric values in the parameters change simultaneously with the graph, allowing the user to visualize the connection between the constants and coefficients in the function’s symbolic and
updated with the use of the sliders. Because of computational limitations, if the
“Function Data” window is open, the user is prohibited from moving the sliders in order to prevent the tabular values from being updated dynamically.
Tabular Data Window outputs functional values based on incremental input values.
Sliderbars control parameter values of the function so that the graph and equation dynamically update as user changes these values.
Figure 1. Function Flyer Interface
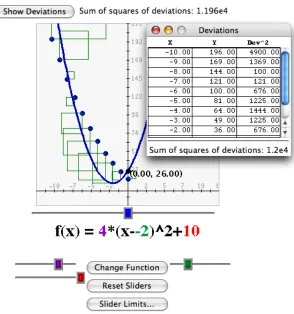
The Data Flyer interface, shown in Figure 2, is an expanded version of the
Function Flyer interface that also allows the user to input and plot data on the same graph as the function, with the potential to manually fit a function to a data set. Data Flyer
individual deviations by drawing squares on the graph corresponding to the “squared” vertical distance between the function values and the data. If the “Show Squares” feature is turned on, the squares dynamically update as the user changes the parameters of the function with the sliders.
Figure 2. Data Flyer Interface
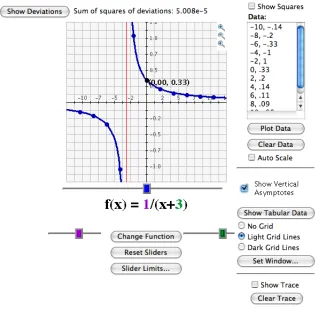
The interface also gives the user control of a number of other features in the activity. The controls for Data Flyer, shown in Figure 3, allow the user to manipulate the
functions swept out from changing parameters with the sliders. The Function Flyer
interface also contains all of these controls with the exception of the ones pertaining to input and output of data and subsequent features.
Figure 3. Other controls for Data Flyer
Problem Statement
teacher can design and execute a lesson to leverage the power of the tools which focus student attention towards a specific learning goal.
As will be discussed in Chapter 2, a plethora of studies exists about the effects of technology integration into mathematics classroom instruction. Few studies investigate
how teachers choose to implement particular kinds of technology into their lessons and how those choices influence student learning. This particular study qualitatively examines several teachers’ implementations of the Function Flyer and Data Flyer
graphing technologies into the lesson planning process.
Primarily, this study examines how teachers choose to utilize these specific java applets in their lessons with the purpose of gaining insights for future development of materials within the Interactivate site. Specifically, the research aims to (a) inform future development of support materials provided in Interactivate such as lesson plans,
worksheets / labs, discussions; and (b) influence interface changes in the Flyer activities. Secondly, and more generally, this study intends to provide insights on the
CHAPTER 2 LITERATURE REVIEW
Graphing technology, as with all open-ended explorations and manipulatives, does little to improve conceptual understanding unless directed by well-defined goals. The teacher bears the primary responsibility for setting the didactic environment in order that students may uncover the patterns inherent to those manipulatives.
This study examines how teachers set the instructional environment for students to learn functions using a particular set of graphing tools. In order to frame this analysis, relevant literature is presented on the research and theory of how students develop the function concept. Potential effects of using graphing technologies for teaching and learning about functions are also explored.
Function Definitions
Historically, the definition of function was limited to the input and corresponding output of a two-variable equation (Malik, 1980). A function transforms numerical values taken on by the independent variable (the input) and through structured computations on that value, assigns the transformed value to a dependent variable (the output).
formal definition in high school mathematics, most instruction focuses on functions described by a single mathematical equation, (Vinner & Dreyfus, 1989).
Because instructional focus has primarily remained on functions represented by equations, computing technologies are a natural extension for working with functions. Soon after Casio introduced the first graphing calculator into the market in 1986 (Japan Corporate News Network, 2007), the instructional climate for the teaching and learning of functions within the United States began to change substantially.
A number of graphing technologies now proliferates the mathematical education technology market and mathematics classrooms. Texas Instruments, Inc. offers a wide range of graphing calculators for use from middle school through the undergraduate curriculum. Vernier Software and Technology, Inc. produces a wide variety of probes for data collection to be used in conjunction with the calculators to create graphs of real data collected by devices such as motion detectors, light intensity meters, thermometers, and heart rate monitors. Graphing and function based software include spreadsheet
applications, interactive java applets, Geometer’s Sketchpad (Jackiw, 2001), Fathom
(Finzer, 2001), SimCalc (Mathematics Education Research Group, 2007), Function Probe
(Confrey, 1991), Green Globs (Dugdale & Kibbey, 1997), and Function Sketcher
(Yerushalmy & Shternberg, 1998).
Graphing Technologies in the Classroom
when the computation is not the point of the lesson, thus helping students to see emergent patterns without being bogged down by peripheral detail.
A number of studies have examined the use of graphing technology for learning about functions. Doerr and Zangor made in-depth observations and an analysis of a pre-calculus class that extensively used the graphing calculator. They found that this
technology was instrumental in facilitating analytical thinking. The teacher designed the instructional tasks involving a variety of functions where students were required to describe patterns, represent data, and make and justify generalizations.
In regards to the ease in which functions can be graphed and manipulated with software, Dugdale (1993) finds that these tools have, “raised the possibility of visual representations of functions playing a more important role in mathematical reasoning, investigation, and argument. Relationships among functions can be readily observed, conjectures can be made and tested, and reasoning can be refined through graphical investigation,” (pg. 115).
the dynamics on the screen that makes the difference in student learning. Students must integrate what they see on the computer screen into their own conceptual structures for any learning to take place.
Vinner and Dreyfus (1983) identify a learner’s internal representation of a mathematical construct as a concept image. Tall (1989) examines the potential of well-designed software to improve a learner’s concept image of function by allowing the learner to explore the complex structures of functions. The software allows students to experience higher level cognitive structures than they would be able to without such software.
Tall (1989) asserts that there is a danger in teaching mathematics by building from the simple to the complex. When presented with simplified versions of complex mathematical concepts, students tend to build their concept images from these contexts. “These deeply ingrained cognitive structures can cause serious cognitive conflict and act as obstacles to learning,” (Tall, 1989, pg 37). He suggests students can more readily explore complex concepts through the use of technology, without first needing to build from the simple to the complex.
Dugdale (1993) concurs with Tall. Due to her own research on the use of technology to support student thinking with functions, as well as reviewing others’ research, Dugdale states, “Such tools have facilitated the movement away from a focus on calculating values and plotting points toward a more global emphasis on the behavior of entire functions, end even families of functions,” (pg 114). Hence students can study the more complex global aspects of function prior to or in parallel with studying
Because mathematical ideas are often introduced to students in simplified
contexts, students form inflexible concept images that rely on those simplifications. For instance, in a traditional algebra curriculum, single-variable linear equations are usually introduced prior to two-variable equations. Students are expected to solve single-variable equations to find the solution which makes it true. Two-variable linear equations are presented after much energy has been spent on solving a variety of the single-variable equations. Graphing two-variable equations comes even later in the curriculum sequence. Graphs are often developed from graphing individual coordinate pairs produced from an input / output table. The linear model becomes the learner’s concept image for functions.
Indeed, through their research, Schwarz and Hershkowitz (1999) demonstrated students’ propensity for linear models when it was inappropriate for the task at hand because of their linear concept image of function. Even though the students in the control group knew the correct definition of function, they were unable to apply it. In an attempt to foster a more robust concept image, students in the experimental group used software that dynamically linked equations, tabular values, and graphs of functions. The
instructional model focused on inquiry within small groups, allowing students to choose which function representations and the linkage of those representations when solving problems. Students were also required to write and share reports to compare their solutions to other classmates. Those in the experimental group demonstrated improved use of appropriate functions beyond the linear model.
“tangent” related to a line touching the circle at a single point. Students taking calculus relied on this image when identifying a tangent line to a function at a given point and regularly concluded that if a tangent line intersected the function in more than one point the tangent could not exist. Using specially designed software, students in an
experimental group graphically explored tangency as related to function, with instruction focused on teacher / student discourse. In this group, Tall found marked student
improvement in concept imaging when compared to the control group.
However, when computers are used for simulation of mathematical constructs, there are still opportunities for misinterpretation. Goldenberg (1988) identified student difficulties with graphing technologies due to issues of scale. Students unfamiliar with notions of window sizing, scaling on the axes, and global behaviors experienced
difficulties in using the technology to understand graphs. Moschkovich, Schoenfeld, and Arcavi (1993) found students interpreted the pixilation of a line represented on a graph as an actual property of the line.
Students must make sense of whatever they see on the computer screen and internalize that understanding with their already existing constructs of and internalize with their already existing constructs. Tall (1989) identifies three types of insights used to make sense of what is seen and experienced through the use of educational software.
External insight occurs when the user does not know how the software was programmed or the algorithms it uses yet can use prior knowledge to check for validity of the output. When the user does have a sense of the algorithms the computer uses, such as a
Riemannian sum for approximating integrals, Tall defines that as analogueinsight.
used to create the software. Tall suggests that both teachers and students must have external insight for using software for learning and that it is helpful, thought not necessary, for teachers to have a notion pertaining to analogue insight.
Multiple Representations and the Learning of Functions
In the study of functions in traditional high-school algebra, primary focus is given to two-variable equations with a given output for a particular input. Both Rider (2004) and Eisenberg and Dreyfus (1994) showed student preferences for this symbolic form of function when solving problems even when this form is not a convenient way to find a solution. Because of the widespread availability of graphing and computing software, mathematics educators are now able to leverage the use of a variety of functional
representations for teaching, the most common of which include tables, equations, and graphs.
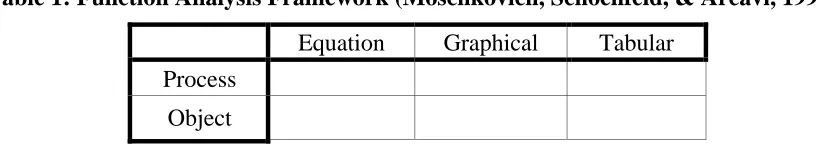
Much attention in the literature has been devoted to what is commonly known as the use of multiple representations in the teaching and learning of functions. (Heibert & Carpenter, 1992; Moschkovich, Schoenfeld, and Arcavi,1993; DeJong et al, 1998; Porzio, 1999; Rider, 2004). This research shows improved student ability to use and apply different representations when solving function related problems when the instructor uses multiple representations of functions concurrently within the lessons. Moschkovich, Schoenfeld, and Arcavi (1993) developed a framework in which to analyze students’ understanding of function. Their framework examined students’ reasoning about
where a particular representation did not provide sufficient information in solving a problem. The second perspective, which will be subsequently discussed at greater length, involves students’ ability to view a function as a process of inputs and outputs and to view a function holistically as an object.
Table 1: Function Analysis Framework (Moschkovich, Schoenfeld, & Arcavi, 1993)
Equation Graphical Tabular
Process Object
Relying on the framework from Moschkovich et al (1993), Knuth (2000) examined students’ ability to associate points on a line with the linear function itself. Knuth found that the students who relied almost exclusively on a single representation struggled more to provide proper reasoning about problems related to linear functions than those who used multiple representations.
In her research, Rider (2004) showed improved student problem solving and improved reasoning about functions when using a multi-representational approach. Rider compared a control group of students who were taught using a traditional algebra
curriculum to students in an experimental group using a multi-representational approach. On the post-test, students in the experimental group clearly outperformed those in the control, whereas the pre-test showed students began the course at comparable ability levels.
representative of a single mathematical object. Schwarz and Dreyfus (1995) assert that compartmentalization arises in the translation among function representations because students do not comprehend these representations as different forms of a single object. Rather, students will tend to view these forms each as different mathematical objects in and of themselves as opposed to the same object in different forms. Thus, students only superficially connect these representations and do not find contradiction if the underlying structure of the forms do not align.
As well, the use of external representations of functions without carefully designed lessons to ground the representations in a context familiar to the learner does little to improve comprehension of the function concept. In an in-depth analysis in 1994, Schoenfeld, Smith and Arcavi found that a college student who was well-versed in
learned in isolation of others.” Kaput continues to echo these sentiments in later years, Just because representations are linked, if there is no connection to other knowledge in the learner’s schema / experience the linked representations are just as meaningless. Students may understand cause and effect relationships within the representations yet still not have a mental image of what any of the representations, linked or not, mean (pg 7, Kaput, 1998).
Van deWalle and Lovin (2006) also agree. In addition to what Kaput names as the “big three” (1998) Van deWalle and Lovin find two additional function
representations: contextual and verbal. The context grounds the learner within his / her cognitive structure or personal experience. A verbal description allows the learner another route in which to understand the symbolism, relating the independent and
dependent variables. Van deWalle and Lovin (2006) assert students should be able to see a connection among all five of these representations for any given function.
In lesson planning, the teacher makes premeditative choices in developing the context and then, during lesson execution, makes spontaneous choices to direct student attention to specific aspects of the situation being represented. The teacher bears responsibility to “weave a representational context” [original italics] (Ball, 2002, pg. 4) and act as arbiter in choosing how students interact with unfamiliar concepts. Throughout the lesson, the learning domain must remain relatively familiar to the learner, enabling him or her to extend and make sense of new concepts in relation to previously
internalized cognitive schema, (Lampert, 1989).
Action, Process, Object, Schema (APOS) Framework
assigns it to a new value designated as the output. As an object, a function is the collection of all possible unique input values paired with all of their subsequent output values. A learner with a robust conception of function will be able to call upon both of these views of function as needed.
Based on the work of Dubinsky and Harel (1992), Asiala et al (1996) developed the APOS framework describing how a learner constructs mathematical knowledge. The acronym, APOS, is derived from the single-word descriptions given to each of four progressions; action, process, object, schema, describing this mathematical construct and integration into cognitive structure.
Action. During the action stage, the learner applies one or more external actions or rules to utilize the mathematical construct. In an example applied to the learning of linear functions, a student may know how to find the slope of the function by looking at the equation of a line, solving for the dependent variable, and writing down the value of the coefficient multiplied by the independent variable. In the action stage, the learner exhibits what Skemp (1978) refers to as relational understanding where he / she does not have a sound notion of why the actions work but can apply those actions in order to find a correct solution. If the problem situation requires multiple steps, the learner moves forward a single step at a time unaware of the steps in their entirety, i.e. unaware of the overall process.
yet unaware of the construct as an object. At this stage, the learner is aware of all the steps required to for the construct but does not need to consciously think about the steps in order to perform them. The learner has immediate access to any step without actually having to perform each action.
A process view of function allows for the reversibility of actions. For example, in learning about the concept of slope pertaining to linear functions, the student would be able provide a variety of linear functions from a given slope. The learner views slope as a property of linear functions in general and is not concretely bound to a specific function in order to identify the slope.
However, the student with a process view cannot yet treat the linear function as a holistic object. In the case of slope, the student cannot envision the consequence of varying slope and how that variation dynamically transforms all of the outputs from the function’s domain.
Object. When operating with an object view, a learner encapsulates the process into a unified entity. The mathematical idea has now been grounded in the mind of the learner as an object on which he or she can operate. The learner can now anticipate the effects of a transformation on the object without the need of stepping through the process of the transformation.
all viewed as different aspects of the same mathematical structure. Thus the learner understands that a variation in the slope on a graph, for example, creates changes within the other representations of the function because all of the representations are simply manifestations of a single object.
It is important to note, however, that the object can be transformed back into a process when necessary. When using a mathematical object, it often becomes necessary to deconstruct the encapsulated object and transform it back into a process in order to use the process. For example, a problem situation may require identification of a specific output for a given input of a function. If the learner recognizes and is able to switch back into a process mode, the learner has achieved a process/object duality (Sfard &
Linchevski, 1994).
Sfard & Linchevski (1994) describe the capacity to flexibly move between process and object as versatile and adaptable thinking:
In certain circumstances a person may display his or her ability to see an expression as a process, in another context he or she may view it as the product of this process, and in still another situation as a function. One would say, therefore, that the versatility of his or her outlook is quite impressive. This, however, does not necessarily mean that the person will always be able to adapt the perspective to the task at hand, (p. 99).
Thus the thinking process of an individual who could view a construct as process or object given a particular situation would be characterized as versatile. Whereas the ability to apply the particular properties of the construct as process or object depending on the situation would be characterized as adaptable.
Schema. A schema encompasses all of an individual’s actions, processes, and
ideas within ones cognitive structure. With regards to the slope example, the concept is now subsumed into the learner’s overall linear function schema.
Dubinsky and McDonald (2001) compare a schema to concept image, “because… all mathematical entities can be represented in terms of actions, processes, objects, and schemas, the idea of schema is very similar to the concept image…,” (pg. 3). However, they also differentiate schema from concept image because a schema must be, “coherent in the sense that it gives, explicitly or implicitly, means of determining which phenomena are in the scope of the schema and which are not,” (pg. 3).
It is the nature of mathematics that structures are combined and compressed to form new objects. In this manner, once an individual reflects and acts upon these schemas, the schemas themselves become objects.
Objects can be transformed as higher level actions, leading to new processes, objects, and schemas. Hence we have a mechanism which may be envisioned as a spiraling of action, process, and object, within expanding schemas (Sfard & Linchevski, p. 99).
So, though these four conceptions, Action, Process, Object, Schema, are hierarchical to a degree, they are not discrete, (Dubinsky & McDonald, 2001). One view precedes the other, but there remains an oscillation between two views as the learner incorporates more complicated pieces of a concept into the schema obtaining the spiraling effect.
Furthermore, if a learner compartmentalizes objects which are actually parts of the same structure, it also raises the possibility the learner can understand an object in one form yet only have a process view of another. In working to avoid this
object is represented, which they name as the representation. They are careful to make this distinction because, similar to the Action of APOS they also recognize that,
concept acquisition is intimately linked to actions. The lack of such actions in certain setting implies that properties may not be seen as invariant through several settings. Such properties may, for the learner, become features of formal objects (graphs, formulae or tables) rather than properties of the concept itself. This is why the above compartmentalization of students’ knowledge occurs, (pg. 264).
A number of researchers have applied the APOS framework to analyze student thinking about functions and related concepts. Dubinsky & McDonald (2001) cite over fifty articles in an annotated bibliography of research which use the APOS framework. As mentioned earlier in this literature review, Moschkovich and colleagues (1993), as well as Knuth (2000) examined student conceptualizations in conjunction with a multi-representational approach. Laige and Gaisman (2006) apply the framework to
understanding transformations of functions.
Teaching Functions
To be effective, the teacher must not only have a well-mapped and accurate function schema, but must also grasp the roots of students’ schemas, however well or malformed. Additionally, the teacher must understand a myriad of pathways that may shape the concept within the minds of his or her students.
Teachers must work to unpack these mathematical objects for their students. Ball and Bass (2000) refer to this as the ability to “decompress” the content.
…most personal knowledge of subject matter knowledge, which is desirably and usefully compressed, can be ironically inadequate for teaching. … Because teachers must be able to work with content for students in its growing, not finished state, they must be able to do something perverse: work backward from mature and compressed understanding of the content to unpack its constituent elements, (pg. 98)
Hill, Rowan, and Ball, (2005) have given a good deal of attention in their research to this type of specialized teacher knowledge, what Schulman (1986) identified as
pedagogical content knowledge. Teachers must be aware of their own internal
constructs in order to communicate those ideas to their students. Teachers must also tease out their students’ cognitive structures in order to build upon them. In doing so, teachers deconstruct compacted mathematical objects and communicate about schemas to relay this interconnected web of related mathematical ideas to their students.
With regards to teaching functions using graphing technologies, Simmt (1997) examined the impact of the graphing calculator on how teachers design and implement lessons with it. As noted earlier, many educators and researchers herald the potential for graphing technology to fundamentally change how mathematics is taught. However, the bulk of the research on functions with graphing technologies examines how students learn with it rather than examining how teachers choose to teach with it.
Theoretical Framework Synopsis
This study examines teachers' intentions for promoting student thinking about functions via their lesson planning process and reflections on those lessons. How teachers intend to facilitate student thinking will be considered through APOS and concept images. Both APOS and concept images provide the framework for how learners internally conceptualize a mathematical construct. However, because student thinking is not observed in this research, the framework also incorporates an
observational component. This component is used to examine the pedagogical context the teachers set through their learning goals, function definitions, and function
representations and linkages among them.
With regards to the conceptualization of the function concept, Vinner and Dreyfus (1989) theorized that students call upon concept images when applying their knowledge to a mathematical task. Asiala and colleagues (1996) theorized that, when learning about and applying the function concept, a person operates in one of several modes: action, process, or object. When operating within the action mode the learner has yet to form any true understanding of the concept.
To flexibly use functions in mathematics, the learner must possess the ability to work with functions within both a process and an object mode. Hierarchically, a learner, typically acquiring a process view prior to understanding function as an object, tends to oscillate between these views as the concept becomes more complex.
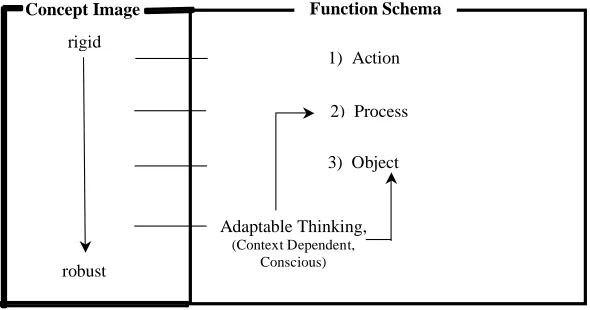
between a function as process or object, depending on the appropriateness within a given context, is characterized as an adaptable thinker. Therefore the student who, given a mathematical task involving functions, actively chooses either a process or object mode, also must have an adaptable concept image to the given task. Figure 4 synthesizes these conceptual processes.
Function Schema
1) Action
2) Process
3) Object rigid
robust
Concept Image
Adaptable Thinking,
(Context Dependent, Conscious)
Figure 4: Function Framework Synthesis
With regards to the pedagogical context, the function framework described above can be observed through teachers’ chosen learning goals, use of function definitions, and use of function representations. A teacher’s choice of a particular lesson’s learning goals will delimit possible student activities for that lesson. In turn, the learning goals in which a teacher chooses indicate what that teacher deems important for student learning. Thus, studying teachers’ chosen learning goals provides insight regarding their intentions for the development of the function concept.
The more robust a learner's concept image of a mathematical construct, the more accurately that image will map to the definition. The robust concept image will be constrained by a definition's limits yet be flexible enough to include all of the construct’s permissible properties. Subsequently, an examination of how a teacher intends to use the definition of function yields information on how that teacher may work to develop students’ concept images.
Lastly, observing how a teacher chooses to incorporate function representations and links among those representations will help discern how that teacher develops students’ understanding of function within the APOS framework. The utilization of function representations within the context of teachers’ lessons demonstrates their intentions of how they encourage students to think about functions and how they want students to operate with and on them. For students to understand a function as an object, they need to view the representations of functions as different views of the same
construct. For students’ thinking to be adaptable, they need to readily move from
process to object and vice versa, requiring fluid translation among representations. Research Question
The research framework discussed is used as a lens to examine teacher intentions of developing students’ concept images towards an adaptable understanding of function as process and object. Specifically, this study investigates teachers’ planning and reflections to answer the following research question:
• What is the nature of how teachers who instruct courses beyond Algebra I
CHAPTER 3 METHODOLOGY
To answer the research questions, three North Carolina mathematics teachers, currently teaching courses involving the study of functions beyond Algebra I, agreed to participate in the study. The researcher collected and qualitatively analyzed the data. This chapter describes participant selection and the context in which the data were collected. The instruments for, and methods of, data collection, and the methods of analysis are subsequently described in light of the research questions.
Participants and Context of the Study
Participants in the study included three high school teachers who participated in the Advanced Functions and Modeling Workshop developed and offered by faculty from the North Carolina School of Science and Mathematics (NCSSM) in summer of 2006. NCSSM developed and began offering this workshop in the summer of 2004 to help prepare teachers for the Advanced Functions and Modeling course, introduced into the North Carolina curriculum beginning fall of 2004. One of the concurrent sessions in the week-long workshop highlighted Shodor’s Flyer tools contained in Interactivate. Hence, all participants had some training with the use of these tools.
Data Sources and Methods of Collection
The main data sources of interest include artifacts in the form of two lessons that were developed, implemented and then reflected upon by each participant. Lessons were chosen as the central data source because lessons provide for an unobtrusive method of gathering data on how teachers choose to implement the Flyer tools viewed through the theoretical framework. The context of data collection therefore took place in a natural, realistic setting for the teachers.
To provide additional context and clarification on the lessons, two other sources of subsidiary data were collected in the form of an initial, in-person interview between the researcher and participant and a phone based exit interview. The two supplementary data sources provided triangulation (Merriam, 1998; Stake, 1995), a qualitative research method in which data is collected and analyzed concurrently to assist in checking for consistency and redundancy in patterns that the researcher notices throughout the data. A description of the data sources is presented, followed by an explanation of how the data were analyzed in relation to each other.
Initial Interview
The researcher traveled to each participant’s school to conduct the interview during October 2006. Each interview was digitally video recorded and later transcribed. The in-person interview also helped to establish rapport and trust between the researcher and participants. The interviews took place in thirty to forty-five minutes periods. Appendix B contains the interview questions.
Lesson Plan Artifacts
In order to compare lesson elements among participants, a lesson plan template was provided. The standardized lesson template provided consistency across lessons for the analysis. Elements of the template included: goals of the lesson; objectives; North Carolina Standard Course of Study objectives; prerequisite student knowledge;
preliminary preparation; materials; lesson description; anticipation of student thinking; assessment. As part of the template, teachers were asked to respond to reflection questions after implementing the lesson. See Appendix C for the lesson template.
The participants were given electronic copies of the template prior to the initial interview and hard copies at the time of the interview. The researcher reviewed the template with each participant at that time to explain the template and clarify expectations of what each element from the template should contain.
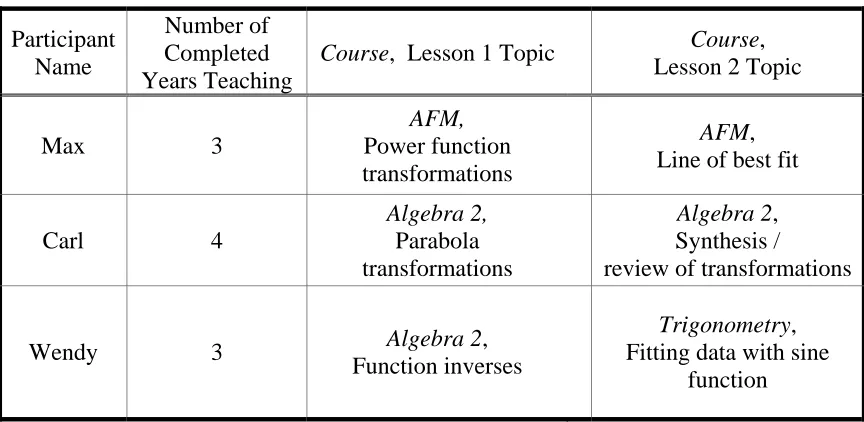
real-world phenomena. The participants had the option of choosing the instructional mode of tool use within the lesson; either as a demonstration tool using a single computer and projection device or in a computer lab. Table 2 presents the context for which data was collected by participant. Pseudonyms are used to protect the privacy of the participants.
Table 2: Data Collection Context Participant
Name
Number of Completed Years Teaching
Course, Lesson 1 Topic Course,
Lesson 2 Topic
Max 3
AFM,
Power function transformations
AFM, Line of best fit
Carl 4
Algebra 2,
Parabola transformations
Algebra 2, Synthesis / review of transformations
Wendy 3 Algebra 2,
Function inverses
Trigonometry, Fitting data with sine
function
Exit Interview
The exit interview consisted of both prepared items asked of all participants and items specific to each lesson developed during the review of the previous data sources. The researcher took written notes as participants provided responses. Although the exit interviews were not recorded, the researcher verbally read the participants’ responses back to the participant to ensure accuracy. Each interview lasted approximately thirty to forty-five minutes. See Appendix D for the exit interview questions.
Data Analysis Methodology
After examining a number of possible qualitative analysis design methods, the researcher chose to use Interpretive Analysis as described by Erickson (1986).
Interpretive analysis emphasizes the analysis of meaning perspectives of those persons on whom data is collected in regards to both formal and informal modes of social
organization (Erickson, 1986). A person’s meaning perspective is characterized by “the creation of meaningful interpretation of the physical and behavioral objects that surround them in the environment,” (p. 126).
To avoid confusion, it is important to emphasize that the variable of interest is the teachers’ meaning perspectives of the tool use for meeting learning goals, not the
students’ perspectives. Thus, the analysis examines the data to identify key aspects of how the teacher interprets the Flyer tools usefulness for teaching about functions and chooses to use the Flyer tools within the lesson design and implementation.
The interpretive methodology does not use a coding scheme in order to analyze the data, as qualitative methods often suggest. Rather, hypotheses are formed and revised in an ongoing, iterative manner as the data sources are examined numerous times.
Observations and patterns are noted as the data are collected and these observations are continually reviewed, as well as the raw data sources, throughout the collection process. The researcher is charged to seek and present both confirminganddisconfirming
evidence in order to continually refine or possibly reject the initial hypothesis (Erickson, 1986). Once these hypotheses are refined and accepted, they take the form of assertions
CHAPTER 4 RESULTS
This chapter provides a detailed analysis of the data. As noted in the previous chapter, the data are analyzed through the use of assertions. Each assertion is stated and then discussed in light of the research questions and literature base. A total of seven assertions were identified. To provide further context for the assertions, a restatement of the research question is provided.
• What is the nature of how teachers who instruct courses beyond Algebra I intend
to use the Flyer tools for the development of their students’ understanding of functions?
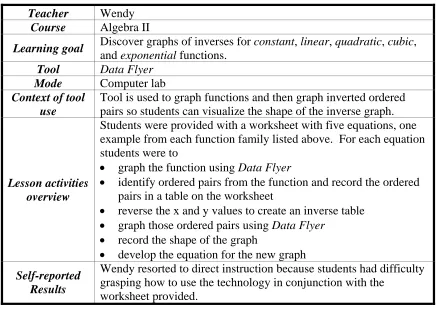
Table 3: Lesson on Inverse Functions
Teacher Wendy
Course Algebra II
Learning goal Discover graphs of inverses for constant, linear, quadratic, cubic,
and exponential functions.
Tool Data Flyer
Mode Computer lab
Context of tool use
Tool is used to graph functions and then graph inverted ordered pairs so students can visualize the shape of the inverse graph.
Lesson activities overview
Students were provided with a worksheet with five equations, one example from each function family listed above. For each equation students were to
• graph the function using Data Flyer
• identify ordered pairs from the function and record the ordered pairs in a table on the worksheet
• reverse the x and y values to create an inverse table
• graph those ordered pairs using Data Flyer • record the shape of the graph
• develop the equation for the new graph
Self-reported Results
Wendy resorted to direct instruction because students had difficulty grasping how to use the technology in conjunction with the
worksheet provided.
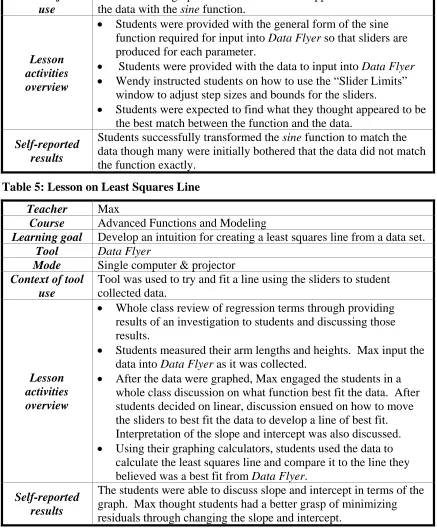
Table 4: Lesson on Sine Curve Transformations and Data Fitting
Teacher Wendy
Course Trigonometry
Learning goal Reinforce generalizations of parameter changes on the graph of the sine function.
Tool Data Flyer
Table 4 (continued)
Context of tool use
Tool is used to graph data with a sinusoidal appearance and model the data with the sine function.
Lesson activities overview
• Students were provided with the general form of the sine function required for input into Data Flyer so that sliders are produced for each parameter.
• Students were provided with the data to input into Data Flyer
• Wendy instructed students on how to use the “Slider Limits” window to adjust step sizes and bounds for the sliders.
• Students were expected to find what they thought appeared to be the best match between the function and the data.
Self-reported results
Students successfully transformed the sine function to match the data though many were initially bothered that the data did not match the function exactly.
Table 5: Lesson on Least Squares Line
Teacher Max
Course Advanced Functions and Modeling
Learning goal Develop an intuition for creating a least squares line from a data set.
Tool Data Flyer
Mode Single computer & projector
Context of tool use
Tool was used to try and fit a line using the sliders to student collected data.
Lesson activities overview
• Whole class review of regression terms through providing results of an investigation to students and discussing those results.
• Students measured their arm lengths and heights. Max input the data into Data Flyer as it was collected.
• After the data were graphed, Max engaged the students in a whole class discussion on what function best fit the data. After students decided on linear, discussion ensued on how to move the sliders to best fit the data to develop a line of best fit. Interpretation of the slope and intercept was also discussed.
• Using their graphing calculators, students used the data to calculate the least squares line and compare it to the line they believed was a best fit from Data Flyer.
Self-reported results
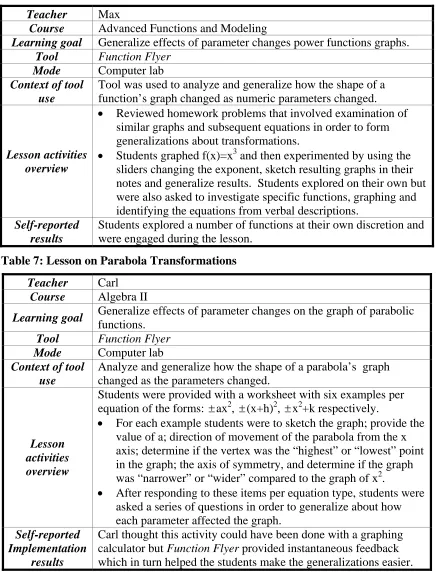
Table 6: Lesson on Power Function Transformations
Teacher Max
Course Advanced Functions and Modeling
Learning goal Generalize effects of parameter changes power functions graphs.
Tool Function Flyer
Mode Computer lab
Context of tool use
Tool was used to analyze and generalize how the shape of a function’s graph changed as numeric parameters changed.
Lesson activities overview
• Reviewed homework problems that involved examination of similar graphs and subsequent equations in order to form generalizations about transformations.
• Students graphed f(x)=x3 and then experimented by using the sliders changing the exponent, sketch resulting graphs in their notes and generalize results. Students explored on their own but were also asked to investigate specific functions, graphing and identifying the equations from verbal descriptions.
Self-reported results
Students explored a number of functions at their own discretion and were engaged during the lesson.
Table 7: Lesson on Parabola Transformations
Teacher Carl
Course Algebra II
Learning goal Generalize effects of parameter changes on the graph of parabolic
functions.
Tool Function Flyer
Mode Computer lab
Context of tool use
Analyze and generalize how the shape of a parabola’s graph changed as the parameters changed.
Lesson activities overview
Students were provided with a worksheet with six examples per equation of the forms: ±ax2, ±(x+h)2, ±x2+k respectively.
• For each example students were to sketch the graph; provide the value of a; direction of movement of the parabola from the x axis; determine if the vertex was the “highest” or “lowest” point in the graph; the axis of symmetry, and determine if the graph was “narrower” or “wider” compared to the graph of x2.
• After responding to these items per equation type, students were asked a series of questions in order to generalize about how each parameter affected the graph.
Self-reported Implementation
results
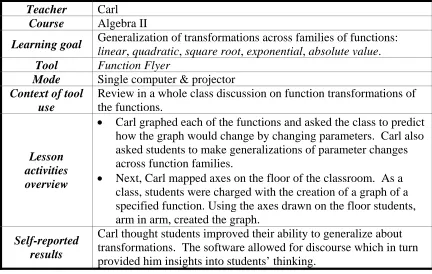
Table 8: Lesson on Transformations across Function Families
Teacher Carl
Course Algebra II
Learning goal Generalization of transformations across families of functions: linear, quadratic, square root, exponential, absolute value.
Tool Function Flyer
Mode Single computer & projector
Context of tool use
Review in a whole class discussion on function transformations of the functions.
Lesson activities overview
• Carl graphed each of the functions and asked the class to predict how the graph would change by changing parameters. Carl also asked students to make generalizations of parameter changes across function families.
• Next, Carl mapped axes on the floor of the classroom. As a class, students were charged with the creation of a graph of a specified function. Using the axes drawn on the floor students, arm in arm, created the graph.
Self-reported results
Carl thought students improved their ability to generalize about transformations. The software allowed for discourse which in turn provided him insights into students’ thinking.
Assertions
For the reader’s reference and summary of findings, the following list contains the seven assertions identified through the data analysis. Each assertion is then subsequently discussed in further detail.
Assertion #1 Teachers used the Flyer tools in their individual lessons in a manner consistent with both their own personal overall learning goals for functions within the course and in line with curriculum expectations.
Assertion #2 Teachers believed learning goals of the lessons were met when students understood the purpose of using the Flyer tools within the context of the lesson.
Assertion #3 The concept image of a function that teachers intended to develop through these lessons aligns with the historical definition relating two variables by an equation.
Assertion #5 Teachers used the Flyer tools in a manner such that a) permitted an inversion of the Action / Process / Object sequencing encouraging students to manipulate function as object externally via the software yet b) did not require students to internalize function as an object conception.
Assertion #6 Lessons facilitated neither versatile nor adaptable thinking in regards to understanding of function as process and object.
Assertion #7 Teachers did not always utilize features in the Flyer tools that directly related to their learning goals.
Each assertion is presented individually followed by a discussion justifying and expanding its content. Evidence is drawn from each of the three teacher’s interviews, lessons, and reflections.
Assertion #1
Teachers used the Flyer tools in their individual lessons in a manner consistent with both their own personal overall learning goals for functions within the course and in line with curriculum expectations.
Teachers designed lessons seemingly consistent with their own teaching goals as well as expectations put forth by the North Carolina Department of Public Instruction for the study of functions. The North Carolina Department of Public Instruction has
curriculum documents for courses offered in the public schools of North Carolina. These documents are collectively known as the North Carolina Standard Course of Study
(NCSCoS).
Teachers discussed teaching goals on the study of functions for students in general as well as specific to the course for which they developed the lessons during the initial interview. As part of the lesson plan template, teachers were also asked to identify their objectives and the objectives that would be addressed from the NCSCoS. In
the lesson, the required North Carolina curricula objectives, and their personal teaching goals.
Regarding the NCSCoS, Wendy and Max completely aligned their lesson activities to meet these objectives and Carl addressed supporting knowledge needed to meet the objectives. Table 9 displays each lesson with the stated NCSCoS objectives and a description of how the lesson met the objective with the use of the Flyer tools.
Table 9: Lessons aligned by NCSCoS
Lesson /
Teacher NCSCoS Objective
How lesson used Flyer tools to meet objectives Inverses /
Wendy
2.01 Use the composition and inverse of functions to model and solve problems; justify results.
Students were required to use Data Flyer to
investigate inverses of functions and solve problems relating to generalizing about how to find a function’s inverse.
Sine / Wendy
1.01 Create and use calculator-generated models of linear, polynomial, exponential, trigonometric, power, and logarithmic
functions of bivariate data to solve problems. 2.04 Use trigonometric (sine, cosine)
functions to model and solve problems; justify results.
b. Create and identify transformations with respect to period, amplitude, and vertical and horizontal shifts.
Students were required to model bivariate data using
Table 9 (continued)
Least Squares / Max
1.01 Create and use calculator-generated models of linear, polynomial, exponential, trigonometric, power, and logarithmic
functions of bivariate data to solve problems. a. Interpret the constants, coefficients, and
bases in the context of the data. b. Check models for goodness-of-fit; use
the most appropriate model to draw conclusions and make predictions.
Students were required to use Data Flyer by creating a linear model to fit bivariate data collected in class and interpret slope and intercept of their linear model. They also used goodness of fit by
comparing the fit from the calculator generated model and the model developed using Data Flyer.
Power / Max
2.03 Use power functions to model and solve problems; justify results.
a. Solve using tables, graphs, and algebraic properties.
b. Interpret the constants, coefficients, and bases in the context of the problem.
With Function Flyer, students were required to investigate power
functions in graphical and algebraic forms and generalize about the behavior of constants and coefficients through the use of the slider bars.
Parabola/ Carl(see Footnote 2)
2.01 Write the equations in standard form of circles and parabolas; graph.
3.05 Use quadratic equations and inequalities to solve problems.
3.06 Find and interpret the maximum and minimum values and the intercepts of a quadratic function.
The secondary objectives are:
3.01 Describe graphically, algebraically and verbally real-world phenomena as functions; identify the independent and dependent variables.
3.03 Graph relations and functions and find the zeros of functions.
With Function Flyer
Table 9 (continued)
Function Families/ Carl (see Footnote 2)
3.01 Describe graphically, algebraically and verbally real-world phenomena as functions; identify the independent and dependent variables.
The secondary objectives are:
3.03 Graph relations and functions and find the zeros of functions.
3.15 Write and graph exponential functions of the form f(x) = a bx.
Students were required to verbally describe and generalize about a variety of functions and their transformations through the use of the Function Flyer tool in graphical and algebraic forms including exponential functions.
In comparing the data sources by teacher, there is also a consistency between what the teacher believes students should learn about functions in the course and the lessons they developed. During the initial interview teachers were asked, “What should students understand about functions by the time they finish this course?” In comparing the data from the initial interviews and then examining the implementation of the software within the lessons, teachers consistently used the Flyer tools in a way that matched with their teaching goals. Table 10 summarizes teacher responses to the question by course, along with a description of how the software was used in that lesson.
Table 10: Summary learning goals about functions by course and teacher compared to implementation of software for the respective lessons.
Teacher
Course
Key aspects students should know about functions after this course
Lesson: Description of
software use Wendy
Alg II
• “…correlations between those different representations but a lot of times we don’t have time to focus on that… We’re
really pushed [by the End of Course
exam].” (see Footnote 3)
• “…how to translate any type of function. At least translate, and if they can stretch,
that would be even better!”
Inverses: Discover several functions’ inverse
graphs and equations through attempted translations of original
graphs and examining tables of values using