Report No. 391
THE EFFICACY OF STARTER FERTILIZER PHOSPHORUS FOR CORN AND COTTON PRODUCTION ON SOILS TESTING VERY HIGH FOR
PHOSPHORUS By
Deanna L. Osmond1, Rory Maguire1, Amy Johnson1, and David Hardy2
1
College of Agriculture & Life Sciences Department of Soil Science
North Carolina State University Raleigh, North Carolina
2
Raleigh, North Carolina NCDA&CS
UNC-WRRI-391
THE EFFICACY OF STARTER FERTILIZER PHOSPHORUS FOR CORN AND COTTON PRODUCTION ON SOILS TESTING VERY HIGH FOR PHOSPHORUS
Deanna L. Osmond, Rory Maguire, Amy Johnson Department of Soil Science
NC State University Raleigh, North Carolina
David Hardy NCDA&CS Raleigh, North Carolina
The research on which this report is based was supported in part by funds provided by the North Carolina Water Quality Workgroup Initiative. Contents of the publication do not necessarily reflect the views and policies of the State of North Carolina or the Department of Environmental and Natural Resources, nor does mention of trade names or commercial products constitute their endorsement by the State of North Carolina
The research on which this report is based was supported in part by funds provided by the Water Resources Research Institute of The University of North Carolina (WRRI). Contents of the publication do not necessarily reflect the views and policies of the WRRI, nor does mention of trade names of commercial products constitute their endorsement by the WRRI or the State of North Carolina.
This report fulfills the requirements for a project completion report of the Water Resources Research Institute of The University of North Carolina. The authors are solely responsible for the content and completeness of the report.
WRRI Project 50362 DENR Contract AE04001
ACKNOWLEDGEMENTS
TABLE OF CONTENTS
LIST OF TABLES AND FIGURES ...4
EXECUTIVE SUMMARY ...8
INTRODUCTION ...9
PURPOSE AND GOALS ... 12
METHODOLOGY ... 13
RESULTS ... 16
Crop Yield ... 17
Plant Population... 24
Plant Height ... 27
Color Index ... 30
Tissue N and P... 34
Days to Corn Silking and to Early Cotton Bloom... 40
Number of Nodes ... 43
CONCLUSIONS ... 48
BUDGET ... 51
REFERENCES ... 52
APPENDIX A Treatment and Regional Comparisons for Crop Parameters When Control Plots Were Included in Statistical Analysis ... 54
APPENDIX B Location and Region Effects of Statistical Analysis Performed on Corn and Cotton Plots ... 75
APPENDIX C Fertilizer Applications, Yield and Soil Test P by Region ... 76
LIST OF TABLES AND FIGURES
FIGURES Yield
Fig. 1. Mean corn and cotton yields from all study locations ... 18
Fig. 2. Regional comparisons of mean corn and cotton yields ... 18
Fig. 3. Mean corn yield in Coastal Plain counties ... 20
Fig. 4. Mean corn yield in Mountain and Piedmont counties... 20
Fig. 5. Mean cotton yield in Coastal Plain and Piedmont counties ... 21
Fig. 6. Comparison of corn yield and soil test P of two different soil types in Beaufort County ... 23
Plant Population Fig. 7. Mean corn and cotton populations from all study locations ... 25
Fig. 8. Regional comparisons of mean corn and cotton plant populations ... 25
Fig 9. Mean plant population of corn plots in Coastal Plain counties ... 26
Fig. 10. Mean plant populations of corn in Mountain and Piedmont counties... 26
Fig. 11. Mean plant populations of cotton plants in Coastal Plain and Piedmont counties ... 27
Plant Height Fig. 12. Mean heights of corn and cotton plants from all study locations ... 28
Fig. 13. Regional comparisons of mean corn and cotton plant heights ... 28
Fig. 14. Mean plant height of corn in Coastal Plain counties ... 29
Fig. 15. Mean plant height of corn plants in Mountain and Piedmont counties ... 29
Fig. 16. Mean plant height of cotton plants in Coastal Plain and Piedmont counties ... 30
Color Index Fig. 17. Mean color index values of corn and cotton from all study locations ... 31
Fig. 18. Regional comparisons of mean color index values for corn and cotton ... 32
Fig. 19. Mean color index values for corn in Coastal Plain counties ... 32
Fig. 20. Mean color index value of corn plants in Mountain and Piedmont counties ... 33
Fig. 21. Mean color index values of cotton plants in Coastal Plain and Piedmont counties ... 33
Tissue N and P Fig. 22. Mean tissue N content of corn and cotton plants from all study locations ... 35
Fig. 23. Mean tissue P content of corn and cotton plants from all study locations ... 35
Fig. 24. Regional comparisons of mean tissue N content of corn and cotton plants ... 36
Fig. 25. Regional comparisons of mean tissue P content of corn and cotton plants ... 36
Fig. 26. Mean plant tissue N of corn plants in Coastal Plain counties ... 37
Fig. 27. Mean plant tissue N of corn plants in Mountain and Piedmont counties ... 37
Fig. 28. Mean plant tissue N of cotton plants in Coastal Plain and Piedmont counties ... 38
Fig. 29. Mean plant tissue P of corn plants in Coastal Plain counties ... 38
Fig. 30. Mean plant tissue P of corn plants in Mountain and Piedmont counties ... 39
Days to Silking or Early Bloom
Fig. 32. Mean number of days to corn silking and early cotton bloom from all study
locations ... 40
Fig. 33. Regional comparisons of days to corn silking and early cotton bloom ... 41
Fig. 34. Mean number of days to silking of corn in Coastal Plain counties ... 41
Fig. 35. Mean number of days to silking of corn plants in Mountain and Piedmont counties ... 42
Fig. 36. Mean number of days to early bloom of cotton plants in Coastal Plain counties ... 42
Number of Nodes Fig. 37. Mean number of nodes at first bloom, total nodes, and nodes above white flower of cotton plants from all study locations ... 44
Fig. 38. Regional comparisons of mean number of nodes at first bloom, total nodes and nodes above white flower of cotton plants ... 44
Fig. 39. Mean number of nodes at first bloom of cotton plants in Coastal Plain counties ... 45
Fig. 40. Mean number of total nodes of cotton plants in Coastal Plain counties ... 45
Fig. 41. Mean number of nodes above white flower of cotton plants in Coastal Plain counties ... 46
Soil Test P Fig. 42. Treatment differences in mean soil test P levels for two sample populations of corn and cotton... 47
Fig. 43. Regional differences in mean soil test P levels for two sample populations of corn and cotton ... 47
Appendix A Fig. A1. Mean crop corn and cotton yields from all study locations ... 54
Fig. A2. Mean color index values of corn and cotton from all study locations ... 54
Fig. A3. Mean corn and cotton populations from all study locations ... 55
Fig. A4. Mean heights of corn and cotton plants from all study locations ... 55
Fig. A5. Mean tissue N content of corn and cotton plants from all study locations ... 56
Fig. A6. Mean tissue P content of corn and cotton plants from all study locations ... 56
Fig. A7. Mean number of days to corn silking and early cotton bloom from all study locations ... 57
Fig. A8. Mean number of nodes at first bloom, total nodes, and nodes above white flower of cotton plants from all study locations ... 57
Fig. A9. Regional comparisons of mean corn and cotton yields ... 58
Fig. A10. Regional comparisons of mean color index values for corn and cotton ... 58
Fig. A11. Regional comparisons of mean corn and cotton plant populations ... 59
Fig. A12. Regional comparisons of mean corn and cotton plant heights... 59
Fig. A13. Regional comparisons of mean tissue N content of corn and cotton plants ... 60
Fig. A14. Regional comparisons of mean tissue P content of corn and cotton plants ... 60
Fig. A15. Regional comparisons of days to corn silking and early cotton bloom ... 61
Fig. A16. Regional comparisons of mean number of nodes at first bloom, total nodes, and nodes above white flower of cotton plants ... 61
Fig. A18. Mean color index values for corn in Coastal Plain counties ... 62
Fig. A19. Mean plant population of corn plots in Coastal Plain counties ... 63
Fig. A20. Mean plant height of corn plants in Coastal Plain counties ... 63
Fig. A21. Mean plant tissue N of corn plants in Coastal Plain counties ... 64
Fig. A22. Mean plant tissue P of corn plants in Coastal Plain counties ... 64
Fig. A23. Mean number of days to silking of corn in Coastal Plain counties ... 65
Fig. A24. Mean corn yield in Mountain and Piedmont counties ... 65
Fig. A25. Mean color index value of corn plants in Mountain and Piedmont counties ... 66
Fig. A26. Mean plant populations of corn in Mountain and Piedmont counties ... 66
Fig. A27. Mean plant height of corn plants in Mountain and Piedmont counties ... 67
Fig. A28. Mean plant tissue N of corn plants in Mountain and Piedmont counties ... 67
Fig. A29. Mean plant tissue P of corn plants in Mountain and Piedmont counties ... 68
Fig. A30. Mean number of days to silking of corn plants in Mountain and Piedmont counties ... 68
Fig. A31. Mean cotton yield in Coastal Plain and Piedmont counties ... 69
Fig. A32. Mean color index values of cotton plants in Coastal Plain and Piedmont counties ... 69
Fig. A33. Mean plant populations of cotton plants in Coastal Plain and Piedmont counties ... 70
Fig. A34. Mean plant height of cotton plants in Coastal Plain and Piedmont counties ... 70
Fig. A35. Mean plant tissue N of cotton plants in Coastal Plain and Piedmont counties ... 71
Fig. A36. Mean plant tissue P of cotton plants in Coastal Plain and Piedmont counties ... 71
Fig. A37. Mean number of days to early bloom of cotton plants in Coastal Plain counties ... 72
Fig. A38. Mean number of nodes at first bloom of cotton plants in Coastal Plain counties ... 72
Fig. A39. Mean number of total nodes of cotton plants in Coastal Plain counties... 73
Fig. A40. Mean number of nodes above white flower of cotton plants in Coastal Plain counties ... 73
TABLES Yield
Table 1. Results of treatment comparisons for corn and cotton when analyzing each
region individually ... 19
Table 2. Differences in treatments and soil type for corn growth parameters of Beaufort County sites... 23
Table 3. Results of treatment comparisons for Beaufort County corn plots having either a mineral soil type or an organic soil type, as classified by the NCDA&CS Soil Testing Laboratory ... 24
Appendix B Table B1. Results of variability due to location and region ... 75
Appendix C Table C1. Corn in Coastal Plain counties ... 76
Table C2. Corn in Piedmont and Mountain counties ... 77
Table C3. Cotton in Coastal Plain and Piedmont counties ... 78
Appendix D Table D1. Beaufort County ... 79
Table D2. Buncombe County ... 81
Table D3. Caldwell County ... 81
Table D4. Cherokee County ... 82
Table D5. Chowan County ... 82
Table D6. Craven County ... 83
Table D7. Edgecombe County ... 84
Table D8. Haywood County ... 85
Table D9. Henderson County ... 86
Table D10. Lenoir County ... 87
Table D11. Lincoln County ... 87
Table D12. Onslow County ... 88
Table D13. Pasquotank County ... 88
Table D14. Union County ... 89
EXECUTIVE SUMMARY
Phosphorus from agricultural lands poses a problem to North Carolina’s water resources. In fiscal year 2003, over 48% of soil samples submitted to the NCDA&CS soil testing laboratory from around the state, tested very high in soil P (>100 P-Index). This result is a concern because as soil test P increases, the risk for off-site losses of P increases, either through erosion, soluble P runoff or leaching. When soils test above a high soil test P level (P-Index = 50-100), no yield response from fertilizer additions is expected. Therefore, yield should not be negatively affected by excluding starter-P on soils having excessive P. Studies in New York, Delaware, and Iowa have shown this assessment to be true. However, there has been no study of the effects of starter-P fertilizer on soils with very high P-status in North Carolina. Therefore, we undertook a study to determine if the use of starter-P fertilizer would affect the growth of corn and cotton on different soils in North Carolina having very high soil test P. If farmers do not need to apply starter-P, the amount of excess agricultural P that is vulnerable to loss can potentially be reduced. Overall, our results indicate that treatment differences existed for only a few, relatively
INTRODUCTION
Off-site losses of phosphorus (P) from agricultural activities into water resources are of concern throughout North Carolina. Specific watersheds (Chicod Creek) and river basins, such as the Tar-Pamlico, have rules to maintain or reduce P losses. As soil test P increases, the risk for off-site loss of P increases, either through erosion, soluble P runoff or leaching (Sharpley et al., 1994). Recently, the NC Department of Environment and Natural Resources (NCDENR) recognized this concern and partnered with NC State University and the Natural Resources Conservation Service (NRCS) to develop the NC Phosphorus Loss Assessment Tool (PLAT), which estimates potential off-site losses of P. Data from agricultural fields across North
Carolina showed increased risk of P loss with increasing soil test P. Eight percent of fields with a soil test P-Index (PI) of 100-200 had a High or Very High PLAT rating, whereas sites with a PI in excess of 200 were found on 31% of the fields with a High (21%) or Very High (10%) PLAT rating (Johnson et al., 2005). For reference purposes, it is important to recognize that one PI unit is equivalent to 4.9 lb P2O5 ac-1.
The Agronomic Division- NCDA&CS analyzes approximately 250,000 soil samples every year. Approximately 85% of these samples are agricultural soils. In fiscal year 2003, over 48% of soil samples, state-wide, tested very high in soil P (>100 PI) (NCDA&CS, 2003). No yield response from fertilizer additions is expected for soils testing above a high soil test P level (PI = 50-100). As long as starter fertilizers are used, soil-test P levels will not be reduced from these
very high index values (Kamprath, 1999).
starter fertilizers ranges from 10 to 40 lb P2O5 ac-1 (Zublena, 1997a). The amount of P that most
agronomic crops remove, however, is generally no more than 40 lb P2O5 ac-1 (Zublena,
1997b). As a consequence, P levels will continue to remain very high in these soils. This was confirmed through research in North Carolina by a 15-year starter-P fertilizer study on soils with
very high PI. At the end of 15 years, the soil test P level remained the same for those soils receiving yearly applications of 40 lb P2O5 ac-1, whereas when no starter was applied, soil P
levels declined (Kamprath, 1999). There were no yield differences. Even on soils with high P-fixing ability (Piedmont soils), 8 ppm of extractable P was sufficient and starter-P did not increase yields (Kamprath, 1967).
Recently, starter-P fertilizer was evaluated on high-P soils in New York over a three-year time period. Trials were conducted on 62 farm fields and 9 research stations to determine if band-applications of fertilizer P were needed for optimum corn silage yield and quality on fields testing high or very high in soil test P. Results indicated that for sites that test high in P and have no manure applications planned for the season, no yield or quality penalty is expected when P-starter levels are reduced below 25 lbs P2O5 ac-1. On sites that test very high in P or when
manure is applied to high testing sites, there is a low probability of a starter response and P could be eliminated from the starter without a yield or quality penalty (Ketterings et al., 2004).
Recent research in Delaware on the use of starter fertilizer has shown some benefits of nitrogen (N) in starter fertilizers but results for P are inconclusive to date. Binford et al. (2004) conducted a number of strip trials with corn on high-P soils from 2000 to 2002, with the
recover costs. The starter fertilizer strips yielded an extra 7 bu ac-1 on average, but the study was not able to identify whether the increased yield was due to applied N or P.
In separate plot studies, Binford et al. (2003) examined 19 combinations of starter fertilizer placements and types at three locations, but starter fertilizer did not lead to any significant increases in yield at any of the sites due to a high degree of variability. Although the results of these studies are inconclusive, they show the importance in evaluating the need for starter fertilizers with N, or with N and P. If it can be shown that starter fertilizer N but not P is necessary, this will lead to economic benefits to the farmer, in addition to alleviating surplus P additions to agricultural soils and potential environmental problems.
Bordoli and Mallarino (1998), working in Iowa, showed that starter-P fertilizer did not increase yields except when soil test P measured low or very low. Three different starter-P placement treatments were used (broadcast, regular band, and deep band), but placement did not affect yields even when there was a response to the starter fertilizer. Based on results from across the United States, it appears that when soil test P measures at least high, there is no yield response of crops to starter-P fertilizer.
PURPOSE AND GOALS
METHODOLOGY
Our goal was to obtain approximately 40 test sites for corn (20 Coastal Plain, 10 Piedmont, and 10 Mountain) and 30 sites for cotton (20 Coastal Plain and 10 Piedmont). In reality, we were only able to sample from 27 corn sites (13 Coastal Plain, 2 Piedmont, and 10 Mountain) and 7 cotton sites (6 Coastal Plain and 1 Piedmont). Sampling in all three physiographic regions ensured that a range of soil types as well as different climates would be included. Either NC Cooperative extension agents and/or NCDA&CS regional agronomists established the test plots. Collaborators were instructed to locate fields testing greater than 100 PI for mineral soils or greater than 80 PI for organic soils, although this did not always happen because field soil test averages were used to select the fields and soil test values within the smaller plots may be very different than the field average. Approximately seven sites had plots testing below this
requirement. Once a site was selected, the predominant soil-mapping unit was identified. Each treatment plot was approximately 0.10 ac (~4,500 square feet).
Treatments were randomly assigned to receive starter fertilizer containing both N and P (30 lb of both N and P2O5 ac-1) or receive only starter-N fertilizer without P (30 lb N ac-1). These two
On the day of planting, soil samples were taken from each plot from the inter-row space, unless P fertilizer had already been banded or dribbled. In this case, a sample was taken
elsewhere in the study plot. Soil samples were sent to the NCDA&CS Agronomic Division, Soil Testing Laboratory for analysis of soil test P.
The following data was collected from each plot during the growing season:
• Early plant height, taken at 3 weeks after germination; corn plants were measured from the ground to the whorl while cotton plants were measured from the cotyledon to the terminal.
• Early season plant tissue; whole plant at 10 to 12- inch height for corn, and most fully developed leaf at approximately the 8-leaf stage for cotton.
• Relative color index at the same time that plant height was measured, using the following scale: dark green = 4, green = 3, light green = 2, yellow or purple = 1.
• Days to silking (corn); Days to early bloom (cotton), when there are 5-6 white blooms per 25 foot row or within 5-7 days after first bloom.
• Number of nodes at first bloom (cotton); Number of nodes above white flower in August and total nodes (cotton).
• Yield; cotton yield was reported after ginning.
Yield, plant height, relative color index, days to silking, number of nodes and nodes above white flower were consistently taken from plants contained in a10 feet long section in the two middle rows of the study plot. Tissue samples were taken outside the sampling plot and they were sent to the NCDA&CS Agronomic Division, Plant Tissue Laboratory.
analyzed together with a location effect included to account for site variability; (2) locations were grouped into physiographic regions and a region effect included to account for site
RESULTS
Although a check treatment was not specified in the experimental design of this study, some collaborators chose to include one. Check plots, however, were not standardized as these were not part of the protocol. (See Appendix C for more information.) check plots for corn had no P applied and the N ranged from 0 lb N ac-1 (Craven County) to 238 lb N ac-1 (Lincoln County). Similarly for cotton, no P was applied to the check plots but N was either 0 lb N ac-1 (Lenoir County) or 20 lb N ac-1 (Edgecombe County). For many parameters, significant differences were seen when the check plots were included, with the check treatment being much lower in a given parameter than either the ‘N only’ or ‘N+P’ treatments. However, because the main focus of this study was to evaluate whether the use of P-starter fertilizer affected crop growth, given similar applications of N fertilizer, the control plots were not included in the statistical analysis nor was a discussion of control plot effects. For an evaluation of treatment differences when check plots were included, see Appendix I.
In theory, study plots were to have a soil test P of >100 PI. In practice, however, a number of sites were selected that did not fit this criterion. Because our hypothesis was that P starter fertilizer does not significantly affect crop growth parameters when soil test P is greater than 100 PI, statistical analysis was performed including only those plots with soil P level >100 PI. In addition, all study plots were analyzed, regardless of PI level. Results of both analyses are shown in some figures. If not stated, figures contain results of statistical analysis performed only on plots having a soil test P >100 PI.
differences due to physiographic region by grouping all locations into one of three regions, Coastal Plain, Piedmont or Mountain. Specific parameters in which location or region effects occurred are reported in Appendix B.
Crop Yield
When analyzing all plot locations together, no significant differences in yield existed between the two fertilizer treatments for either corn or cotton (Fig. 1). When study locations were
grouped into physiographic regions, yield was significantly different among regions for both corn and cotton (Fig. 2), with corn yield being greater in the Mountains than either the Coastal Plain or Piedmont, and cotton yield being greater in the Coastal Plain than in the Piedmont. Examining treatment differences within each region, a significant treatment difference for corn plots in the Coastal Plain was apparent (Table 1). In this case, yield in the ‘N+P’ treatment was greater than yield in the ‘N only” treatment. In an effort to inspect this result further, individual counties were analyzed for treatment differences (Figs. 3-5). Considering both corn and cotton, the only county in which yield experienced a significant treatment effect was Beaufort County, with plots receiving both N- and P-starter having a greater corn yield than plots receiving only N-starter fertilizer (Fig. 3). Please note that P was mistakenly applied to the N-only treatment in Wilson County. Thus the comparison for Wilson County is actually between different rates of starter P; the N+P treatment had 50 lb P2O5 ac-1 added at planting, while the N treatment had 20
0 200 400 600 800 1000 1200
All ≥ 100 PI All ≥ 100 PI
Y
ield
N+P N Only
NS
NS
bu/ac
lbs lint/ac
NS
NS
Corn Cotton
Fig. 1. Mean crop corn and cotton yields from all study locations.
0 200 400 600 800 1000 1200 1400
Coastal Plain Piedmont Mountain Coastal Plain Piedmont
Y
ie
ld
N+P N only
bu/ac
lbs lint/ac
Corn Cotton
**
***
Table 1. Results of treatment comparisons for corn and cotton when analyzing each region individually. Plots below a P Index of 100 were not included in analysis results reported here.
Parameter
Corn Cotton
Region
Coastal
Plain Piedmont Mountain
Coastal
Plain Piedmont
Yield
*
NS NS NS NSPlant
Population
*
NS NS NS NSPlant Height
***
NS NS NS NSTissue N NS NS NS NS NS
Tissue P NS NS NS NS NS
Color Index
***
NS NS NS NSSTP NS
*
NS NS NSDays to Silking NS NS NS n/a n/a
Days to Early
Bloom n/a n/a n/a NS --
Nodes at First
Bloom n/a n/a n/a
**
--Total Nodes n/a n/a n/a NS NS
Nodes Above
White Flower n/a n/a n/a NS NS
0 50 100 150 200 250 300
Beaufort Craven Edgecombe Onslow Pasquotank Wilson
Y
ie
ld, B
u/a
c
N+P
N only
*
NS NSNS
NS NS
Fig. 3. Mean corn yield in Coastal Plain counties.
0 50 100 150 200 250 300 350
Buncombe Cherokee Haywood Henderson Caldwell Lincoln
Y
ield
, Bu
/ac
N+P
N only NS
NS NS
NS NS
NS
0 200 400 600 800 1,000 1,200 1,400 1,600
Beaufort Chowan Edgecombe Lenoir Union
Y
ie
ld, lbs
lint
/a
c
N+P
N only
NS
NS
NS NS
NS
Fig. 5. Mean cotton yield in Coastal Plain and Piedmont counties.
Some of the study sites in Beaufort County were located on shallow organic soils which are thought to release more P over time than mineral soils (Daughtrey et al., 1973). Thus, the soil test level at which no beneficial effect of further P additions is experienced for these unique soils was determined to be 80 PI. Because two fundamentally different soil types occur on study plots in this county, mineral and organic, and because corn sites from Beaufort County represent the only treatment difference seen for crop yield, we investigated whether differences in soil type could explain the differences seen between the two treatments.
provided by the NCDA&CS Soil Testing Laboratory (STL). In this case, three of the seven locations for corn were either shallow organics or mineral-organics or a combination thereof, as opposed to only one location when using the much broader soil mapping unit classification. Differentiation of mineral soils and mineral organic or shallow organic soils is probably more accurately done by the STL, as their determination was based on a soil sample taken directly from the study plot whereas a soil survey may generalize over a large area.
Table 2. Differences in treatments and soil type for corn growth parameters of Beaufort County sites. Comparisons were made within each soil type for (1) all plots regardless of PI value, and (2) only those plots with a P Index >100.
Parameter
Treatment Effect Soil Effect
Sample Population
All ≥100 PI All ≥100 PI
Yield
*
NS**
NSPlant Population NS NS
**
NSPlant Height NS NS NS NS
Tissue N NS NS NS NS
Tissue P NS NS NS NS
Color Index NS NS NS NS
STP NS NS
***
**
***, **, * correspond to statistical significance levels of P<0.0001, P<0.01, P<0.05, respectively. NS indicates no statistical significance was found.
0 20 40 60 80 100 120 140 160 180 200
Mineral Organic Mineral Organic
b
u
/a
c
o
r P
I
n
d
e
x
N+P N only
NS **
Yield
Soil Test P
Table 3. Results of treatment comparisons for Beaufort County corn plots having either a mineral soil type or an organic soil type, as classified by the NCDA&CS Soil Testing Laboratory. Comparisons were made within each soil type for (1) all plots regardless of PI value, and (2) only those plots with a P Index >100.
Parameter
Mineral Soils Organic Soils
Sample Population
All ≥100 PI All ≥100 PI
Yield NS N S NS NS
Plant Population NS NS NS NS
Plant Height
**
***
**
*
Tissue N NS NS NS NS
Tissue P NS NS NS NS
Color Index
**
***
NS NSSoil Test P NS NS NS NS
***, **, * correspond to statistical significance levels of P<0.0001, P<0.01, P<0.05, respectively. NS indicates no statistical significance was found.
Plant Population
0 5,000 10,000 15,000 20,000 25,000 30,000 35,000 40,000 45,000
All ≥ 100 PI All ≥ 100 PI
#
of P
la
nts
N+P
N only
NS
NS
NS
NS
Corn Cotton
Fig. 7. Mean corn and cotton populations from all study locations.
0 5,000 10,000 15,000 20,000 25,000 30,000 35,000 40,000
Coastal Plain Piedmont Mountain Coastal Plain Piedmont
#
of P
la
nts
N+P N only
Corn Cotton
NS
NS
0 5,000 10,000 15,000 20,000 25,000 30,000
Beaufort Craven Edgecombe Onslow Pasquotank Wilson
# o
f P
lan
ts/ac
N+P N only
NS
NS
NS NS
NS NS
Fig 9. Mean plant population of corn plots in Coastal Plain counties.
0 5,000 10,000 15,000 20,000 25,000 30,000
Buncombe Haywood Henderson Caldwell Lincoln
# o
f P
lan
ts/ac
N+P
N only NS
NS NS
NS NS
0 5,000 10,000 15,000 20,000 25,000 30,000 35,000 40,000 45,000 50,000
Beaufort Chowan Edgecombe Lenoir Union
# o
f P
lan
ts/ac
N+P N only
NS NS
NS
NS
NS
Fig. 11. Mean plant populations of cotton plants in Coastal Plain and Piedmont counties.
Plant Height
Statistical treatment differences existed for plant height on corn plots when all locations were analyzed together (Fig. 12). The ‘N + P’ treatment was significantly greater, in the case of both sample populations, than the ‘N only’ treatment. No appreciable regional differences were present (Fig. 13), although plant height was considerably greater in the ‘N+P’ treatment within the Coastal Plain locations on which corn was grown (Table 1). Examining individual counties, plots receiving both P-and N-starter fertilizer had greater plant heights in corn plots of Beaufort and Craven Counties (Figs. 14-16). No other counties had significant treatment differences with the exception of a treatment effect in Henderson County, with the ‘N+P’ treatment again
once again significantly greater in the ‘N+P’ treatment of both mineral soil and organic soil locations (Table 3).
0.0 2.0 4.0 6.0 8.0 10.0 12.0
All ≥ 100 PI All ≥ 100 PI
Heig
h
t, in
ch
es
N+P N only
NS
***
**
NS
Corn Cotton
Fig. 12. Mean heights of corn and cotton plants from all study locations.
0.0 2.0 4.0 6.0 8.0 10.0 12.0
Coastal Plain Piedmont Mountain Coastal Plain Piedmont
Heig
h
t, in
ch
es
N+P N only
Corn Cotton
NS NS
0 2 4 6 8 10 12
Beaufort Craven Edgecombe Onslow Pasquotank Wilson
Heig
h
t, in
ch
es
N+P N only
*** NS
NS
NS NS
**
Fig. 14. Mean plant height of corn in Coastal Plain counties.
0 2 4 6 8 10 12 14
Buncombe Cherokee Haywood Henderson Caldwell Lincoln
Heig
h
t, in
ch
es
N+P N only
NS
*
NS
NS
NS NS
0 2 4 6 8 10 12 14 16
Beaufort Chowan Edgecombe Lenoir Union
Heig
h
t, in
ch
es
N+P
N only
NS NS
NS
NS NS
Fig. 16. Mean plant height of cotton plants in Coastal Plain and Piedmont counties.
The measurement of plant height may be prone to certain biases. Plant height, as well as some of the other parameters, was most likely measured at slightly different growth stages at the study locations. A consideration of location was introduced into the statistical model in order to account for variation in soil types, climates, growing period, etc, but if measurements were not taken at consistent times within the growing cycle (at silking, for example) at each location, they may not be directly comparable. For an example of this, see Fig. 16. Therefore, it is difficult to make conclusions about the effect of the different treatments on plant height.
Color Index
regions (Fig. 18). In addition, within individual regions, the ‘N+P’ treatment performed better, in terms of plant color index, than did the ‘N only’ treatment in Coastal Plain sites (Table 1). In analyzing treatment differences in individual counties, sites in both Beaufort and Edgecombe County had higher color index values when both N- and P-starter were used as opposed to just N-starter (Figs. 19-21). Within Beaufort County, although a significant soil effect was not present for color index (Table 2), locations in the county that occurred on mineral soil types had a higher color index value from the ‘N+P’ treatment as well (Table 3). This effect was not evident in organic soil types.
Although it suffers from the same “temporal” bias as plant height and perhaps some of the other parameters, color index additionally experiences potential biases related to the subjectivity
0.0 0.5 1.0 1.5 2.0 2.5 3.0 3.5 4.0
All ≥ 100 PI All ≥ 100 PI
C
ol
or
I
nde
x
N+P
N only NS
***
***
NS
Cotton Corn
0.0 0.5 1.0 1.5 2.0 2.5 3.0 3.5 4.0 4.5
Coastal Plain Piedmont Mountain Coastal Plain Piedmont
C
ol
or
I
nde
x
N+P N only
Corn Cotton
*** ***
Fig. 18. Regional comparisons of mean color index values for corn and cotton
0 0.5 1 1.5 2 2.5 3 3.5 4 4.5
Beaufort Craven Edgecombe Wilson
C
ol
or
I
nde
x
N+P N only
**
NS
***
NS
0 0.5 1 1.5 2 2.5 3 3.5 4 4.5
Cherokee Caldwell Lincoln
C
ol
or
I
nde
x
N+P
N only
NS NS
NS
Fig. 20. Mean color index value of corn plants in Mountain and Piedmont counties.
0 0.5 1 1.5 2 2.5 3 3.5 4
Beaufort Chowan Edgecombe Lenoir Union
C
o
lo
r I
n
d
e
x
N+P N only
NS NS
NS NS
NS
of determining colors. The distinction of “green” versus “light green”, for example, is subject to different interpretations. Color index is the most subjective parameter that was measured. Therefore, it is felt that any inferences about treatment differences made based on color index would be questionable.
Tissue N and P
0.0 1.0 2.0 3.0 4.0 5.0 6.0
All ≥ 100 PI All ≥ 100 PI
% N
N+P
N only NS
NS
NS
NS
Corn Cotton
Fig. 22. Mean tissue N content of corn and cotton plants from all study locations.
0.29 0.30 0.31 0.32 0.33 0.34 0.35 0.36
All ≥ 100 PI All ≥ 100 PI
% P
N+P
N only
NS
NS
NS
NS
Corn Cotton
0.0 1.0 2.0 3.0 4.0 5.0 6.0
Coastal Plain Piedmont Mountain Coastal Plain Piedmont
% N
N+P N only
Corn Cotton
NS
***
Fig. 24. Regional comparisons of mean tissue N content of corn and cotton plants.
0.0 0.1 0.1 0.2 0.2 0.3 0.3 0.4 0.4 0.5
Coastal Plain Piedmont Mountain Coastal Plain Piedmont
% P
N+P N only
Corn Cotton
NS
***
0 1 2 3 4 5 6
Beaufort Craven Edgecombe Onslow Pasquotank Wilson
% N
N+P
N only
NS
NS
NS NS
NS
NS
Fig. 26. Mean plant tissue N of corn plants in Coastal Plain counties.
0 1 2 3 4 5 6
Buncombe Cherokee Haywood Henderson Caldwell Lincoln
% N
N+P N only
NS
NS NS
NS NS
NS
0 1 2 3 4 5 6 7
Chowan Edgecombe Lenoir Union
% N
N+P
N only
NS
NS NS
NS
Fig. 28. Mean plant tissue N of cotton plants in Coastal Plain and Piedmont counties.
0 0.1 0.2 0.3 0.4 0.5 0.6 0.7
Beaufort Craven Edgecombe Onslow Pasquotank Wilson
% P
N+P
N only
**
NSNS NS
NS NS
0 0.05 0.1 0.15 0.2 0.25 0.3 0.35 0.4 0.45
Buncombe Cherokee Haywood Henderson Caldwell Lincoln
% P
N+P N only
NS NS
NS
NS
NS
NS
Fig. 30. Mean plant tissue P of corn plants in Mountain and Piedmont counties.
0 0.05 0.1 0.15 0.2 0.25 0.3 0.35 0.4 0.45 0.5
Chowan Edgecombe Lenoir Union
% P
N+P N only
NS
NS NS
NS
Days to Corn Silking and Early Cotton Bloom
Neither days to silking in corn plants, nor days to early bloom in cotton plants, experienced significant treatment effects when all locations were considered in the analysis (Fig. 32). Regional comparisons showed that the Mountain region had a statistically greater number of days to corn silking than either the Piedmont or Coastal Plain regions, although this finding is most likely due to differences in growing season (Fig. 33). ‘Days to early bloom’ was not measured from cotton sites in Union County, and because this was the only Piedmont location of corn, differences due to region cannot be examined. No significant treatment differences were apparent within physiographic regions (Table 1). Figures 34 and 35 illustrate the lack of differences in ‘days to silking’ for each county with corn sites, and Figure 36 in ‘days to early bloom’ for each county with cotton sites.
66 67 68 69 70 71 72 73 74
All ≥ 100 PI All ≥ 100 PI
Days
N+P
N Only
To Silking
To Early Bloom NS
NS NS
NS
Corn Cotton
62 64 66 68 70 72 74 76
Coastal Plain Piedmont Mountain Coastal Plain
Days
N+P N only
To Silking
To Early Bloom
Corn Cotton
***
Fig. 33. Regional comparisons of days to corn silking and early cotton bloom.
56 58 60 62 64 66 68 70 72 74 76
Craven Edgecombe Wilson
Days
N+P
N only
NS
NS
NS
64 66 68 70 72 74 76 78
Buncombe Haywood Henderson Caldwell Lincoln
Days
N+P
N only
NS
NS
NS NS
NS
Fig. 35. Mean number of days to silking of corn plants in Mountain and Piedmont counties.
60 62 64 66 68 70 72 74 76
Beaufort Chowan Edgecombe Lenoir
Days
N+P N only
NS NS
NS
NS
Number of Nodes
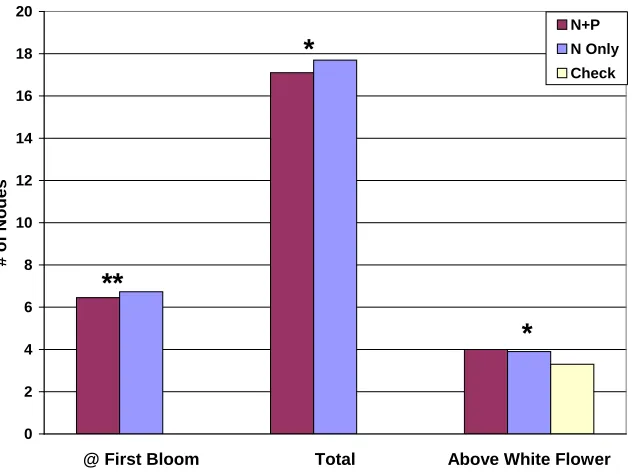
A significant treatment difference occurred for nodes at first bloom, while the treatment difference in number of total nodes was only significant when all sample locations were included (Fig. 37). No treatment difference in nodes above white flower was present. Nodes at first bloom presents somewhat of an anomaly relative to other parameters, as the ‘N only’ treatment performed “better”, in terms of cotton production, than the ‘N+P’ treatment. This was the only instance of the treatment receiving only N-starter surpassed the ‘N+P’ treatment in terms of plant health. The reason for this result is unknown. In terms of regional comparisons, no region effect was present for any of the node parameters (Fig. 38) but the number of nodes at first bloom experienced a treatment difference within Coastal Plain locations (Table 1); again the ‘N only’ treatment was significantly higher than the ‘N+P’ treatment. The significantly greater number of nodes at first bloom that occurred when analyzing all cotton plots together, did not arise in any individual counties, nor did any other parameter (Figs. 39-41). None of the counties that had cotton plots consisted of more than one location; this lack of replication may be related to the scarcity of treatment differences found.
0 2 4 6 8 10 12 14 16 18 20
All ≥ 100 PI All ≥ 100 PI All ≥ 100 PI
# of N ode s N+P N Only ** * NS ** NS NS
@ First Bloom Total Above White Flower
Fig. 37. Mean number of nodes at first bloom, total nodes, and nodes above white flower of cotton plants from all study locations.
0 2 4 6 8 10 12 14 16 18 20
Coastal Plain Coastal Plain Piedmont Coastal Plain Piedmont
# of N ode s N+P N only
@ First Bloom Total Above White Flower
NS NS
0 2 4 6 8 10 12
Beaufort Chowan Lenoir
#
of N
ode
s
N+P
N only
NS NS
NS
Fig. 39. Mean number of nodes at first bloom of cotton plants in Coastal Plain counties.
14.5 15 15.5 16 16.5 17 17.5 18 18.5 19 19.5
Beaufort Chowan Lenoir Union
#
of N
ode
s
N+P N only
NS NS
NS
NS
0 1 2 3 4 5 6 7
Beaufort Chowan Edgecombe Lenoir Union
#
of N
ode
s
N+P N only
NS
NS
NS NS
NS
Fig. 41. Mean number of nodes above white flower of cotton plants in Coastal Plain counties.
Soil Test P
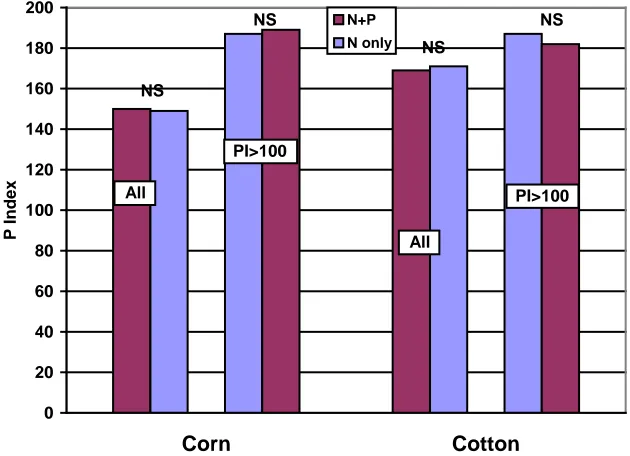
statistically higher than Coastal Plain cotton sites in any of the crop parameters measured, the greater soil test P appears not to be affecting cotton growth.
0 20 40 60 80 100 120 140 160 180 200 Corn Cotton P I nde x N+P N only All PI>100 PI>100 All NS NS NS NS
Fig. 42. Treatment differences in mean soil test P levels for two sample populations of corn and cotton.
0 50 100 150 200 250 300 Corn Cotton P I nde x Coastal Plain Piedmont Mountain PI>100 PI>100 All All
***
***
***
***
CONCLUSIONS
Given the dearth of consistent treatment differences, it appears that the addition of starter-P fertilizer to high-P Index soils does not improve the growth of corn or cotton plants. When considering all locations collectively by crop, the only significant differences between treatments that were apparent were plant height and color index in corn plots and nodes at first bloom in cotton plots. In the case of plant height and color index, the ‘N+P’ treatment was greater than the ‘N only’ treatment, while the number of nodes at first bloom were greater in the ‘N only’ treatment. However, these parameters seem to be relatively subjective and much less conclusive than would be a highly significant treatment difference in a more “rigorous” parameter such as yield. Color index value, for example, includes bias due not only to subjectivity of defining and differentiating between shades of green, but to the time at which a color “measurement” is taken as well.
Within each physiographic region, treatment differences existed for yield, plant population, plant height and color index for corn plots in the Coastal Plain. In each case, the ‘N+P’
treatment was greater than the ‘N only’ treatment. No other region had treatment differences in corn parameters. The only significant treatment difference seen in cotton plots was a statistically greater number of nodes at first bloom in ‘N only’ treatment plots of the Coastal Plain.
The corn parameters which had significant treatment differences in individual counties were: yield, color index and plant height in Beaufort County, and tissue N and color index in
Edgecombe County, with the ‘N+P’ treatment being greater than the ‘N only’ treatment in all cases. For cotton parameters, Beaufort County was the only county to have a treatment
difference and it occurred with nodes at first bloom. Again, however, we run into the potential problem of subjectivity across locations with measurements of color index and plant height. Yield, on the other hand, is a more rigorous measurement, so to speak, that is more resistant to temporal (within the growing season) biases. In this situation, the ‘N+P’ treatment performed significantly better than did the ‘N only’ treatment. However, of all the counties sampled, in either corn or cotton, Beaufort County was the only county to show this result.
Because corn plots in Beaufort County were the only study locations to experience a statistically significant treatment difference in yield, we performed more detailed analysis on these sites by segregating plots by soil type. In this way, any effect of soil type on the treatment differences that were found could be accounted for. The only significant soil effect that was found was a greater soil test P at sites with mineral soils as opposed to sites with organic soils. This result, however, did not affect crop growth parameters at organic sites.
study sites in Beaufort County. Where treatment effects did occur, the ‘N+P’ treatment was generally the better treatment when considering corn parameters, while the opposite was true of cotton parameters. Our results, however, do not seem to suggest that the use of starter-P
fertilizer is warranted on fields with veryhigh soil test P values (>100 PI).
Since growing seasons are never the same, it is important to have several years of data before recommendations are changed. In future years, it will be important to have as many replications and locations as possible in order to obtain more conclusive data. This work, however, gives us an excellent start into investigating whether to keep the current starter-P fertilizer
REFERENCES
Binford, G.D., D.J. Hansen, and S.C. Tingle. 2003.Update on starter fertilizer research in corn. Cooperative Bulletin 93, University of Delaware, Newark, DE.
Binford, G.D., D.J. Hansen, and S.C. Tingle. 2004. Corn response to starter and seed-placed fertilizer in Delaware. Mid-Atlantic Crop and Forage Journal. Submitted.
Bordoli, J.M. and A.P. Mallarino. 1998. Deep and shallow banding of phosphorus and pot assium as alternatives to broadcast fertilization for no-till corn. Agron. J. 90:27-33.
Daughtrey, Z.W., J.W. Gilliam, and E.J. Kamprath. 1973. Phosphorus supply characteristics of acid organic soils as measured by desorption and mineralization. Soil Sci. 115:18-24.
Johnson, A.M. 2004. Phosphorus Loss Assessment in North Carolina. Ph.D. Dissertation, NC State University, Raleigh, NC.
Johnson, A.M., D.L. Osmond, and S.C. Hodges. 2005. Predicted impact and evaluation of North Carolina’s phosphorus indexing too. J. Environ. Qual. 34:1801-1810.
Kamprath, E.J. 1967. Residual effect of large applications of phosphorus on high phosphorus fixing soils. Agron. J. 59:25-27.
Kamprath, E.J. 1987. Enhanced phosphorus status of maize resulting from nitrogen fertilization of high phosphorus soils. Soil Sci. Soc. Am. J. 51:1522-1526.
Kamprath, E.J. 1999. Changes in phosphate availability of Ultisols with long-term cropping. Commun. Soil Sci. Plant Anal. 30:909-919.
Ketterings, Q.M., S. Swink, G. Godwin, K.J. Czymmek, A. Durow, and G.L. Albrecht. 2004. Phosphorus Starter Project – Results of the 2003 Growing Season. What’s Cropping Up? 14:1-3. Unpublished data. 2003. Agronomic Division, NCDA&CS.
Sharpley, A.N., S.C. Chapra, R. Wedephol, J.T. Sims, T.C. Daniels, and K.R. Reddy. 1994. Managing agricultural phosphorus for protection of surface waters: Issues and options. J. Environ. Qual. 9:1462-1469.
Zublena, J.P. 1997a. Soil Facts: Starter Fertilizers for Corn Production.
of Soil Science, Raleigh, NC.
Zublena, J.P. 1997b. Soil Facts: Nutrient Removal by Crops in North Carolina.
APPENDIX A
Treatment and Regional Comparisons for Crop Parameters When Control Plots Were Included in Statistical Analysis
0 200 400 600 800 1000 1200 1400 1600
Corn Cotton
Y
ield
N+P N Only Check Farmers Rate
***
NS
bu/ac
lbs lint/ac
Fig. A1. Mean crop corn and cotton yields from all study locations.
0.0 0.5 1.0 1.5 2.0 2.5 3.0 3.5 4.0
Corn Cotton
C
ol
or
I
nde
x
N+P N only Check Farmers Rate
*** ***
0 5,000 10,000 15,000 20,000 25,000 30,000 35,000 40,000 45,000
Corn Cotton
#
of P
la
nts
N+P N only Check Farmers Rate
*
NS
Fig. A3. Mean corn and cotton populations from all study locations.
0.0 1.0 2.0 3.0 4.0 5.0 6.0 7.0 8.0 9.0 10.0
Corn Cotton
Heig
h
t, in
ch
es
N+P N only Check Farmers Rate
***
***
0.0 1.0 2.0 3.0 4.0 5.0 6.0
Corn Cotton
% N
N+P N only Check Farmers Rate NS
NS
Fig. A5. Mean tissue N content of corn and cotton plants from all study locations.
0.00 0.05 0.10 0.15 0.20 0.25 0.30 0.35 0.40
Corn Cotton
% P
N+P N only Check Farmers Rate
NS
NS
67 68 69 70 71 72 73 74
Corn Cotton
Days
N+P N Only Check Farmer
To Silking
To Early Bloom
*
NS
Fig. A7. Mean number of days to corn silking and early cotton bloom from all study locations.
0 2 4 6 8 10 12 14 16 18 20
@ First Bloom Total Above White Flower
#
of N
ode
s
N+P
N Only
Check
**
*
*
0 200 400 600 800 1000 1200 1400
Coastal Plain Piedmont Mountain Coastal Plain Piedmont
Y
ield
N+P N only
bu/ac
lbs lint/ac
Corn Cotton
**
***
Fig. A9. Regional comparisons of mean corn and cotton yields.
0.0 0.5 1.0 1.5 2.0 2.5 3.0 3.5 4.0 4.5
Coastal Plain Piedmont Mountain Coastal Plain Piedmont
C
ol
or
I
nde
x
N+P N only
Corn Cotton
*** ***
0 5,000 10,000 15,000 20,000 25,000 30,000 35,000 40,000
Coastal Plain Piedmont Mountain Coastal Plain Piedmont
#
of P
la
nts
N+P
N only
Corn Cotton
NS
NS
Fig. A11. Regional comparisons of mean corn and cotton plant populations.
0.0 2.0 4.0 6.0 8.0 10.0 12.0
Coastal Plain Piedmont Mountain Coastal Plain Piedmont
Heig
h
t, in
ch
es
N+P N only
Corn Cotton
NS NS
0.0 1.0 2.0 3.0 4.0 5.0 6.0
Coastal Plain Piedmont Mountain Coastal Plain Piedmont
% N
N+P
N only
Corn Cotton
NS
***
Fig. A13. Regional comparisons of mean tissue N content of corn and cotton plants.
0.0 0.1 0.1 0.2 0.2 0.3 0.3 0.4 0.4 0.5
Coastal Plain Piedmont Mountain Coastal Plain Piedmont
% P
N+P
N only
Corn Cotton
NS
***
62 64 66 68 70 72 74 76
Coastal Plain Piedmont Mountain Coastal Plain
Days
N+P
N only
To Silking
To Early Bloom
Corn Cotton
***
Fig. A15. Regional comparisons of days to corn silking and early cotton bloom.
0 2 4 6 8 10 12 14 16 18 20
Coastal Plain Coastal Plain Piedmont Coastal Plain Piedmont
#
of N
ode
s
N+P
N only
@ First Bloom Total Above White Flower
NS NS
0 50 100 150 200 250 300
Beaufort Craven Edgecombe Onslow Pasquotank Wilson
Y
ie
ld
, B
u
/a
c
NP N Check
* *** **
NS
NS NS
Fig. A17. Mean corn yield in Coastal Plain counties.
0 0.5 1 1.5 2 2.5 3 3.5 4 4.5
Beaufort Craven Edgecombe Wilson
C
ol
or
I
nde
x
NP
N Check
**
NS
**
***
0 5,000 10,000 15,000 20,000 25,000 30,000
Beaufort Craven Edgecombe Onslow Pasquotank Wilson
# o
f P
lan
ts/
ac
NP N Check
NS
NS
NS NS
NS
***
Fig. A19. Mean plant population of corn plots in Coastal Plain counties.
0 2 4 6 8 10 12
Beaufort Craven Edgecombe Onslow Pasquotank Wilson
H
e
ight
, i
nc
he
s
NP N Check
***
*
**
NS NS
***
0 1 2 3 4 5 6
Beaufort Craven Edgecombe Onslow Pasquotank Wilson
% N
NP N Check
NS
**
NS NS
NS
NS
Fig. A21. Mean plant tissue N of corn plants in Coastal Plain counties.
0 0.1 0.2 0.3 0.4 0.5 0.6 0.7
Beaufort Craven Edgecombe Onslow Pasquotank Wilson
% P
NP N Check
**
NS
NS NS
NS NS
0 10 20 30 40 50 60 70 80
Craven Edgecombe Wilson
D
ays
NP N Check
NS
NS NS
Fig. A23. Mean number of days to silking of corn in Coastal Plain counties.
0 50 100 150 200 250 300 350
Buncombe Cherokee Haywood Henderson Caldwell Lincoln
Y
ie
ld
, B
u
/a
c
NP N Check Farmer NS
NS NS
NS NS
NS
0 0.5 1 1.5 2 2.5 3 3.5 4 4.5
Cherokee Caldwell Lincoln
C
ol
or
I
nde
x
NP N Check Farmer
NS NS
NS
Fig. A25. Mean color index value of corn plants in Mountain and Piedmont counties.
0 5,000 10,000 15,000 20,000 25,000 30,000
Buncombe Haywood Henderson Caldwell Lincoln
# o
f P
lan
ts/
ac
NP N Check Farmer NS
NS NS
NS NS
0 2 4 6 8 10 12 14
Buncombe Cherokee Haywood Henderson Caldwell Lincoln
H
e
ight
, i
nc
he
s
NP N Check Farmer NS
*
NS
NS
NS NS
Fig. A27. Mean plant height of corn plants in Mountain and Piedmont counties.
0 1 2 3 4 5 6
Buncombe Cherokee Haywood Henderson Caldwell Lincoln
% N
NP
N Check Farmer NS
NS NS
NS NS
NS
0 0.05 0.1 0.15 0.2 0.25 0.3 0.35 0.4 0.45
Buncombe Cherokee Haywood Henderson Caldwell Lincoln
% P
NP N Check
Farmer NS
NS
NS
NS
NS
NS
Fig. A29. Mean plant tissue P of corn plants in Mountain and Piedmont counties.
64 66 68 70 72 74 76 78
Buncombe Haywood Henderson Caldwell Lincoln
D
ays
NP N Check Farmer
NS
NS
NS NS
NS