Comparative Analysis of Seismic Response of
Different Base Isolated Systems by Shaking Table Test
Sung Gook Cho1, Gihwan So1, and Dookie Kim2
1
R&D Center, INNOSE TECH Company, Incheon, South Korea
2
Department of Civil Engineering, Kunsan National University, Kunsan, South Korea
ABSTRACT
This study performed a set of shaking table tests to analyze seismic response of base isolated structure in accordance with the type of the isolators. The base isolated structure is made of 100 ton concrete block to reflect effect of inertia by superstructure mass, and supported by 3 types of base isolated systems including LRB, EQS and FPS. Seismic response test on the base isolated structure was performed and behavior characteristic of each base isolated system was analyzed. As a result, while there was difference in response pattern by incident seismic wave, decrease of acceleration by EQS base isolated system was the largest while displacement was the lowest.
INTRODUCTION
Studies to apply base isolated structure to nuclear power plant to prevent damages from earthquake fundamentally have been progressed domestically and internationally. As for previous studies on analyzing base isolated system and behavior characteristics, Fenves et al.(1998) performed static test and dynamic test on base isolated system to analyze features of base isolated system and to prepare interpretation model and Kim et al.(2014) carried out the analysis of floor response spectrum by shaking table test of base isolated steel structure. To consider the effect of inertia by superstructure mass, the study manufactured 100 ton concrete block and also manufactured special vibration table for shaking table test.
For accurate behavior analysis of base isolated structure, it needs to make experimental test reflecting inertia effect by superstructure mass. But, normal base isolated system test performs shearing force test on base isolated system to analyze its features.
This study applied same design period and surface pressure condition and designed 3 base isolated systems having LRB(lead rubber bearing), EQS(eradi quake system) and FPS(friction pendulum system). It was followed by shaking table test with applying superstructure mass on base isolated system. And, the study analyzed base isolated system features by means of comparison of seismic response of base isolated system.
SHAKING TABLE TEST
Isolators
Division IX (include assigned division number from I to X)
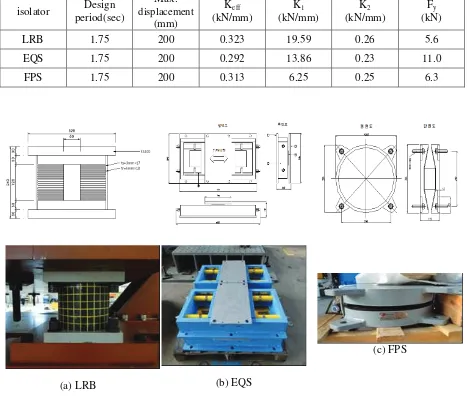
Table 1. Specification of isolators
isolator Design period(sec)
Max.
displacement
(mm)
Keff
(kN/mm)
K1
(kN/mm)
K2
(kN/mm)
Fy
(kN)
LRB 1.75 200 0.323 19.59 0.26 5.6
EQS 1.75 200 0.292 13.86 0.23 11.0
FPS 1.75 200 0.313 6.25 0.25 6.3
!
! !
(a) LRB
!
(b) EQS
(c) FPS
Figure 1. types of isolators and drawings
Shaking Table
4200 3750 2 1 5 0 2 4 0 0
35- M30x3.5 TAP THRU
4 X P IT C H 5 0 0 = 2 0 0 0
600 6 X PITCH 500 = 3000 400 250 250 250 250 250 750 250 250 250 250 250 P 50 5 0 0 1 3 0 0 5 0 0
144- Q27 DR THRU
! 500 3250 1 5 0 7 0 5
150 ST 150 ST
4200
1300 1200 1300 275
125 9 0 0 !"# $%&'(&)*+,-./ !
Figure 2. Shaking Table !
Concrete Block
Concrete block installed on the top of the base isolated system as a loading object are manufactured in 3 pieces considering delivery and the capacity of crane in the lab and then assembled for use. It was manufactured in shear key type as in Fig. 3 (a), and was solidly combined using prestressing steel bar to be moved as one mass.
(a) concrete block (b) Acc. & LVDT location
Figure 3. Experiment set up
TEST METHOD
Input Motions
Seismic wave used for the test are 3 real earthquake records including El Centro, Taft and Kobe.It attempts to analyze the relation between acceleration level of input motion and seismic response of base isolated structure by changing PGA values of seismic wave. The acceleration level of each seismic wave was adjusted to PGA level equivalent to 50%, 75%, 100% and 125% of PGA based on El Centro seismic wave. The acceleration level of input motion by seismic wave is in the following table.
Division IX (include assigned division number from I to X)
Table 2. Input motion
Input motion Test name PGA(g) PGA ratio(%) Test time(sec)
E-1 0.17 50 60
E-2 0.26 75 60
E-3 0.35 100 60
El Centro
E-4 0.44 123 60
T-1 0.17 97 60
T-2 0.26 146 60
T-3 0.35 194 60
Taft
T-4 0.44 243 60
K-1 0.17 21 30
K-2 0.26 31 30
Kobe
K-3 0.35 41 30
!
Test Response
Acceleration and displacement data were recorded during shaking table test. Measuring sensors are attached on the base isolated system on the sliding table as shown in Figure 3(b). Acceleration recorded 128 data per second, and displacement recorded 50 data per second.
TEST RESULTS
Acceleration response
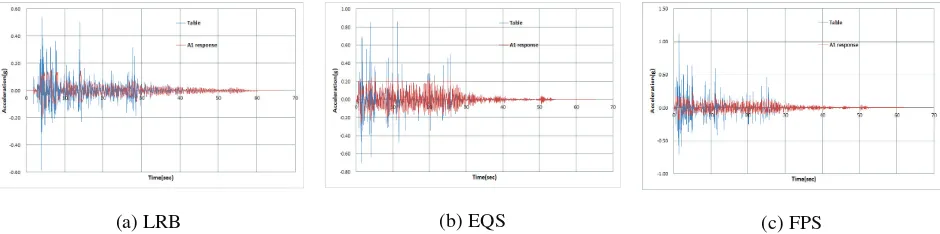
In seismic test, to check decrease of acceleration by each base isolated system, acceleration response of sliding table, and A1 location response of base isolated system were compared. Table 3. shows acceleration response and decrease rate. Figure 4. shows response graph in case of inputting El Centro PGA 100% seismic wave representatively.
!
(a) LRB
!
(b) EQS!
!
(c) FPS!
Figure 4. Acceleration time history - El Centro PGA 100% !
Table 3. Acceleration reduction ratios by isolator type
Input
motion Test name Data location LRB EQS FPS
Table max. acc.(g) 0.39 0.79 0.68
A1 acc.(g) 0.12 0.26 0.2
E-1
Acc. Reduction ratio(%) 68.1 66.4 70.8
Table max. acc.(g) 0.43 0.9 0.66
A1 acc.(g) 0.17 0.28 0.19
E-2
Acc. Reduction ratio(%) 60.5 68.6 71.6
Table max. acc.(g) 0.58 0.86 1.12
A1 acc.(g) 0.2 0.26 0.24
E-3
Acc. Reduction ratio(%) 65.5 69.5 78.6
Table max. acc.(g) 0.65 1.06 1.03
A1 acc.(g) 0.21 0.29 0.26
El Centro
E-4
Acc. Reduction ratio(%) 67.7 72.7 74.9
Table max. acc.(g) 0.34 0.63 0.53
A1 acc.(g) 0.1 0.27 0.18
T-1
Acc. Reduction ratio(%) 70.6 57.5 65.2
Table max. acc.(g) 0.58 1.05 0.74
A1 acc.(g) 0.15 0.27 0.31
T-2
Acc. Reduction ratio(%) 74.1 74.6 58.6
Table max. acc.(g) 0.71 1.05 0.93
A1 acc.(g) 0.16 0.29 0.21
T-3
Acc. Reduction ratio(%) 77.5 72.7 77.6
Table max. acc.(g) 0.72 1.11 1.078
A1 acc.(g) 0.2 0.284 0.228
Taft
T-4
Acc. Reduction ratio(%) 72.2 74.4 78.8
Table max. acc.(g) 0.37 0.58 0.5
A1 acc.(g) 0.14 0.25 0.18
K-1
Acc. Reduction ratio(%) 62.2 57.9 63.3
Table max. acc.(g) 0.49 0.97 0.79
A1 acc.(g) 0.2 0.29 0.24
K-2
Acc. Reduction ratio(%) 59.2 70.2 68.9
Table max. acc.(g) 0.69 1.29 0.98
A1 acc.(g) 0.25 0.28 0.24
Kobe
K-3
Division IX (include assigned division number from I to X)
Displacement Response
To check displacements of base isolated systems in vibration test, the relative displacement of load measured at actuator and DT1 location was expressed in graph and the maximum displacement was sorted out in a table 4.
(a) LRB (b) EQS (c) FPS
Figure 5. Load-displacement curve - El Centro PGA 100%
Table 4. Max. relative displacements of isolator types
Displacement(mm) Input motion Test name
LRB EQS FPS
E-1 30.25 8.74 15.65
E-2 42.95 28.34 42.97
E-3 51.73 55.62 64.43
El Centro
E-4 65.33 77.12 73.25
T-1 26.25 10.73 17.64
T-2 42.86 25.49 31.36
T-3 73.1 47.76 69.31
Taft
T-4 124.85 83.88 124.94
K-1 42.95 12.72 21.5
K-2 87.83 42.98 68.38
Kobe
K-3 114.22 80.12 100.58
EVALUATION TEST RESULTS
As for displacement, except for the tests on PGA 100% and 125% of EL Centro seismic wave, the maximum displacement was relatively small for EQS and LRB had large displacement.
(a) El Centro (b) Taft (c) Kobe
Figure 6. Acc. reduction ratio of each input level
(a) El Centro (b) Taft (c) Kobe
Figure 7. Maximum displacement of each input level
CONCLUSION
For vibration test of 100 ton base isolated structure, a special sliding table was manufactured and 3 base isolated systems such as LRB, EQS and FPS were used. As a result of acceleration and displacement response measured by vibration test, the following conclusions were drawn.
- As a result of vibration test on LRB, EQS and FPS, the acceleration reduction ratio was 60~82%, and the maximum response acceleration did not exceed 0.3g. If acceleration level of input motion increases, acceleration reduction ratio by base isolated system increases. While there is slight different by input motion, it was found that EQS had considerable acceleration decrease effect.
- For EQS and FPS, it is difficult to find 1st hardness value of frictional base isolated system. When the maximum displacement was checked, the displacement of EQS device was the lowest and LRB had the largest displacement.
- While current nuclear power plant’s base isolation design has focused on LRB design standards, it is determined that various base isolated systems need to be reviewed considering use performance, quality and reliability of the device.
ACKNOWLEDGMENTS
Division IX (include assigned division number from I to X)
Energy (No. 20101620100020). The authors would like to express their appreciation for the financial support.
REFERENCES