ABSTRACT
BEGENIR, ASLI. Structure-Process-Property Relationships in Elastic Nonwovens Made From Multi-Block Elastomers. (Under the direction of Stephen Michielsen and Behnam Pourdeyhimi.)
Melt-blown webs from ester and ether thermoplastic polyurethanes (TPU) and polyether-block-amide (PEBA) elastomers were produced at different die-to-collector distances (DCD) to study the correlation between polymer type, process conditions and web properties. Air temperature and velocity profiles were measured and modeled to correlate fiber formation to melt-blowing conditions. Isothermal crystallization kinetics was measured by DSC, and analyzed by traditional Avrami and model proposed by Kurajica. Web tensile properties were explained in terms of crystallization kinetics along with air temperature profile.
Crystallization kinetic parameters derived from both models exhibited similar temperature, polymer type and hardness dependence. The air flow field from simulations showed good agreement with experimental profiles and enabled modeling of fiber formation in melt-blowing. Both air temperature and velocities dropped significantly even at the die tip and continued to fall rapidly until reaching a plateau. The crystallization onset temperatures were found to fall within DCD region of rapid air velocity and temperature drop. This suggests that polymers already started to crystallize before collector, the extent of which depends on crystallization kinetics.
Structure-Process-Property Relationships in Elastic Nonwovens Made from Multi-Block Elastomers
by Asli Begenir
A dissertation submitted to the Graduate Faculty of North Carolina State University
In partial fulfillment of the Requirements for the degree of
Doctor of Philosophy
Fiber and Polymer Science Raleigh, North Carolina
2008
APPROVED BY:
________________________________ ______________________________
Dr. Sam M. Hudson Dr. Martin A. Hubbe
_______________________________ ______________________________
Dr. Stephen Michielsen Dr. Behnam Pourdeyhimi
ii
BIOGRAPHY
iii
ACKNOWLEDGEMENTS
I would like to express my sincere gratitude to Dr. Stephen Michielsen and Dr. Behnam Pourdeyhimi for being my advisors, their great supervision, patience and encouragement throughout the course of this research. I would also like to thank Dr. Martin A. Hubbe and Dr. Sam M. Hudson for serving on my advisory committee and providing helpful suggestions and feedback.
iv
TABLE OF CONTENTS
LIST OF TABLES ...v
LIST OF FIGURES ... vi
I. INTRODUCTION ...1
II. LITERATURE REVIEW ...3
II. 1. Thermoplastic Elastomers ... 3
II. 2. Crystallization Kinetics of Multi-Block Thermoplastic Polymers ... 7
II. 3. Melt-blowing Process ... 10
III. EXPERIMENTAL ...12
III.1. Materials ... 12
III.2. Melt-blowing Process Conditions ... 13
III.3. Melt-Blowing Air Velocity and Temperature Measurements ... 14
III.4. Characterization of Melt-Blown Webs ... 17
III.4.1. Thermal Analysis ...17
III.4.2. Isothermal Crystallization Kinetics ...17
III.4.3. Mechanical Properties ...20
III.4.4. Fiber Orientation Distribution ...21
III.4.5. Fiber Diameter Distribution ...21
IV. RESULTS AND DISCUSSION ...21
IV. 1. Melt-blowing Process ... 21
IV. 2. Thermal Analysis ... 23
IV. 3. Isothermal Crystallization Kinetics ... 28
IV. 4. Web Tensile Properties ... 46
IV. 4. 1. Polymer Orientation ...55
IV. 4. 2. Polymer Crystallization ...56
IV. 4. 3. Fiber Orientation ...62
IV. 4. 4. Inter Fiber Bonding ...64
IV. 5. Melt-Blowing Air Temperature and Velocity Profiles ... 70
IV. 6. Polymer Behavior ... 74
IV. 7. Elastic Properties ... 82
IV. 8. Melt-Blowing Simulations... 86
IV. 8. 1. Air Flow Field Simulation ...91
IV. 8.2. Polymer Melt Simulation-Fiber Modeling ...101
V. CONCLUSIONS ...116
VI. RECOMMENDATIONS ...119
v
LIST OF TABLES
Table 1: Melt-blowing Process Conditions ...13
Table 2: DSC Crystallization Temperatures and Test Conditions ...18
Table 3: DSC heating scans and data for PEBA elastomers ...24
Table 4: DSC heating scans and data for ester and ether TPU elastomers ...24
Table 5: Kinetic parameters for isothermal crystallization of melt-blown samples obtained by Kurajica model ...38
Table 6: DSC heating scans and data for PEBA series ...56
Table 7: DSC heating scans and data for ester TPU series (average values shown) ...58
Table 8: DSC heating scans and data for ether TPU series (average values shown) ...59
Table 9: DSC Crystallization Temperatures at Crystallization Half-times=0sec ...80
Table 10: Melt-blowing Process Conditions and simulation results...92
Table 11: Rheological properties of the polymers used in the simulation ...106
vi
LIST OF FIGURES
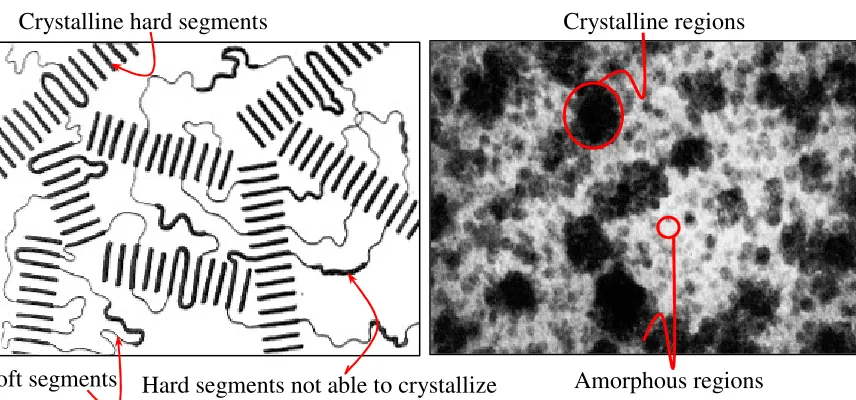
Figure 1: Two-phase morphology in thermoplastic elastomers: crystalline (hard segments)
and amorphous (soft segments) regions (a) schematic (b) TEM ...4
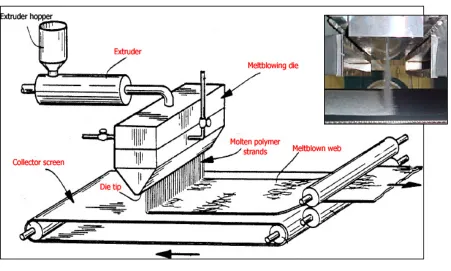
Figure 2: Melt-blowing process ...10
Figure 3: A cross-sectional view of (a) melt blowing die face, the z-axis (not shown) is perpendicular to the plane of the drawing, and (b) 45° sharp, inset melt blowing die, the y-axis (not shown) is perpendicular to the plane of the drawing (drawing is not to scale) ...15
Figure 4: Heating DSC scans of (a) ether TPU, (b) ester TPU, (c) PEBA webs ...25
Figure 5: Isothermal crystallization of T98 melt-blown web at Tc=130°C ...29
Figure 6: Isothermal crystallization of T90 melt-blown web at several Tc ...30
Figure 7: Relative crystallinity X (t-t0) vs crystallization time (a) P25, (b) P35 (c) P55 ...32
Figure 8: Avrami double logarithm plots from dried samples...33
Figure 9: Comparison of kinetic parameters obtained from Avrami model in Eqn. (2) vs. derivative Kurajica model of the Avrami Equation as in Eqn. (3), (a) Avrami exponent n, (b) Kurajica and Avrami crystallization rate k and , k-n respectively. Hollow circles represent P55. ...35
Figure 10: Avrami exponent n against crystallization temperatures obtained by (a) Kurajica and (b) Avrami models; Sample P25●, P35○, P55▼; T80∆, T90■; S78♦ ...36
vii
Figure 12: Optical images of the same field of P55 sample melt crystallized at Tc=138ºC at
crystallization times (a) 0 sec, (b) 45 sec, (c) 90 sec, (d)135 sec, (e)180 sec, (f)225 sec ...41
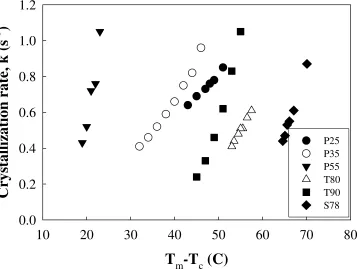
Figure 13: Crystallization rate, k as a function of degree of cooling; Sample P25●, P35○, P55▼; T80∆, T90■; S78♦ ...43
Figure 14: Crystallization half times of melt-blown webs as a function of Tc; Sample P25●, P35○, P55▼; T80∆, T90■; S78♦ ...44
Figure 15: Crystallization half times of melt-blown webs as a function of degree of cooling; Sample P25●, P35○, P55▼; T80∆, T90■; S78♦ ...45
Figure 16: Stress-strain behavior of PEBA, Ether and Ester TPU webs in MD ...47
Figure 17: Tensile modulus @ 5% elongation (a) PEBA and (b) Ester and Ether TPU melt-blown webs in MD ...49
Figure 18: Stress-strain behavior of PEBA, Ether and Ester TPU webs in MD ...51
Figure 19: Tensile behavior of (a) PEBA and (b) Ester and Ether TPU melt-blown webs in MD & CD. Sample P25●, P35○, P55▼; T80●, T90○, T98▼; S78♦, S95◊ ...53
Figure 20: Elongation to break behavior of (a) PEBA and (b) Ester and Ether TPU melt-blown webs in MD & CD. Sample P25●, P35○, P55▼; T80●, T90○, T98▼; S78♦, S95◊ ...54
Figure 21: 1st heating DSC scans of P25 melt-blown webs ...57
Figure 22: 1st heating DSC scans of P35 melt-blown webs ...57
Figure 23: 1st heating DSC scans of P55 melt-blown webs ...58
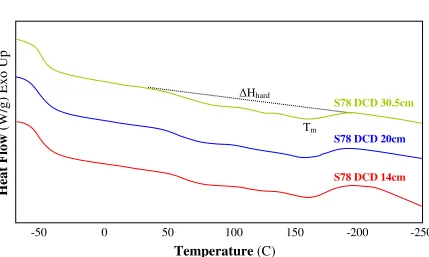
Figure 24: 1st heating DSC scans of S78 melt-blown webs ...59
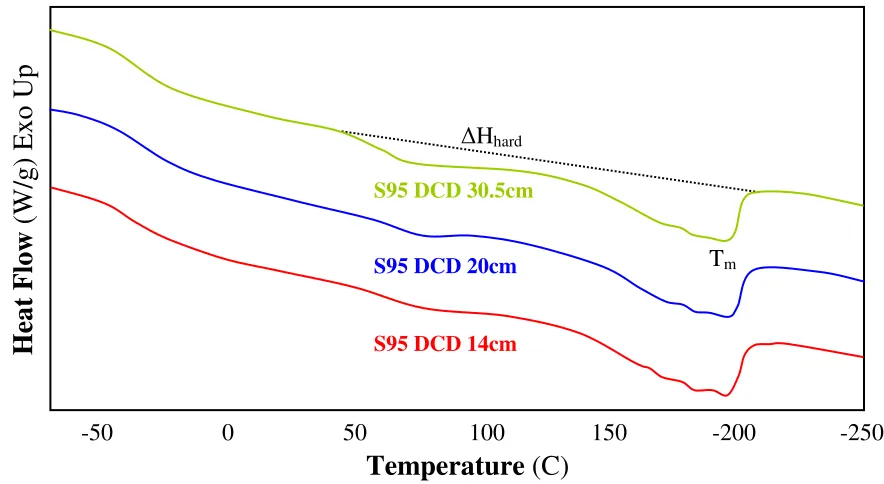
Figure 25: 1st heating DSC scans of S95 melt-blown webs ...60
viii
Figure 27: 1st heating DSC scans of T90 melt-blown webs ...61
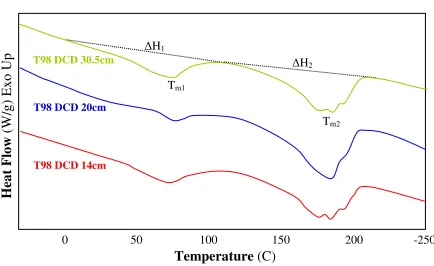
Figure 28: 1st heating DSC scans of T98 melt-blown webs ...61
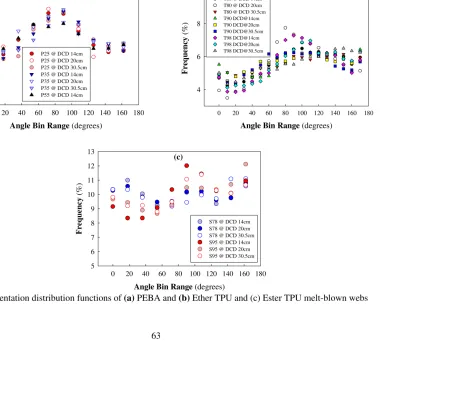
Figure 29: Orientation distribution functions of (a) PEBA and (b) Ether TPU and (c) Ester TPU melt-blown webs ...63
Figure 30: Tensile behavior of cast-film samples of (a) ether and ester TPU and (b) PEBA. For a single polymer type, individual stress-strain curves are shown for 5 replicates. ...65
Figure 31: (a) Tensile and (b) elongation to break behavior of PP melt-blown webs in MD & CD. ...66
Figure 32: Stress-strain behavior of PP melt-blown webs in MD ...67
Figure 33: Elongation at maximum stress behavior (in MD) of (a) ester and ether TPU (b) PEBA, PP, and (c) P55 vs PP ...69
Figure 34: Air velocity profiles across melt-blowing die as a function of z (DCD) at air temperatures of (a) 260°C and (b) 315°C. And, (c) Air velocity profile at air temperature of 260°C in the x-direction (across the die face) ...71
Figure 35: Air temperature profiles across melt-blowing die as a function of z (DCD) at air temperatures of 260°C (b) 315°C, and (c) normalized centerline air temperature ...73
Figure 36: Air temperature profiles as a function of DCD for (a) PEBA, (b) ether TPU, (c) ester TPU. Ellipses indicate the position of the onset of crystallization in isothermal crystallization for each polymer as measured by DSC ...76
Figure 37: Tensile set of ester TPU webs in MD vs DCD and elongation (50-100%) ...84
Figure 38: Tensile set of ether TPU webs in MD vs DCD and elongation (50-100%) ...84
ix
Figure 40: Tensile set of ether & ester TPU webs in MD, DCD 8inches at 50-100%. Numbers in brackets represent percent elastic limit ...85 Figure 41: Tensile set of PEBA webs in MD, DCD 5.5inches at 50-100%. Numbers in brackets represent percent elastic limit ...86 Figure 42: (a) Computational domain used for simulations, (b) close view of the grid resolution of the areas close to die face shown in dotted circle in (a) ...91 Figure 43: (a) Air velocity and (b) temperature profiles for different grid resolutions (standard k-ε model, second and third (QUICK) order discretization scheme)...94 Figure 44: Comparison of different turbulence models to the experimental data (a) velocity, (b) temperature profiles with the k-ε standard model (model parameters set to default values)96 Figure 45: (a) Velocity (velocity magnitude, m/s) and (b) Temperature (static temperature, degrees Kelvin) contours for air flow field. 118,300 mesh resolution, k-ε standard model (default values), second-order discretization scheme. The images on the left are the whole domain of 3cmx10cm across and below the die face. ...98 Figure 46: (a) Air Velocity (velocity magnitude, m/s) and (b) temperature (static temperature) profiles for P55, S95 and T80 processing conditions. k-ε standard model (default values), second-order discretization scheme ...100 Figure 47: 350X SEM image of S95 melt-blown web at DCD=30.5cm. Courtesy of BASF102 Figure 48: Fiber Diameter Distributions of (a) Ester TPU, (b) Ether TPU and (c) PEBA ..103 Figure 49: ln(η0) vs. 1/T for (a) PEBA and (b) Ether and Ester TPU ...107
x
1 I. INTRODUCTION
Thermoplastic elastomers (TPE) are semi-crystalline block copolymers consisting of crystalline hard and amorphous soft polymeric segments. They can be processed using thermoplastic processes while recovering their rubber-like properties upon cooling to room temperature. TPEs owe their unique combination of plastic and elastic attributes to their two-phase morphology resulting from two competing self-organizing mechanisms: crystallization of hard segments or micro-phase separation to form domains due to incompatibility and immiscibility of hard and soft segments. Thermoplastic polyurethane (TPU) and poly-ether-block-amide (PEBA) elastomers are a class of TPEs. In typical TPU elastomers, hard segments are created by the reaction of a diisocyanate with low molecular weight diols, yielding hard segments with urethane groups. In PEBA elastomers, hard polyamide segments are connected to soft segments through ester groups.
2
The degree of attenuation and solidification attained when the newly formed fiber contacts with the others already on the collector will depend on the distances traveled between the die and the collector (DCD), polymer extrusion and air temperatures, and the crystallization behavior of the polymer. The crystallization behavior of TPEs is complex and controls the polymer properties through the morphology established during processing and solidification. Thus, in order to optimize the melt-blowing process and obtain webs with better properties, it is critical to understand the correlation between the polymer crystallization behavior and processing conditions.
3
Finally, the web elastic properties were measured to understand the effect of polymer composition and hardness grade.
II. LITERATURE REVIEW II. 1. Thermoplastic Elastomers
4
Figure 1: Two-phase morphology in thermoplastic elastomers: crystalline (hard segments) and amorphous (soft segments) regions (a) schematic (b) TEM
In typical TPUs, hard segments are created by the reaction of a diisocyanate with low molecular weight diols as chain extender, yielding hard segments with urethane groups. 1,4 butanediol (BDO) is the most commonly used chain extender since it exhibits more favorable molecular fit due to its chain linearity, thereby promoting crystallinity of the hard segments. Isocyanates can be either aromatic such as 4,4’-diphenylmethane diisocyanate (MDI), toluene diisocyanate (TDI) or aliphatic such as hexamethylene 1,6-diisocyanate (HDI), isophorone diisocyanate (IPDI). Typically aromatic diisocyanates are preferred and the most widely used one is MDI. In polyether and polyester TPUs studied, the hard segment chemistry is based on 4, 4’-diphenylmethane diisocyanate (MDI) and 1, 4-butanediol (BDO). The soft segments are typically polyether or polyester polyols and connect hard segments as shown below: [8, 9]
Crystalline regions
Soft segments
Crystalline hard segments
5
–A-B-A–ΛΛΛΛΛ –A-B-A– ΛΛΛΛΛΛΛ –A-B-A–
The molecular weight of the polyether or polyester segments is generally in the range of 600 to 4000. Among available polyether soft segments, poly (tetramethylene oxide) glycol (PTMO) yields the best mechanical properties partially due to linear chain structure regularity and ability to crystallize upon extension. [8-15, 18]
In early 1980s, Arkema (formerly Atochem) introduced thermoplastic polyether-block-amide elastomer systems (PEBA) under the tradename PEBAX. [8, 19] The general structure of these systems is:
HO- [O(C)-PA-O(C)-O-PE-O]N –H
where PA is hard polyamide segments connected to soft polyether (PE) segments through ester groups. The molecular weight of the PE segments is generally in the range of 400 to 3000, while the molecular weight of the PA segments ranges from 500 to 5000. Due to a wide variety of polyamides (PA 11, 12, 6, 66…) and polyethers (PTMO, PPO, PEO...) available, PEBA elastomers have a broad spectrum of properties. [8, 13, 18] PEBA series studied here consists of PA 12 hard segments and poly (tetramethylene oxide) glycol (PTMO) soft segments.
It is well established that the morphology of semicrystalline block copolymers depends strongly on the interaction between two self-organizing mechanisms: crystallization of hard segments and microphase separation to form domains due to incompatibility and immiscibility of hard and soft segments.
A, Isocyanate B, chain extender Soft segment, diol Hard
Segment
6
In TPU and PEBA block copolymers, crystallization occurs through association of hard segments via hydrogen bonding between urethane and amide groups, respectively. [20, 21] Domain formation and microphase separation in block copolymers depend on how crystallization proceeds. Microphase separation may precede crystallization from disordered melt or crystallization may drive microphase separation from disordered melt when block incompatibility is small. Depending on the strength of segregation, degree of cooling, glass-transition temperature of the amorphous segments, and competition between crystallization and diffusion rates, crystallization may proceed within the preexisting domains or it may destroy existing microphase separated domains. [10, 20] When block copolymers crystallize from a single-phase melt, their crystallization behavior is similar to homopolymers. In this case, crystals can grow freely and aggregate to form macroscopic structures such as spherulites since there are no existing domains to restrict the crystal growth. However, in strongly phase separated melts, crystal growth is restricted in one direction since crystallization is confined to microdomains. This leads to nanoscale crystal structures. These morphological differences affect the crystallization kinetics. When crystallization drives microphase separation either from homogeneous melt or by destroying an existing domain structure, the Avrami model describes the characteristic sigmoidal crystallization kinetics at early stages of isothermal crystallization. For crystallization isolated to domains, crystallization will follow first-order kinetics along with very small Avrami n values (n<1). [22-28]
7
In a series of morphological studies of ether-ester copolymers, Wegner et al. [29-31] observed formation of spherulitic crystals in the amorphous matrix, which was similar to the crystallization of homopolymers rather than microphase separation as observed in block copolymers. Ho et al. [32] suggested spherulitic crystallization of hard segments with no macro phase separation in ether-ester block copolymers. Seymour et al. [33] and Xu et al. [14] proposed a model of spherulitic crystallization for ester-urethane copolymers where microphase separation occurs only into crystalline and amorphous regions. In these models, incompatibility of hard and soft segments drives association and crystallization of hard segments rather than microphase separation into hard and soft domains. In a study of nanophase separated Pebax 3533 and Pellethane TPU 70A with AFM McLean and Sauer [15] observed larger crystals in PEBA than in TPU 70A. They described crystallization in PEBA as crystallization driven phase separation, while in TPU crystallization was restricted to hard domains which had already phase separated. [34]
II. 2. Crystallization Kinetics of Multi-Block Thermoplastic Polymers
8
(
)
t(
(
)
n)
t t k Xc
Xc t
t− 0 = =1−exp− − 0
Χ
∞
………..…………... (1)
where Xct and Xc∞ are the amount of crystallinity at time t and at infinite time, respectively. k
is the crystallization rate constant; n is the Avrami exponent; and t0 is the time at the onset of
crystallization. Assuming that the relative degree of crystallinity increases with crystallization time, equation (1) can be used to analyze isothermal crystallization. The crystallization rate constant, k is a function of the nucleation and growth rates and depends on the polymer properties and the temperature. The Avrami exponent, n provides information on the number of dimensions in which growth takes place (growth geometry) and on the nucleation process. According to the original assumptions of the theory, the Avrami exponent, n ranges between the positive integers 1 and 4. [36-38]
The Avrami kinetic parameters are usually determined by taking double logarithm of equation (1):
(
)
[
ln1 (t t )]
nlog(t t ) logklog− −Χ − 0 = − 0 + .………..………...…………. (2)
The rate constant, k and Avrami exponent, n are obtained by plotting the
(
)
(
)
[
ln1 0]
log− −X t−t against the log
(
t−t0)
. The value of y-intercept gives log(k) while n is just the slope of the least-square line. [11]9
Because the crystallization onset, t0 is typically determined visually on the DSC isothermal
crystallization exotherm, the calculation of the relative crystallinity, X
(
t−t0)
by integrating the DSC data inherently involves errors. In addition, the double log form of the Avrami plot may result in superficially good fits for the experimental data, and thus the derived kinetic parameters may not give a true representation of the crystallization process. [32, 38] Although this does not mean that the derived Avrami parameters are invalid, the evaluation of the crystallization kinetics based only on the Avrami analysis may be misleading. Among many studies attempting to improve the Avrami analysis, Kurajica et al. [16] proposed a different approach for analysis of isothermal crystallization DSC data. They took the derivative of the Avrami equation and fit the untransformed DSC data directly to this function. In their equation, they replaced k of the Avrami equation by kn. Thus, they represented the heat flow dq/dt measured by DSC as follows:(
)
n(
n(
)
n)
n
t t k t
t Hnk dt
d H dt dq
0 1
0 exp− −
− ∆
= ∆
= α − ………..……… (3)
10 II. 3. Melt-blowing Process
Ever since Wente introduced a method to produce fine fibers from thermoplastic materials [39], the melt-blowing process has been studied and used in producing nonwovens. In the melt-blowing process, polymer melt is extruded from a row of fine capillaries along the center of the die. Once it exits the die, very high velocity heated air impinges on the polymer melt and the resultant drag force attenuates the molten polymer into fine fibers having diameters in the range of 1-20 microns within microseconds. These fibers are then deposited on the collector to produce web substrates. Melt-blowing process is depicted in Figure 2. [4]
Figure 2: Melt-blowing process
11
air velocity profile and the distances traveled between the die and the collector (DCD). Since melt-blowing typically produces self-bonding nonwoven structures that derive their strength from fiber to fiber contacts, the ability of the fiber to stick to other fibers already on the collector is critical. Thus, while the profiles of polymer and air temperatures along with flow rates are important in fiber formation, the rate of heat transfer or cooling of polymer melt and the degree of fiber solidification attained on the collector will also depend on distances traveled between the die and collector (DCD) and crystallization behavior of the polymeric material. [40]
12
geometry (blunt and sharp nose pieces) and positioning of the nose piece (inset, flash, and outset). They showed that sharp die tip configuration is aerodynamically superior to blunt die and provides higher centerline air velocities but increased air turbulence at any point below the die. At the same air flow rates, with increasing die angles the two symmetric air jets converging from the sharp dies were found to merge to the maximum velocity at farther distances below the die, produce lower centerline velocities, broader temperature profiles, and slower fiber attenuation rates.
III. EXPERIMENTAL III.1. Materials
Melt-blown webs were produced on the North Carolina State University (NCSU) Nonwoven Cooperative Research Center’s melt-blowing line from thoroughly dried (1) BASF Elastollan® Ether TPU series: 1180A10, 1190A16, and WY5352D-1; (2) BASF Elastollan® Ester TPU series: C78A15, and C95A10; and (3) Arkema Pebax® series: 2533, 3533, 5533. Within Table 1, and throughout this manuscript, ester and ether TPU’s are denoted as Sxx and Txx, respectively, where xx represents Shore A hardness. Likewise, the polyether-block-amides (PEBA’s) are referred to as Pxx, where xx represents Shore D hardness. These elastomers were chosen to span similar hardness ranges across all of the materials studied.
III.2. Melt-blowing Process Conditions
13 Table 1: Melt-blowing Process Conditions
Ghm†: grams per hole per minute
The line consists of a 0.76 m (30inches) wide slot die with a single row of 535 polymer capillaries having 0.381 mm diameter with a density of 25 holes/inch, 50 mm (2.0 inch, 24:1) extruders and melt pumps. Air flow rates corresponding to 20-25% and 50-70% of the pump speed were used in melt blowing PEBA and TPU polymers, respectively. The processing conditions employed during melt-blowing of these polymers are shown in Table 1. Die-to-collector distances (DCD) of 14 cm (5.5 inches), 20 cm (8 inches), and 30.5 cm (12 inches) were used to produce melt-blown webs of approximately 100 g/m2 at polymer mass flow rates of 0.24 g/hole/min and 0.5 g/hole/min for PEBA and TPU polymers, respectively. The polymer mass flow rates used are representative of commercial melt-blowing production rates. The polymer extrusion (die) temperatures were adjusted for each polymer type and grade to maintain the die pressures in the range 450-550 psi, the acceptable range for an efficient melt-blowing process on this apparatus.
Sample ID
Die Temp.
(°C)
Air Temp.
(°C)
Air Flow Rate (%)
Polymer Mass Flow Rate
(Ghm)† Ether Elastollan®
TPU
1180A10 T80 233 222 70 0.5
1190A10 T90 251 238 70 0.5
Wy5352d T98 261 249 70 0.5
Ester Elastollan® TPU
C78A15 S78 253 234 70 0.5
C95A10 S95 262 261 50 0.5
PEBA (Pebax®)
2533 P25 287 258 25 0.24
3533 P35 305 267 20 0.24
14
III.3. Melt-Blowing Air Velocity and Temperature Measurements
Process air temperature and velocity profiles were measured online with a K-type thermocouple and a T2-600 cylindrical pitot tube (Hotek Technologies) connected to HD2134P.2 Digital Manometer Thermometer (Hotek Technologies) with full-scale readings of 0.01 mbar – 1 Pa differential pressure and 2 - 210 m/s velocity range. The data collected was processed with Deltalog 9 (Hotek Technologies) software. The pitot tube and thermocouple probe were mounted on a three-dimensional framework such that they were oriented parallel with the direction of air flow i.e. parallel to z-axis to minimize flow disturbance. The set up permitted x, y, and z motions within the flow field in 1.6 mm increments.
15
Figure 3: A cross-sectional view of (a) melt blowing die face, the z-axis (not shown) is perpendicular to the plane of the drawing, and (b) 45° sharp, inset melt blowing die, the y-axis (not shown) is perpendicular to the plane of the drawing (drawing is not to scale)
b=0.63mm h=1.263mm
Right Air Plate Left Air Plate
Air
d=1.524mm
Ө=45° Air Nose Piece
a=1.524mm
x
z Polymer
D=0.381mm Polymer capillary
row length, 540mm
Die length, 762mm
Die width=92.075mm
x
h=1.263mm
16
17
The selected air velocities for ether and ester TPU series fall within Region II and III, which produces fiber diameters in the range of 0.1µm–10µm. Even though fiber vibrations are significant in this high air velocity region, we assume during attenuation the polymer path coincides with the direction of the axial component of the air velocity at the centerline. For PEBA series, on other hand, the air velocities correspond to those classified under Region 1 and produce melt-blown webs having fiber diameters in the range of 10µm–20µm. The temperature and velocity profiles of the air were measured in the absence of polymer flow.
III.4. Characterization of Melt-Blown Webs III.4.1. Thermal Analysis
Thermal analysis (heating DSC scans provided by BASF and Arkema) for both polymer pellets and melt-blown webs was carried out using Universal V4.1D TA Instruments for ester TPU and PEBA series, and Universal V3.8B TA Instruments for ether TPU series. The heating and cooling temperatures were in the range of -50°C/-90°C to 250°C at a heating rate of 20°C/min, for ester and ether TPU series, respectively, while from -80°C/-140°C to 220°C at a heating rate of 10°C/min for PEBA series. Solution viscosity data was provided by Arkema and BASF.
III.4.2. Isothermal Crystallization Kinetics III.4.2.1. Differential Scanning Calorimeter
18 crystallization from the melt.
The DSC equipped with internal liquid nitrogen cooling unit reliably provided a cooling rate up to 50°C min-1. At higher cooling rates, it was observed that the collected data was unreliable due to the initial instability of the DSC program vs. sample temperature. Temperature calibration was performed using an indium standard (Tm =156.6°C and
∆H=28.5 Jg-1). All DSC scans were carried out under nitrogen atmosphere and each sample was used only once to reduce degradation. Web samples of 3-5 mg were placed in open DSC pans, vacuum-dried at 60°C for 3 hrs, and kept in desiccators until just before loading into the DSC. [32,37] To observe the crystallization exotherm and determine the onset of crystallization, web samples were first heated to temperatures 40-50°C above their peak melting temperature at 20°C min-1, maintained at this temperature for 3 min to ensure complete melting, then were cooled to 25°C at 10°C/min. [54] The initial isothermal crystallization temperature was chosen by adding 5°C-10°C to the observed onset of crystallization temperature as seen in Table 2.
Table 2: DSC Crystallization Temperatures and Test Conditions
Sample ID Tm (°C)
Crystallization
Tonset (°C)
Crystallization
Tpeak (°C)
DSC Isothermal Crystallization Melt
Temp. (C)
Crystallization Temp. Range (C) Ether
TPU
T80 146.5 79.1 71.2 195 89-93.5
T90 165 106.2 99.3 210 110-120
T98 183.3 118.4 112.9 225 130-146
Ester TPU
S78 158.1 81.0 71.8 215 88-93.5
S95 196 113.2 107.7 225 124-134
PEBA
P25 135 90.1 81.6 180 84-92
P35 142 98.6 91.1 180 96-110
19
Isothermal crystallization kinetics from the melt was determined as follows. Melt-blown web samples were melted at temperatures 40-50°C above their peak melting temperature at heating rates of 20°C min-1, held there for 3 min, then cooled at 50°C min-1 to the designated crystallization temperature, Tc, and maintained at that temperature for 10 min until
crystallization was complete. The heat flow generated as a function of time during the isothermal crystallization was recorded and analyzed according to the typical procedure to obtain relative degrees of crystallinity, X(t-t0):
= −
∞
A A t
t
X( 0) t ………..……….……….(4)
where t0 is the time at which the web sample attains stable isothermal conditions, which is
assumed to correspond to the crystallization onset. At is the cumulative area under the
exotherm from time t0 to time t and A∞is the total area of the crystallization exotherm at long
times.
III.4.2.2.Optical Polarizing Microscope
20 III.4.3. Mechanical Properties
III.4.3.1. Tensile Properties
Tensile properties were measured using an Instron tensile tester and a dogbone sample with gage lengths of 63.5 mm (2.5") and 114 mm (4.5") for PEBA and TPU systems, respectively. The dogbone sample shape was determined by ASTM D 638-03 (type III & IV) for PEBA systems, while that of TPU systems was ASTM D638 (type III). The test conditions were modified from ASTM 3776 so as to give the same extension rate for the dogbone samples as for the straight sided samples of method ASTM 3776. Thus the crosshead speed was set at 132 mm/min for the 63.5 mm gage dogbone and 228 mm/min for the 114 mm gage dogbone specimen. Elongation to rupture measurements were based on the elongation of the narrow section of the sample. The actual % elongation of the narrow section of sample was found to be 17% and 58% larger than instrumental elongation for TPU and PEBA series, respectively.
III.4.3.2. Elastic Properties
21
100 Length
Initial
Length Initial
Length Recovered
Set Tensile
% ×
−
= ………...(5)
Elastic limit was extrapolated from the regression fit of % tensile set plotted as a function of given extensions.
III.4.4. Fiber Orientation Distribution
Five transmitted light optical microscopy images were obtained randomly for each web sample and analyzed by NCRC Image Analysis software for fiber orientation distribution analysis. The software performs a Fast Fourier Transform to measure the orientation distribution. The results are illustrated as mean dominant angle of orientation and frequencies of orientation angles. [55]
III.4.5. Fiber Diameter Distribution
Scanning Electron Microscopy (SEM) images were obtained for each melt-blown web sample and 50 diameter measurements were obtained using NCRC Image Analysis software. [56]
IV. RESULTS AND DISCUSSION IV. 1. Melt-blowing Process
22
23
Solution viscosities of the pellets and melt-blown webs produced from PEBA and TPU elastomers were analyzed to understand the degree of polymer degradation during melt-blowing process. In comparison to original pellet solution viscosities, the viscosity values of the melt-blown web samples were found to decrease by 11-45% for PEBA series, 6-25% for ester TPU and 21-26% for ether TPU series. This was more pronounced with increasing extrusion temperatures. This clearly suggests that the high processing temperatures used to relieve the die pressures in melt-blowing PEBA and TPU elastomers caused significant molecular weight degradation. The degradation was more pronounced in ester TPU series. The S85 grade of ester TPU series could not be melt-blown within the available time allocated for the trials.
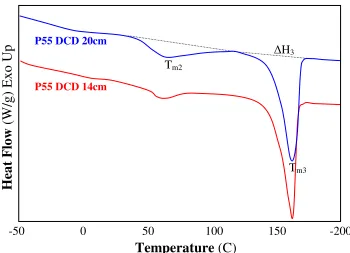
IV. 2. Thermal Analysis
Heating DSC data and scans of the PEBA, ether and ester TPU pellets and melt-blown webs processed at different DCDs and extrusion temperatures are shown in Tables 3-4 and Figure 4. Because the DSC data and heating profiles of the melt-blown webs processed at different DCDs were almost identical, the values shown in Tables 3-4 are averaged over the DCD range. And, DSC heating scans in Figure 4 for the pellets are also representative of the melt-blown webs regardless of the DCD.
24
Table 3: DSC heating scans and data for PEBA elastomers
Table 4: DSC heating scans and data for ester and ether TPU elastomers
As seen in Table 3, for both pellets and melt-blown webs, the glass transition temperature (Tg, PE) is around -77˚C, higher than the PE homopolymer (-84˚C), while Tm of the hard PA
segment appears to be lower than the homopolymer PA (180˚C). This suggests the presence of hard segments in the soft matrix and imperfection of the hard crystalline structures. The two distinct melting endotherms observed in Figure 4 (c) at lower (Tm1) and higher
temperature (Tm3) ranges indicate the existence of two crystalline phases: soft and hard
crystalline melting at Tm1 and Tm3, respectively. [58,59] A number of studies suggested
melting of crystalline structures having different thickness or sizes, or imperfection of hard crystalline domains as possible explanations for Tm2 and Tm3. [13,18,19]
Sample Tg (°C) Tm1 (°C) (TmPE)
TmPA (°C)
Tm2 Tm3 ∆H3 (J/g)
P25
Pellet *** 7.6 70.9 137.1 14.6
Web -76.43 6.5 57.9 134.9 22.8
P35
Pellet *** 4.6 90.7 143.5 22.9
Web -77.7 4.6 59 140.9 25.3
P55
Pellet *** *** 87.8 160.8 47.6
Web *** *** 59.4 160.8 44
Sample Tg (°C) Tmhard (°C) ∆Hhard (J/g)
Tonset Tm1 Tm2 ∆H2
Ester TPU
S78 -48.4 53.2 *** 156.7 17.8
S85 -48.5 120.9 *** 159.5 22.1
S95 -37.8 129.5 *** 195.9 29.3
Ether TPU
T80 *** 26.7 73.8 146 31.7
T90 *** 28.2 73.3 165.2 29.3
25
26
(b)
-100 -50 0 50 100 150 200 250
S78
S95
Tm
Tm
H
ea
t
F
lo
w
E
x
o
U
p
Temperature
∆Hhard
T80
Tm1
Tm2
T90
Tm1 T98
Tm2
-50 0 50 100 150 200 250
Tm2
Tm1
H
ea
t
F
lo
w
E
x
o
U
p
[
m
W
]
Temperature
(°C)
∆H2
∆H1
∆Hhard=∆H1+∆H2
27
As for TPU elastomers seen in Figure 4 (a) and (b), two endotherm peaks were detected in ether TPU series while a relatively broad melting endotherm is observed in ester TPU series. The presence of a broad melting endotherm for ester TPU and two melting endotherms for the ether TPU suggests the imperfection of the hard crystalline structures. [8, 60] Multiple endotherms detected in ether TPU series can also be attributed to melting of hard segments with differing degrees of order.[61-63]
As expected, the area of the soft melting endotherm is the largest in the softest grades i.e. P25, T80 and S78, and decreases with increasing hard segment content until it diminishes. The area of the hard melting endotherm becomes larger with increasing hard segment content
Temperature
P25
P35
-60 -20 20 60 100 140 180
Tm1
∆HPE
Tm2
Tm1
Tm3 Tm2
Tm3
∆H3
Tm2
∆H2
Tm3
(c)
H
ea
t
F
lo
w
E
x
o
U
p
28
in the order of P55>P35>P25 in PEBA, S95>S85>S78 in ester and T98>T90>T80 in ether TPU series. The hard crystalline melting peak, also, shifts to higher temperatures with increasing hard segment content. Various studies suggested that Tm and crystallinity of the
hard segments depends mainly on the block length and content. With increasing hard segment content, average length of the crystallizable hard segments increases. This promotes hydrogen bonding between polar amide and urethane groups in PEBA and TPU series, respectively. This results in the formation of larger and more ordered hard crystalline structures, thereby enhancing the crystallinity and higher melting temperatures. [13, 19, 63-67]
IV. 3. Isothermal Crystallization Kinetics
The desired isothermal crystallization temperatures were determined from cooling crystallization exotherms by adding 5-10°C to the temperature of the onset of crystallization. The isothermal crystallization temperature ranges and the maximum temperature at which the melt was held (melt temperature) for TPU and PEBA melt-blown webs are shown in Table 2. As expected, melting and crystallization peaks as well as onset of the crystallization shift to higher temperatures with increasing amount of crystallizable component i.e. increasing Shore hardness. Thus, the crystallization temperature, Tc, follows the order of P55>P35>P25 for
29
In contrast, at low crystallization temperatures, the crystallization can be too fast and the experimental measurements are limited by the fact that the sample has already crystallized to a significant extent by the time its temperature reached the predetermined crystallization temperature. Figure 5 shows a typical DSC crystallization exotherm for isothermal crystallization of the melt-blown web, T98 at Tc=130°C after complete melting at 225°C for
3 min. Crystallization is assumed to begin at point A where t0 = 0.778 min, which is preceded
by a short time period during which the temperature of the web sample reached isothermal crystallization conditions and crystallization begins. The exothermic heat flow increases until reaching a maximum at point B. Beyond the maximum heat flow, crystallization slows significantly, and no noticeable change in the heat flow is detected after point C. [68]
Figure 5: Isothermal crystallization of T98 melt-blown web at Tc=130°C
T98
Time (min)
0
1
2
3
4
5
6
7
8
9
H
ea
t
F
lo
w
(
m
W
)
-37
-36
-35
-34
-33
B Maximum, 2.425min Area, -68.3mJ
C
End, 3.86min Onset, 0.778min
A
30
The rate of heat flow during isothermal crystallization depends strongly on the kinetics of the crystallization process, which is very sensitive to crystallization temperature. This is illustrated in Figure 6, where crystallization exotherms of web T90 at several crystallization temperatures are plotted. It is clearly observed that at higher crystallization temperatures the crystallization maxima shift to longer times and become flatter. This means that the time to reach the ultimate degree of crystallinity becomes longer and the crystallization rates decrease due to the decrease in the degree of cooling (Tmelting point-Tcrystallization). The
crystallization exotherms of the other polymers studied are not shown here since all exhibited similar temperature dependency.
T90
Time (min)
0 1 2 3 4 5 6 7 8
H
ea
t
F
lo
w
E
n
d
o
U
p
(
m
W
)
-40.5 -40.0 -39.5 -39.0 -38.5 -38.0 -37.5 -37.0
104C 110C 112C 114C 116C 118C 120C
31
Figure 7 shows the development of relative crystallinity X(t-t0) with crystallization time for
PEBA series. It can be seen that all exotherms exhibit characteristic sigmoidal behavior and the curves shift to longer times with increasing crystallization temperatures. The relative crystallinity vs. crystallization time plots of ether and ester TPU systems are not shown here since all exhibit similar sigmoidal dependence.
The double logarithmic Avrami plots of log
[
−ln(
1−X(
t−t0)
)
]
vs. log(
t−t0)
are shown in Figure 8. As observed from the plots, experimental DSC data fit the Avrami model only for the initial portion of the crystallization process, beyond which deviations from the model are observed as changes in the slope. This is in agreement with the literature suggesting that the Avrami model is valid only for the early stages of the crystallization process. Therefore, in order to obtain Avrami kinetic parameters, k and n, the experimental data at low transformations of the crystallization are used, corresponding to around Xc < 30% for soft32
(a)
Time (s)
0 50 100 150 200 250 300 350
R el a ti v e C ry st a ll in it y , X (t ) 0.0 0.2 0.4 0.6 0.8 1.0 84C 86C 87C 88C 90C (b) Time (s)
0 50 100 150 200 250 300 350 400 450
R el a ti v e C ry st a ll in it y , X (t ) 0.0 0.2 0.4 0.6 0.8 1.0 96C 98C 100C 102C 104C 106C 108C 110C (c) Time (s)
0 100 200 300 400 500 600 700 800
R el a ti v e C ry st a ll in it y , X (t ) 0.0 0.2 0.4 0.6 0.8 1.0 138C 139C 140C 141C 142C 143C 144C
33
Figure 8: Avrami double logarithm plots from dried samples
S95
log (t)
-0.6 -0.4 -0.2 0.0 0.2 0.4 0.6 0.8
lo g [ -l n ( 1 -X ( t) )] -2.0 -1.5 -1.0 -0.5 0.0 0.5 1.0 120C 124C 126C 128C 130C 132C 134C P25 log (t)
-0.6 -0.4 -0.2 0.0 0.2 0.4 0.6
lo g [ -l n ( 1 -x ( t) ] -2.0 -1.5 -1.0 -0.5 0.0 0.5 84C 86C 87C 88C 90C 92C P35 log (t)
-0.8 -0.6 -0.4 -0.2 0.0 0.2 0.4 0.6
lo g [ -l n ( 1 -X ( t) )] -2.0 -1.5 -1.0 -0.5 0.0 0.5 96C 98C 100C 102C 104C 106C 108C 110C P55 log (t)
-0.6 -0.4 -0.2 0.0 0.2 0.4 0.6 0.8 1.0
lo g [ -l n ( 1 -X ( t) )] -2.0 -1.5 -1.0 -0.5 0.0 0.5 138C 139C 140C 141C 142C 143C 144C T80 log (t)
-0.4 -0.2 0.0 0.2 0.4 0.6 0.8
lo g [ -l n ( 1 -X ( t) )] -2.0 -1.5 -1.0 -0.5 0.0 0.5 89C 90C 91C 91.5C 92C 93C 93.5C T90 log (t)
-0.8 -0.6 -0.4 -0.2 0.0 0.2 0.4 0.6 0.8
lo g [ -l n ( 1 -X (t )) ] -2.0 -1.5 -1.0 -0.5 0.0 0.5 110C 112C 114C 116C 118C 120C T98 log (t)
-0.4 -0.2 0.0 0.2 0.4 0.6
lo g [ -l n ( 1 -X (t )) ] -2.0 -1.5 -1.0 -0.5 0.0 0.5 130C 134C 138C 142C 146C S78 log (t)
-0.6 -0.4 -0.2 0.0 0.2 0.4 0.6 0.8
34
The values of the crystallization kinetics parameters determined from the DSC heat flow data using traditional Avrami analysis in equation (2) plotted against those derived from the Kurajica model in equation (3) are shown in Figure 9. A linear correlation between the n-parameters (Figure 9a) obtained from both models is observed indicating that both methods give similar values. However, n obtained from the Avrami fit tends to be larger than that obtained from the Kurajica model. In Figure 9b, the Avrami k-n value is plotted against the k value from the Kurajica model. This approach accommodates the different definitions used for k in equation (1) and equation (3). There is a linear dependence of the value of k determined from fitting equation (3) to the DSC data with the value of k-n derived from the Avrami fit, except those of P55, which lie above the line relating these parameters (see Figure 9b). However, the value of k-n derived from the Avrami fit is smaller than the value of k obtained from the Kurajica model. This is clearly demonstrated in Figures 10 & 11, which illustrate the Avrami exponent, n and crystallization rate, k plotted as a function of polymer type and hardness as well as isothermal crystallization temperatures. Both the Avrami n and crystallization rate, k values obtained by the integrated and untransformed DSC data are consistent and comparable. As described earlier, in traditional Avrami analysis, the crystallization rate, k is obtained from the double logarithmic plot of
(
)
(
)
[
ln1 0]
log− −X t−t vs.log
(
t−t0)
, where k is the anti-logarithmic value of y-intercept. Thus, the value of k is very sensitive to errors in correctly determining the crystallization onset, t035
(a)
R2 = 0.8
Avrami n
2.0
2.5
3.0
3.5
4.0
K
u
ra
ji
ca
n
2.0
2.5
3.0
3.5
4.0
(b)
R2=0.79
Avrami k
-n0.2
0.4
0.6
0.8
1.0
1.2
K
u
ra
ji
ca
k
0.2
0.4
0.6
0.8
1.0
1.2
36
(a)
Temperature (C)
80
90
100
110
120
130
140
n
1.0
1.5
2.0
2.5
3.0
3.5
4.0
P25 P35 P55 T80 T90 S78
(b)
Temperature (C)
80
90
100
110
120
130
140
n
1.0
1.5
2.0
2.5
3.0
3.5
4.0
P25 P35 P55 T80 T90 S78
37
(a)
Crystallization Temperature, T
c(C)
80
90
100
110
120
130
140
150
C
ry
st
a
ll
iz
a
ti
o
n
r
a
te
,
k
(
s
-1)
0.2
0.4
0.6
0.8
1.0
1.2
P25 P35 P55 T80 T90 S78(b)
Crystallization Temperature, T
c(C)
80
90
100
110
120
130
140
150
C
ry
st
a
ll
iz
a
ti
o
n
r
a
te
,
k
-n
(
s
-1)
0.2
0.4
0.6
0.8
1.0
1.2
P25 P35 P55 T80 T90 S7838
Table 5: Kinetic parameters for isothermal crystallization of melt-blown samples obtained by Kurajica model
Because the approach in equation (3) can directly be fitted to the DSC experimental data, the errors associated with the Avrami model are reduced, allowing more accurate determination of the crystallization rate, k. Therefore, we use the Kurajica approach, in the remainder of this study. The values of k and n obtained from untransformed DSC data by fitting Kurajica
T80
Tc (°C) 89 90 91 91.5 92 93 93.5
N 2.98 2.94 2.99 3.02 2.91 3.15 2.97
K (min-1) 0.61 0.57 0.51 0.51 0.48 0.44 0.41 t1/2 (min) 1.45 1.55 1.73 1.74 1.84 2.02 2.16
T90
Tc (°C) 110 112 114 116 118 120
N 2.87 2.99 3.19 3.22 3.32 2.93
K (min-1) 1.05 0.83 0.62 0.46 0.33 0.24 t1/2 (min) 0.84 1.07 1.44 1.94 2.71 3.68
S78
Tc (°C) 88 90 92 92.5 93 93.5
N 2.68 2.63 2.57 2.59 2.57 1.54
K (min-1) 0.87 0.61 0.55 0.53 0.47 0.44 t1/2 (min) 1.00 1.43 1.58 1.64 1.84 1.97
P25
Tc (°C) 84 86 87 88 90 92
N 2.7 2.67 2.65 2.72 2.65 2.87
K (min-1) 0.85 0.78 0.76 0.73 0.69 0.64 t1/2 (min) 1.03 1.12 1.15 1.20 1.26 1.38
P35
Tc (°C) 96 98 100 102 104 106 108 110
N 2.95 3.16 3.29 3.27 3.37 3.34 3.41 3.4
K (min-1) 0.96 0.82 0.75 0.66 0.59 0.52 0.46 0.41 t1/2 (min) 0.92 1.09 1.19 1.35 1.52 1.72 1.95 2.19
P55
Tc (°C) 138 139 140 141 142
N 2.77 2.92 3.19 3.19 3.54
39 model in equation (3) are shown in Table 5.
Analysis of the secondary crystallization is not considered within this text because the purpose of this research is to understand the effect of crystallization kinetics in melt-blowing process where polymer melt reaches the collector within time scales significantly shorter than the onset of secondary crystallization. As seen in Table 5, for all studied webs, non-integer n values were obtained, contradictory to the theoretical expectations of integer values based on the original Avrami assumptions. Earlier studies interpreted non-integer n values due to simplified assumptions in the original Avrami equation which may not apply to all polymers under all crystallization conditions, [70] the complex nature of crystallization, [37] mixed nucleation and/or crystal growth modes, [11] variations in crystal growth dimension, [71] variation in nucleation and/or crystal growth rates during crystallization, [72] development of similar crystal growth structures from different types of nuclei, [38] and simultaneous occurrence of two and three dimensional crystal growth. [69] As suggested by Cho et al. [72] non-integer n values will be considered as representative of the nearest integer.
40
is similar to that of semi-crystalline homopolymers involving formation of macroscopic crystal structures. [29-33]
The nature of nucleation and crystal growth, and how crystallization develops from the melt: either from single-phase melt or by destroying existing microphase separated domains was further explored by optical microscopy. Figure 12 shows microscopic images of P55 crystallized at 138ºC from the melt under crossed polarizers and at different times during crystallization. The initial melt conditions were the same as the DSC protocol described in experimental section. Within the resolution of the microscope, no residual crystallites or other structures were observed in the melt state. This observation indicates that crystallization develops from a single-phase melt structure where crystallization dominates the formation of final morphology. Upon reaching the isothermal crystallization temperature, crystal nuclei are observed to form rapidly and grow in size until reaching a constant size as seen in Figure 12 (e) and (f). Some of the crystals impinge against each other but others do not, even after long crystallization times. Due to limited resolution of the microscope, it is difficult to conclude the nature of nucleation and growth modes from the microscopic images.
41
Figure 12: Optical images of the same field of P55 sample melt crystallized at Tc=138ºC at
crystallization times (a) 0 sec, (b) 45 sec, (c) 90 sec, (d)135 sec, (e)180 sec, (f)225 sec
(a)
(b)
(c)
(d)
42
nucleation time is very short, again indicating heterogeneous nucleation and three dimensional crystal growth, in agreement with earlier studies on block copolymers. [14, 15, 29-33, 75]
Similar crystal nucleation and growth were observed for the corresponding hardness grades of ether and ester TPU elastomers (T98 and S95), while crystallites were too small to be observed microscopically for the medium and soft grades of both TPU and PEBA series. Figure 11a shows the crystallization rate, k plotted against the crystallization temperatures. As expected, the crystallization rate, k decreases with increasing crystallization temperatures, regardless of the polymer type and hardness. Because n values of nearly 3 are relatively independent of the isothermal crystallization temperatures as illustrated in Figure 10, the mechanism of nucleation and crystal growth do not change with increasing crystallization temperatures, at least within the studied temperature ranges. The decrease in the crystallization rate is therefore due to the decrease in the rate of nucleation and crystal growth with increasing crystallization temperatures. This is expected since the energy barrier for nucleation will increase as the crystallization temperatures approach melting temperatures. [53, 70, 76]
It is generally considered better to compare the crystallization rate for different polymers at constant difference in crystallization temperature below the melting temperature, i.e. ∆T = Tm
– Tc = constant. This is illustrated in Figure 13 where the crystallization rate, k is plotted as a
43
constant ∆T, the crystallization rate, k, decreases with increasing concentration of non-crystallizable component i.e. soft segment. This means that with increasing amount of crystallizable component i.e. polymer hard segments, the crystallization of the polymer melt becomes faster, and crystallization onset temperatures shift to higher temperatures, but crystallization onset occurs with a smaller extent of cooling.
T
m-T
c(C)
10
20
30
40
50
60
70
80
C
ry
st
a
ll
iz
a
ti
o
n
r
a
te
,
k
(
s
-1)
0.0
0.2
0.4
0.6
0.8
1.0
1.2
P25 P35 P55 T80 T90 S78Figure 13: Crystallization rate, k as a function of degree of cooling; Sample P25●, P35○, P55▼; T80∆, T90■; S78♦
The crystallization half-time, t1/2, is defined as the time from the onset of the crystallization
until the crystallization is half-completed. Based on the Avrami analysis in equation (1), t1/2
is determined from the measured kinetic parameters
n n k t / 1 2 / 1 2 ln
44
Because we use the Kurajica approach, where k has units of 1/time , the crystallization half-time is defined as follows and plotted as a function of isothermal crystallization temperature in Figure 14.
n k t / 1 2 / 1 2 ln
= ………...………….……...…. (7)
Crystallization Temperature, T
c(C)
80
90
100
110
120
130
140
150
C
ry
st
a
ll
iz
a
ti
o
n
h
a
lf
-t
im
e,
t
0 .5(m
in
)
0.5
1.0
1.5
2.0
2.5
3.0
P25 P35 P55 T80 T90 S78Figure 14: Crystallization half times of melt-blown webs as a function of Tc; Sample P25●,
P35○, P55▼; T80∆, T90■; S78♦
45
grades do not change significantly and are all around 3. Therefore, the crystallization half-timecan be used to compare the overall crystallization rates.
Figure 14 shows that in agreement with the results in Figure 13, the crystallization half-time increases with increasing temperature. The half-time also increases with increasing amount of non-crystallizable soft segment. This means the crystallization process of the crystallizable hard segment slows down since the non-crystallizable soft segment dilutes the probability for nucleation and crystal growth. [35, 53, 70, 76]
Figure 15 illustrates the dependence of the crystallization half-time on the degree of cooling, which allows comparison of different polymers under similar cooling conditions.
T
m-T
c(C)
10
20
30
40
50
60
70
80
C
ry
st
a
ll
iz
a
ti
o
n
h
a
lf
-t
im
e,
t
0.5
(m
in
)
0.5
1.0
1.5
2.0
2.5
3.0
P25 P35 P55 T80 T90 S78
46
In agreement with Figure 10, the degree of cooling required to reach the same crystallization half-time decreases with increasing crystallizable component in the order of P55 > P35 > P25 for PEBA, T98 > T90 > T80 for ether TPU, and S95 > S78 for ester TPU series. This means that for a given elastomeric copolymer, the increase in the overall crystallization rate is dependent on the relative concentration of the hard and soft segments under similar cooling conditions. This is also evident from the slopes of each curve, where the slope reflects the temperature and composition dependence of the overall crystallization rate.
IV. 4. Web Tensile Properties
47
Ester/Ether TPU Stress-strain-MD-DCD 14cm
Strain (%)
0 100 200 300 400 500
S tr e s s (N /g s m /m ) 0 2 4 6 8 10 12 S78 S95 T80 T90 T98
Ester/Ether TPU Stress-strain-DCD 20cm-MD
Strain (%)
0 100 200 300 400 500
S tr e s s (N /g s m /m ) 0 2 4 6 8 10 12 S78 S95 T80 T90 T98
Ester/Ether TPU Stress-strain-DCD 30.5cm-MD
Strain (%)
0 100 200 300 400 500
S tr e s s (N /g s m /m ) 0 2 4 6 8 10 12 S78 S95 T80 T90 T98
Peba Stress-strain-DCD 14cm-MD
Strain (%)
0 200 400 600 800 1000 1200
S tr e s s (N /g s m /m ) 0 2 4 6 8 10 12 P25 P35 P55
Peba Stress-strain-DCD 20cm-MD
Strain (%)
0 200 400 600 800 1000 1200
S tr e s s (N /g s m /m ) 0 2 4 6 8 10 12 P25 P35 P55
Peba Stress-strain-DCD 30.5cm-MD
Strain (%)
0 200 400 600 800 1000 1200
S tr e s s (N /g s m /m ) 0 2 4 6 8 10 12 P25 P35
48
49
(a)
DCD
(cm)
12
14
16
18
20
22
24
26
28
30
32
5
%
M
o
d
u
lu
s
(N
/g
sm
/m
)
0
4
8
12
16
20
24
28
32
36
P25 P35 P55(b)
DCD
(cm)
12
14
16
18
20
22
24
26
28
30
32
5
%
M
o
d
u
lu
s
(
N
/g
sm
/m
)
0
4
8
12
16
20
24
28
32
36
S78 S95 T80 T90 T9850
But, as seen in Figure 17, 5% modulus of P55 also decreases with increasing DCD. To further understand this unexpected behavior, individual stress-strain curves are examined in Figure 18. In Figure 18, it is clearly observed that the web failure mechanism depends on the polymer type. I.e. upon application of the stress, the web stress increases to a maximum for both ether and ester TPU series. On reaching this point, the web sample fails abruptly. P25 and P35 also behave similarly, while P55 behaves quite differently. For P55, the web failure is gradual and separation of fiber layers within the web can clearly be observed during tensile testing. The gradual web failure is more pronounced with increasing DCDs, where the web strength for P55 drops to essentially zero. Observations of the melt-blown samples visually and under microscopy, P55 melt-blown webs consist of well-defined individual fibers rather than fused together as in the case of softer PEBA grades and TPU series. Upon application of stress, because the degree of fiber-to-fiber bonding in P55 is so low that fibers within the web debond very easily and tensile failure occurs through fiber-to-fiber bonding failure, not individual fiber failure. And, the failure stress is reached at lower elongations.