ABSTRACT
LAMBERTUS, AMANDA JANE. Students’ Understanding of the Function Concept: Concept Images and Concept Definitions. (Under the direction of Karen Norwood.)
Misconceptions about the function concept can occur across a variety of
representations. These misconceptions may be compartmentalized allowing students to answer questions incorrectly by evoking certain parts of the concept image. The concept image is the mental pictures that students construct for each mathematical concept. The concept definition is a formal definition of a mathematical concept.
This study is exploratory nature. The researcher is trying to compare students’ understanding of the function concept by examining their concept images and concept
definition when they are introduced to function concept through a formal definition versus an informal approach.
The participants were traditional college students enrolled in Intermediate Algebra at a large university in the southeast region of the United States. The students completed a questionnaire that asked them to identify functions and non-functions, mentally construct functions from verbal statements, and provide a definition for the function concept.
Students’ Understanding of the Function Concept: Concept Images and Concept Definitions
by
Amanda Jane Lambertus
A thesis submitted to the Graduate Faculty of North Carolina State University
in partial fulfillment of the Requirements for the Degree of
Master of Science
Mathematics Education
Raleigh, North Carolina May 12, 2007
Approved by:
______________________________ Karen Norwood (Committee Chair)
_____________________________ Hollylynne Lee
DEDICATION
BIOGRAPHY
ACKNOWLEDGEMENTS
TABLE OF CONTENTS
LIST OF TABLES ... vii
LIST OF FIGURES ... viii
CHAPTER 1-INTRODUCTION TO THE PROBLEM...1
Misconceptions ...3
Problem Statement ...4
Research Question ...4
CHAPTER 2-LITERATURE REVIEW ...5
Background ...5
Reform ...5
Role of Technology...6
Concept Definition/Concept Image ...7
Students’ Misconceptions about Functions ...9
Verbal...9
Algebraic...11
Graphical...12
Representations ...14
Curriculum Suggestions ...17
Object & Process Conceptions ...19
CHAPTER 3-THEORETICAL FRAMEWORK ...24
Framework Background...24
Implementation of Framework ...27
CHAPTER 4-COMPONENTS AND METHODS ...28
Context of Study ...28
Participants...30
Instruction Sequence...31
Data Collection Instrument ...33
Analysis...36
CHAPTER 5-ANALYSIS ...41
Overall Analysis of Accuracy of Responses...42
Digging Deeper in Comparing the Two Groups...45
Examining Students’ Justifications for Identifying Functions...50
Graphical Representations ...50
Tabular Representations...51
Symbolic Representations...51
Control Group ...52
Graphical Representations ...52
Tabular Representations...52
Symbolic Representations...53
Comparison Across Groups ...53
Analysis of Students’ Concept Definitions...54
Comparing Students’ Concept Images and Definition ...57
CHAPTER 6-DISCUSSION ...62
Implications for Mathematics Education ...62
Questions for Further Research ...64
How the Finding Relate to Those of Other Researchers...65
REFERENCES ...70
APPENDICES ...74
Appendix A...75
Appendix B ...76
Appendix C ...78
Appendix D...82
LIST OF TABLES
Table 1: Justifications of Survey Questions...34
Table 2: Percentage of Correct Answers ...43
Table 3: Break Down by Question of Correct Answers ...44
Table 4: Percentage of Students in each of the Concept Definition Categories ...54
Table 5: Connections between Concept Images and Definitions Control Group ...59
LIST OF FIGURES
Figure 1: Split Domain Graph...13
Figure 2: Three Representations of a Function...14
Figure 3: Continuity Linked to Functions...39
Figure 4: The Total Number of Correct Answers...46
Figure 5: Graph Scores ...47
Figure 6: Comparison of Total Correct Answers Across Representations ...49
Figure 7: Symbolic Representation of a Function ...52
Figure 8: Number Correct and Definition Type ...56
Figure 9: Concept Images of Functions ...67
CHAPTER 1
INTRODUCTION TO THE PROBLEM
The concept of function is fundamental to the learning and understanding of
mathematics (Bowman, 1997; Dreyfus & Eisenberg, 1982; Eisenberg, 1991; Gagatsis, Elia, Panaoura, Gravvani, & Spyrou, 2006,). The function concept provides a basis for high school mathematics courses as well as college courses. In order to help improve students’ knowledge of functions, the National Council of Teachers of Mathematics (NCTM) emphasizes: students as early as grades 3-5 need to begin looking at representing and analyzing functions using words, tables, and graphs. Teachers should emphasize the importance of using and interpreting several representations, while working with functions, throughout the student’s mathematical education (NCTM, 2000). This emphasis should help students develop a repertoire of many different types of functions and their respective
representations as they progress through their middle school and high school mathematics courses. They should be able to manipulate and interpret a variety of functions using several different representations, graphical, tabular, verbal, and symbolic (Eisenberg, 1991;
Moschkovich, Schoenfeld, & Arcavi, (1993); NCTM, 2000). Representations in this study are considered the tools for interpreting and depicting functions.
Vinner (1983, 1991) used the constructs of concept images and concept definitions to analyze students’ understandings and misconceptions of the function concept. A concept definition is a verbal description of a mathematical concept that accurately describes the concept in a non-circular way; whereas, a concept image is the mental picture that is associated with the concept name in a student’s mind (Vinner, 1983). The use of these two constructs allows researchers to look at distinctions between the formal definition of a concept and the students’ images or the way that students think about a concept and the association it has with the formal definition (Lloyd & Wilson, 1998).
Vinner and Dreyfus (1989) found that students compartmentalize their concept images and concept definitions; meaning students do not always connect a formal definition to their mental images. The implication is students can possess different and possibly conflicting views of what constitutes a function and not be concerned with the fact that these notions are in conflict. Another option is the students simply do not realize the conflict exists and therefore are ignorant of it. This compartmentalization can lead to misconceptions between the concept definition and one’s concept image, misconceptions in the concept image, and a misunderstanding of the formal definition of a concept.
Students’ evoked concept images often focus on a single image or piece of information about the function concept that allows the student to answer a particular mathematics question without consulting the concept definition. Consequently, this partial use of the concept image prevents the development of conceptual understanding (Vinner & Dreyfus, 1989). If students’ concept images and definitions are not compatible, in
Misconceptions
A student’s misconceptions about the function concept may occur for several reasons. For example, students may not fully understand the formal definition of function. Lack of understanding a definition may lead to conflicts between students’ images and their concept definition (DeMarois, 1996; Slavit, 1997; Vinner, 1983; Vinner, 1991; Vinner & Dreyfus, 1989). Early in their high school mathematics careers, students are typically introduced to a formal definition of function: correspondence between two non-empty sets that assigns to every element in the first set (the domain) exactly one element in the second set (the
co-domain), (Vinner & Dreyfus, 1989, p. 357). This definition is not unique. A survey of mathematics textbook revealed many different definitions for the function concept. No matter what definitions of function students are presented in Algebra courses, the students are not forced to use the formal definition in a rigorous manner. The definition is noted, and the teacher moves on in the instruction to help the students create and build concept images. As a result students will tend to rely on their concept images for function when answering questions and solving problems.
Typically, students do not consult the formal definition of a concept when presented with an unfamiliar function (Doyle, 1986; Slavit, 1997; Vinner, 1983; Vinner 1991). This has led researchers to investigate what alternative strategies are viable for teachers to use when introducing the concept of function. The fact that the students do not consult their concept definitions is not unusual. According to Thompson (1994), most people in lay situations rely on their mental imagery to understand words. “They operate from the basis of imagery, not from the basis of conventional constraints adopted by a community”
understanding or at least a more well-defined concept image for function after completing an Algebra course?
Problem Statement
Mathematical learning may not be able to take place at the higher levels without the aide of a teacher or textbook. However, given specific teaching strategies, it may be difficult to determine how much of the learning was due to the learning processes or influenced by the teacher (Sfard, 1991). How does the type of instruction influence the students’ ability to form connections between concept images and concept definitions or does it influence the students’ understanding at all? The purpose of this study is to examine the nature of college students’ understandings of function when the definition is presented formally versus informally.
Research Question
CHAPTER 2 LITERATURE REVIEW
Background
This chapter discusses the roles of reform, technology, and representations in
students’ understanding and the development of the function concept in the high school and college algebra curriculums. It will identify students’ misconceptions in three different representations (algebraic, graphical, tabular, and verbal) and the effects that these
misconceptions have on student understanding. Due to the fact that representations play an important role in the NCTM Standards, they will also be discussed. Finally, the chapter will suggest changes to the curriculum for teaching the function concept based on research and the object/process conceptions for understanding mathematical concepts.
Reform
Role of Technology
With calculators and computers widely available in the schools for student use, technology is also a large factor in reform movements. Using graphing calculators or computers, students can explore the different representations of functions with relative ease (Fey, 1989; O’Callaghan, 1998). Having technology in the classroom, allows the teacher to re-vitalize the methods in which they teach mathematical concepts, and produce more meaningful lessons that would help the student create meaning and learn for understanding (Fey, 1989; Kaput, 1992). The visual and exploratory nature of the graphing calculator provide learning experiences which allow students to form a deeper understanding of the content they are learning (Cates, 2002; Erbas, Ledford, Polly, & Orrill, 2004; Fey, 1989). The algebra curriculum needs to be adjusted in order to account for the influx of technology and the fact that most high school students do not develop the expected levels of proficiency and understanding in algebra courses (Fey, 1989).
the calculator.
Concept Definition/Concept Image
Despite NCTM’s (2000) recommendations for students to begin exploring functions in the third grade, a surprising number of students lack a conceptual understanding of the function concept when entering college level courses (DeMarois, 1997; Doyle, 1986;
Mousoulides & Gagatsis, 2004; Vinner & Dreyfus, 1989). This does not mean that students do not have some understanding about functions. Indeed, they have constructed concept images and memorized formal definitions, but they may not have formed a connection
between the two “cells” (Vinner, 1991). In Vinner’s (1991) description of cells, he states that the concept image cell remains empty until there is some meaning associated with the
concept name. As soon as meaning (correct or not) is attached, the image cell begins to “fill”. The concept definition cell is “filled” when the student learns a new concept definition. It is important to note that the definition does not have to be accurate, if the student believes that it is. However, there may not be a complete transfer of the definition to the “cell” if the student does not understanding the meaning behind a formal definition. Students may only transfer part of the definition or an incorrect interpretation of the
definition. Vinner (1991) believes there is supposed to be “interaction between the concept image cell and the concept definition cell, although the two cells can be formed
independently” (p. 70). Yet, until meaning between the definition and the images is created there is little if any interaction between the two cells.
definition may become dispensable with students no longer relying on it to formulate answers (Vinner, 1991). When formal definitions are introduced early in a mathematics curriculum, with not much emphasis placed on them, the definitions can be easily pushed aside in favor of more accessible images. Hitt’s (1998) investigation of in-service teachers found that the teachers do not rely on their concept definitions when determining if a relation is a function. It is not surprising then that students do not consult their concept definitions. Both the students and teachers rely on their concept images to identify functions until the students have more experiences in mathematics which force them to access and rely on formal definitions (Gagatsis et al, 2006; Hitt, 1998; Tall & Bakar, 1991).
college, construct concept images through a variety of methods. These methods include, but are not limited to, exploration of examples and non-examples, working problems, classroom instruction, and applying the definition.
Since, students do not consult their concept definition when confronted with new situations, it is important that students’ concept images are as accurate as possible. Students should also be willing to adapt and change their concept images as they progress through more advanced mathematics. Providing the student opportunities to create, modify and adjust “definitions” as necessary when they encounter new and different scenarios allows them to learn to adjust their concept images. Their concept images will continue to grow and when they encounter a concept definition the students will be able to mesh it together with the images that they have, or apply that definition to a new problem and add the result to their concept image.
Students’ Misconceptions about Functions
According to Vinner (1983), students may have expectations of functions that may not logically relate to the definition (p. 302). Expectations on the students’ part are factors in their misconceptions of functions. These misconceptions range across the different
representations that the students encounter.
This type of misconception can be linked to the familiarity issues of teaching
functions in the high school. Typically, teachers present students with these specific types of functions on a regular basis as part of the classroom instruction. The students become comfortable with them and understand that quadratics and polynomials are functions without calling on the concept definition. However, when a student encounters an unfamiliar
equation, for example a split domain equation, they do not consult their concept definitions to determine if the resulting curve is a function. The student may simply state that it is not a function, because the do not recognize it and the function does not have a specific
mathematical name.
Students are not the only population to have these verbal misconceptions about functions. Even and Tirosh (1995) found teachers often have the same difficulties as students when working with familiar curves and their verbal representations. In their study, Brian, a teacher could demonstrate that he understood the correspondence requirement for functions. He demonstrated this knowledge while working with arbitrary functions such as: “let g(x) equal x, if x is a rational number and zero, if x is an irrational number” (p. 7). However, he also believed that “familiar graphs such as circles and ellipses are function” (p. 7) even though they do not fulfill the correspondence requirement. Brian seemed unaware of this conflict in his concept image and concept definition. Not until he was presented with a situation, in which the definition and the image did not correspond, did Brian confront his misconceptions. However, instead of adjusting his concept image to match the definition, he decided that the vertical line test did not work on all functions and that he would only use it with his students when discussing linear functions.
definitions are at odds with a person’s everyday experiences. Normally, a concept would be developed by looking at examples that one encounters at the outset, and focuses on the features of those examples. Eventually, the person will encounter an example that does not fit with the features they have allocated to the concept and adjustments need to be made to the image. For example: “That is a bird. … A bird flies … it had wings, … and feathers … and a beak … and lays eggs” (Tall and Bakar, 1992, p. 40). Eventually, one will encounter a new example that needs to be tested against these features. “Is a Chicken a bird?” (p. 40). The person will have to adjust their features to include that some birds do not fly. Here we can see that the person is willing to adjust their criteria for what constitutes a bird. The same types of opportunities need to be available in the classroom for students that are developing or adding to their concept images. They develop an organized and complex concept image without having to memorize a difficult formal definition for a concept.
definition of the function concept to determine if such a function exists. If the concept definition is incomplete or non-existent, the student will not be able to determine if the statement represents a function.
Sfard (1992) found that students believed that all functions can be expressed in a regular manner relating x and y, and that all functions can be expressed by computational formulas. In other words, if we provided a student with a value for the x term, they can find the exact value for the y term. According to Vinner (1991), a student should not formulate an answer without first consulting the formal definition, which should be the student’s concept definition. But, the students do not use these formal definitions introduced in high school algebra courses or introductory algebra courses at the college level as they classify functions. Consequently, the students rarely understand these formal definitions (Gagatsis et. al. 2006; Tall & Bakar, 1991). Instead, the students rely solely on their concept images. These images become distorted when elements of the function concept are not introduced nor reinforced; hence, these element are forgotten (Vinner, 1983).
Graphical. In addition to verbal and algebraic misconceptions, students can also apply their concept image distortions to graphical representations of functions. Students often believe that functions are continuous (Jones, 2006). This is not surprising since the first functions that most students encounter in high school textbooks are graphical
discrete function or a set of ordered pairs do not represent a function is that “functions are continuous graphs”.
Figure 1: Split Domain Graph (Vinner and Dreyfus, 1989, pp. 359)
The students also come to rely on the vertical line test, possibly a result of teachers’ reliance on the vertical line test for determining if curves are functions during classroom instruction. The vertical line test, states that a curve or discrete relation is a function if and only if any given vertical line passes through the curve or relation once at a given point. This implies that visually, students and teachers can quickly categorize functions.
“Strange” or unfamiliar graphs cause the students to pause. They do not want to accept these new types of graphs as functions, because it does not fit with their images of what a function should look like: i.e. the graph of a function should be a reasonable, curved line in the coordinate system, the graphs of a function should not be curtailed but rather, go on forever (Jones, 2006; Tall & Bakar, 1991; Vinner, 1983; Williams, 1998). Some
researchers believe that this type of misconception is a result of the students’ exposure to only a few “familiar” types of functions, dictated by the high school mathematics curriculum (Keller & Hirsch, 1998; Lloyd & Wilson 1998; Tall & Bakar, 1991).
asked to graph a function, they may see the graph as “extra baggage” not essential to the problem (Eisenberg and Dreyfus, 1994).
Representations
According to NCTM (2000), in “the middle grades, students should be able to understand the relationships among tables, graphs, and symbols and to judge the advantages and disadvantages of each way of representing relationships for particular purposes” (p. 37). However, research has shown that students who have an idea on how to apply the function concept in one representation have difficulties in applying the same concepts in a different representation (Eisenberg, 1991). In fact, students may not make the connection that an equation, table, and graph all communicate the same information in different forms (Figure 2). The difficulty that students have with making connections between the representations leads to a student who can claim a circle is function because it has a mathematical name in the verbal or symbolic representations and then can look at the graph of a circle and claim that it is not a function because the graph does not extend toward infinity or pass the vertical line test.
-8 -7 -6 -5 -4 -3 -2 -1 1 2
-3 -2 -1 1 2 3 4 5 6 7 8 9 10
f(x)=x2 +5x+6
Figure 2: Three representations of a function
Some students do not view the symbolic and graphical representations as descriptions of the same object (Eisenberg, 1991). When students or teachers draw or write down a function, they should realize that the picture or the symbols are only one possible
representation for the abstract concept of function, which in itself can not be experienced by the five senses (Sfard, 1991). These “different representations often illuminate different aspects of a complex concept or relationship” (NCTM, 2000), while simultaneously conveying the same information. Rather, students see the different representations as separate entities. This poses a problem for the students’ cognitive development and
understanding of the function concept. Students allowed to view the two representations as separate pieces will continue to compartmentalize their concept images and concept
definition. Moschkovish, Schoenfeld, & Arcavi (1993) discuss the need for students to come to terms with the different perspectives regarding the functions themselves, while making the connections between the representations. The two perspectives they discuss are the “process perspective” and “object perspective” (p. 71). Using a process perspective, the student is relating the x and y values, however, this relation may be represented as an equation
expression, table or graph. With an object perspective, the student views the function and its representations as entities.
Further, Mousoulides & Gagatsis (2004) claim most students correctly solve linear functions algebraically. But, the number of correct solutions drops considerably when the students are presented with quadratic functions and graphical representations. They argue that students who can effectively use graphical representations efficiently make more connections and relations within the function concept.
when considered as separate concepts (Bowman, 1993; Eisenberg & Dreyfus, 1994).
Janvier’s Star model provides an aid in helping teachers decide where the gaps or holes are in instructional methods of the function concept. Janvier’s star suggests that a definition with a single representation can not encompass all the meaning of a notion; that students need to be able to translate through the different representations to gain a richer knowledge (Janvier, 1987). It also provides a way to link the different ideas and representations of functions (Bowman, 1993; Janvier, 1987). Janvier (1987) states that when “a function is envisaged as a variable, the role of the domain is often played down if not disregarded” (p. 68). However, on the Cartesian plane the curve is a “natural illustration” of the variable and its domain. The same functions can also be represented in a variety of different settings and representations (Dreyfus & Eisenberg, 1982). Examples of these types of settings and representations can be viewed in the Dreyfus & Eisenberg (1982) study (Appendix A).
Curriculum Suggestions
Due to the fact that students’ concept images are often their only reference for
classifying functions (Tall & Bakar, 1991; Vinner, 1991), it is important that teachers provide students with experience that will help them create accurate concept images and definitions. Eisenberg (1982) stated that teachers should “provide the students with a good exposition and appropriately structured exercise to reveal various aspects of the notions, and students will understand, internalize and master the notion” (p. 140). In order to provide these different exercises, the teacher can introduce the function concept in a variety of
representations, contexts, activities, and examples (Eisenberg, 1982; Gagatsis et al, 2006; Tall & Bakar, 1991). Each of these methods has its own disadvantages as well as
advantages. For example, teaching functions using only examples and non-examples may lead students to erroneous impressions of the general concept; if the only examples are continuous functions that extend in both directions, and then the student may think that is the only type of graph for a function. Therefore, it is important for educators to use a
combination of the methods.
there is no possible way for the entire concept image to be placed in an advanced organizer. Textbooks often start the unit on functions by having the students construct tables of ordered pairs, plot these ordered pairs on the Cartesian Plane, and then connect the points to form the corresponding lines. This is a poor technique since students may not be familiar with the concept of functions; therefore, the students raise barriers against the meaning behind these constructions because they look strange. On the other hand, graphical representations and coordinate ordered pairs are familiar to the students and provide a method for introducing the function as a symbolic representation for a line. This would provide meaning for the students about the function concept and help the students develop the skills necessary to move between the different representations (French, 2002).
Mousoulides and Gagatsis (2004) claim a pure algebraic approach to functions gives students a local image of the function concept, “on the contrary, a geometric approach gives students a global approach of the concept of function” (p. 386). The geometric approach, in this case, is referring to using a graphing approach to solve problems involving functions. By having students use different representations, they can construct mental images of the functions and build a broader concept image. Using representations “has the potential [for] making the process of learning algebra more meaningful and effective” (Friedlander & Tabach, 2001).
In many classrooms, the textbook is the sole resource that teachers use. They develop lessons, retrieve exercises, and use the testing strategies from these books (Jones, 2006). Also, teachers often will use the definitions for concepts provided by the textbooks. Using these definitions without questions can cause issues for the students later, as every textbook publishes its own version of the definition. For example, the following are definitions for function found in high school and college texts.
1. “A function is a relation in which no two different ordered pairs have the same first coordinate.” (Bello, 1998, p. 124)
2. “A variable y is a function of a variable x if each value of x determines a unique value for y.” (Kime & Clark, 2001, p. 16).
3. “A function is a relation that pairs each element in a domain D with exactly one element in a range R.” (Hall, 1994, p. 502).
4. “A function is a correspondence between a first set, called the domain, and a second set, called the range, such that each member of the domain corresponds to exactly one member of the range.” (Bittinger & Ellenbogen, 1998, p. 75).
5. “A function is a correspondence that matches each input value with exactly one value of the output variable.” (Hall & Mercer, 2007, p. 133).
From examining these different definitions of the function concept, we can see that teachers who rely solely on textbooks and their definitions may miss some of the ideas behind the concept. For example, Bello (1998) has chosen to define a function in terms of ordered pairs. A student first learning this difficult concept may think that all functions have to be
represented as ordered pairs. However, Sfard (1991) suggests that defining mathematical concepts as abstract objects is not the only option, and that it might be helpful to the students to have a more concrete definition that the can build on as they encounter new ideas
connected to the function concept. Object & Process Conceptions
aspect to function sense is the use of more than one representation for the same mathematical situation” (p. 46). Students should be able to “make sense of a situation by constructing a mental process that transforms (mental) objects” (Breidenbach, et al, 1992, p. 247).
Sfard (1991) refers to student understanding of the function concept from structural and operational points of view. In an operational conception, students are thinking of transformations as process, algorithms, and actions. In the structural conception, the student can think of functions as static objects which they can manipulate (Sfard, 1991). These two conceptions are not distinct entities. For the same mathematical concept, such as functions, these conceptions are often blended together to help the student create meaning. Students often begin thinking of functions in an operational manner. For example, given f(x) = x2 + 5x +6, they want to “do something”. That something ranges from graphing the function to finding the roots often without any instruction. Students do not see f(x) = x2 + 5x +6 as an object. However, graphing a function may provide a link from the operational to structural conceptions in that the graph represents all “the infinitely many components of the function” (Sfard, 1991, p. 6) represented as a continuous smooth line. The students can see the
function as a whole on the plane.
structural conception does not occur in students without the help of teachers, it “is a lengthy, often painfully difficult process” (Sfard, 1991, p. 16).
For a student to possess an operational view of the function concept, they would still be working in a stage where computation was necessary. They would be relying on
algorithms to help them manipulate the functions, Breidenbach et al (1992) calls these algorithms and manipulations actions (p. 249). However, if the entire manipulation or transformation is internal, Breidenbach and his colleagues (1992) refer to the action as being interiorized and thus it becomes a process (p. 249).
In their study, Breidenbach et al (1992) asked pre-service teachers, “What is a function?” followed by “Give an example.” (p. 252). They then classified the participants’ answers into four categories, prefunction, action, process, and unknown. A typical
prefunction response was “I do not know”, “a mathematical equations with variables”, “a mathematical statement that describes something”, or “a social gathering”. An action response was one in which the students emphasized substituting numbers for input and output, but did not state that one starts with a value and does something to get a new value, the procedure was tied to an equation, or the input was restricted. A process response had the input, some sort of transformation, and output, but the statement was general (see
Breidenbach et al, 1992, for specific examples). Of the sixty-two responses, 64% were at the prefunction or action level, and 21% were unknown.
Researchers grouped the examples provided by the participants into eight different categories;
I. Something that could not really be interpreted as function II. Omitted
V. F(x) = some algebraic or trigonometric expression VI. Y = some algebraic or trigonometric expression VII. An algebraic or trigonometric expression alone VIII. Some attempt to describe a process (p. 253)
What is interesting about their findings is that 64 % of the participants gave examples in either category V. or VI. (p. 253). Another interesting fact is that prior to the experiment, the pre-service teachers which were questioned, only 3.7% gave a process example of function and none of them gave an example of a function in graphical form (p. 254). If the concept definitions are dispensable when students and teachers form concept images, it would not be uncommon that they could provide examples that are more complex than the definitions they provided. This is true with other concepts not related to mathematics as well. For example, if one was to ask a group of people what they thought the definition of a tree would be, there would be a variety of answers. However, those people would be able to provide may examples of trees, many of them may be more complex and encompass many of the attributes of trees than the definition they supplied. In fact, one may not even know the definition for the concept of trees, in order to provide examples. Incidentally,
It should not be surprising, therefore that some of the misconceptions students have are enriched by their teachers’ misconceptions of the function concept. These teachers do not have a well developed understanding of the subject matter. In a study by Even and Tirosh (1995), they found that teachers are able to provide definitions for functions that include the univalence requirement and they are able to classify functions and non-functions. However, further investigation into the teachers’ subject matter knowledge revealed that their knowledge of functions was shallow. (The univalence property of functions is the
correspondence of one element in the domain to exactly on element in the range.)
Breidenbach et al.’s (1992) process understanding is still at Sfard’s (1991) operational conception of function. It is not until the process is encapsulated that it becomes an object. Encapsulation occurs when an action transforms a process into an object (Breidenbach et al., 1992). However, this operational conception, while unconditionally necessary and adequate for problem solving, it can not be easily processed. It is stored “in unstructured, sequential cognitive schemata”… “it must be processed in a piecemeal, cumbersome manner” (Sfard, 1991, p. 26). This operational conception may lead to insufficient understanding of the concept.
CHAPTER 3
THEORETICAL FRAMEWORK
There is a wide range of misconceptions that students may possess when it comes to understanding the nature of functions. As a result, the framework chosen to analysis the nature of the students’ concept images had to be versatile enough to allow for all the types of misconceptions and still look at the relationship between the concept images and concept definitions. Therefore, the objective of this chapter is to discuss Vinner and Dreyfus’s (1989) study which informed the framework for the study described in this paper. This chapter will also describe the adjustments made to the categories described by Vinner and Dreyfus (1989) and how the framework was applied to this study.
Framework Background
Vinner and Dreyfus’s (1989) work focused on the concept images of 271 college students and 36 junior high school teachers. They compared the participants’ images to their concept definitions for the function concept. Their study explored the following questions:
1. What are the common definitions of the function concept given by college students before they start their calculus course?
2. What are the main images of the function concept that these students us in identification and construction tasks?
3. Are there statistically significant differences between groups of students with different majors in the way they conceive functions?
4. How frequently do students compartmentalize their formal definition of function and their image of the function concept? p. 357
The researchers separated the students into groups determined by the level of mathematics courses their chosen degrees would require. The teachers were participating in an in-service training program. The participants were asked to fill out a questionnaire concerning
problems, the fifth and sixth were construction problems and the seventh question asked the students to provide their definition for the concept function. The identification problems were designed to elicit participants’ images of function, i.e. whether or not they could identify a function. The construction problems were probing the participants’ definition of function and their ability to apply it to a particular situation. Finally, Vinner, Dreyfus and a research assistant, analyzed the answers.
The researchers categorized students’ definitions into six categories – a refinement of Vinner’s (1983) previous work and they categorized students’ concept images as revealed through their work on problems 1-6 into four categories. The six categories the researchers used to describe students’ concept definitions included: “correspondence”, “dependence relation”, “rule”, “operation”, “formula”, and “representation” (Vinner, 1983, Vinner and Dreyfus, 1989, p. 359-360).
Correspondence refers to a function in the formal definition (Dirichlet-Bourbaki definition), meaning that a function is expressed as a correspondence where every element of the domain is paired with exactly one element of the range. Dependence relations are
representation. Vinner and Dreyfus (1989) state that the “function identified, in a possibly, meaningless way, with one of its graphical or symbolic representations” (pg 360). The analysis showed that students giving some version of the correspondence category responses increased with the level of the mathematics courses that the students were taking. Also, the higher the level of mathematics required by the students’ the more correct answers and explanations they provided.
The four categories for concept images (in order of importance for considering what objects might be functions according to Vinner & Dreyfus (1989)) included: “
one-valuedness”, “discontinuity”, “split domain”, “exceptional point” (pg 361).
One-valuedness focused on assigning correspondence between exactly one value to every element of the domain. The students with this type of response primarily used a version of the formal definition. Discontinuity centered on graphs that had gaps, holes, or jumps in function. Some students would use these gaps as a reason for a graph to not be a function, while others used discontinuity as a reason for accepting a graph as a function. Split domains created graphs that may not have smooth flowing curves. Rather, the domain of the graph was split into different parts called sub-domains which may have different rules of correspondence. Again, the split domain reasoning was used for both rejecting and accepting graphs as functions. Finally, the exceptional point category focused on the graph having a point in which the given correspondence did not hold. For example, in the graph
x
y = 1, zero would
Implementation of Framework
The purpose of the current study is to determine if there is a difference in students’ understanding of the function concept by examining students’ concept images and concept definitions after the students are introduced to the function concept using different
instructional strategies, rather than to compare their concept images and definitions based on the number of mathematics classes they have taken. Findings from Vinner and Dreyfus’ (1989) research served as a framework for describing students’ understandings of function.
The framework of Vinner and Dreyfus (1989) served as a basis for categorizing the students’ concept images and concept definitions since both Vinner and Dreyfus’s study and this study collected data on college students’ understanding of the function concept. The students in this study were mostly incoming freshman.
CHAPTER 4
COMPONENTS AND METHODS
The components of the study and the methods for conducting the study will be
described will be discussed in this chapter. The study is exploratory in nature meaning that it is looking for evidence of a difference in students’ understanding of the function concept using different classroom instruction methods for introducing functions. Therefore some time will be spent describing the different students and the setting of the study. Further, the data collection process and analysis will be introduced and discussed.
Context of Study
The study was situated in an Intermediate Algebra course at a large southern urban university. Students enrolled in the course do not earn mathematics credit towards their degree, and thus it is considered a remedial course. The course focused on using technology, specifically a graphing calculator, and multiple representations to teach algebraic concepts. The students enrolled in the course must have competed at least Algebra I, Algebra II and Geometry at the high school level or in the community college. The students opting to take the course either did not take the college math placement test, placed into the course, or chose to take the course as a refresher returning to college after several years in the work place. Credit for the course is only given if the student passes the class with a C, 70% or better. Although the course does not satisfy the one of the mathematics requirement for general education requirements, the grade is calculated in the students’ grade point average.
exams and homework assignments. The students were expected to be fluent in the use of the technology and move between the three representations of functions with confidence.
Furthermore, the students were expected to look at the three representations of a function and understand their meanings, and be able to answer questions about them. By using the
graphing calculator, students were able to move through the different representations of functions with the fluency expected and focus on the interpretation of the representations.
The researcher chose to use participants from four classes taught by herself and another instructor for a variety of reasons. First, having four classes would permit greater participation in the study. Second, it initially balanced the number of students in the
treatment and control groups. Third, the instructor of the remaining sections not used in the study was not as experienced in teaching the course. This was her first year semester teaching the Intermediate Algebra courses.
The researcher has considerable more teaching experience than the instructor of the control group. The researcher spent four years teaching algebra, geometry, and technical mathematics in public high schools, one year teaching undergraduate mathematics at Indiana University, and three years teaching the Intermediate Algebra courses, for a total of nine sections. The control group instructor has no experience teaching in the public school system. However, she had taught the Intermediate Algebra for a year prior to the study. For this reason, the researcher taught the treatment classes, and the other instructor taught the control group.
using the graphing calculators as part of the instruction as well as comfortable demonstrating how to use the graphing calculators. In the planning stages of the study, the two instructors talked about the misconceptions of students’ understanding of the function concept, and possible strategies for teaching a control and treatment group.
Participants
Forty six of the 62 students enrolled in four sections of Intermediate Algebra in Fall 2006, initially participated in the study. Two sections were taught by the researcher and served as the treatment group (n =22), in which students were introduced to functions without providing a formal definition of function. In the two section serving as the control group (n=24), taught by an experienced Intermediate Algebra course instructor, students were introduces to the function concept with the use of a formal definition. However, not all of the volunteers were kept in the study.
Three of the four classes used in the study had similar demographics. Meaning, the average student was a traditional incoming freshman. The students all had similar
mathematics background in high school, and were almost split fifty-fifty by gender. These classes met during the morning hours, Monday through Friday for fifty minutes each day. The evening class had a different make-up of students as consistent with previous night classes. Many of the students in this class were older and many had previous college
mathematics courses. Most of these students were returning to school for second degrees of degrees beyond Associates. They were enrolled in the course for a refresher to mathematics. While the evening class provided a different type of student, it was still valuable to look at their concept images and concept definitions.
age. The night class traditionally provides a different variety of students in the Intermediate Algebra courses. Since many of these students are returning for further degrees, they should not be compared to traditional students as a whole, unless one is comparing the two groups understanding of function. This however was not in the scope of this particular study. Instruction Sequence
The instructor teaching the treatment group was the researcher. She used an alternative method to the formal definition for introducing the function concept (Appendix B). This included allowing the students to create their own classroom definitions for the function concepts, as well as presenting a variety of functions and non-functions for them to apply their definition to. The students in the treatment classes created their own definition of function based on their prior experiences, concept images, examples and non-examples provided by the instructor, and classroom discussion. Initially, the definition started out vague. However, it was gradually expanded to include all the necessary parts.
The control group instructor taught the function concept by introducing a formal definition. This definition was taken from the textbook: “A function is when exactly one element in the range corresponds to each element in the domain” (S. Wilson, personal communication, October 3, 2006). See her lesson outline in Appendix C. The students used this definition and the vertical line test while looking at several examples and non-examples to determine whether or not they were functions.
definitions, and the control classes used the formal definition from the textbook. The course focused on using multiple representations, therefore these representations were used in all classes to present functions in alternative ways to the symbolic notation, in particular, graphs and tables. The students were all assessed using the same quizzes, tests, and homework assignments. The students in all the classes were also provided the same review assignments to help them prepare for quizzes and exams. The three morning classes followed the same schedule throughout the semester. The night class followed a faster paced schedule, since they met three days a week instead of five.
The biggest difference in the classes was the teaching style of the two instructors. The instructor of the control groups presents the material in an organized and methodical manner. She uses a variety of graphs, tables, drawings and other visual aides to supplement the lecture and to ensure student understanding. While the instructor of the treatment classes also uses a wide range of representations, the class discussed the different concepts and produced definitions based on the discourse. The instructor of the treatment group was more flexible in the order of the material covered and often allowed the students to dictate the direction of the class.
Data Collection Instrument
The instrument used to help determine the students’ concept images and concept definitions and therefore their understanding of the function concept was a questionnaire. The questionnaire surveyed the students’ knowledge of identifying functions in three different representations, their ability to use a definition of function to construct functions from a verbal representation, and the students’ definition for what a function is. This questionnaire was similar to the questionnaires used by Vinner and Dreyfus (1989), as well as Hitt (1998).
The first part of the survey asked the students to identify functions and non-functions in three different representations; graphical, tabular, symbolic. The purpose of these
questions was two-fold. First, to gain understanding of the students’ evoked concept images, and to determine in which representation the students were able to classify functions and non-functions more accurately. The second part, asked the students to interpret verbal expressions and determine if these expressions represented functions. Finally, the last question asked the students to provide a definition for the function concept. The first two parts of the questionnaire to designed to help the researcher determine possible categories for students’ concept images. The last section was designed to determine the students’ concept definition.
explanations on why each of the questions was chosen. Table 1: Justifications of Survey Questions
Representation Question Justification for Using
-6.28319 -3.14159 3.14159 6.28319
-4 -3 -2 -1 1 2 3 4
Sine Function: f(x) = sin (x)
This was a nice continuous graph with a mathematical name and is easily
recognized by students with some trigonometry
background.
-10 -8 -6 -4 -2 2 4 6 8 10
-10 -8 -6 -4 -2 2 4 6 8 10
Rational Function: f(x) = 1/x
This graph represents a discontinuous function, and was representative of the functions graphed by the students in their rational function chapter.
-5 -4 -3 -2 -1 1 2 3 4 5
-5 -4 -3 -2 -1 1 2 3 4 5
Circle: x2 + y2 = 4
To test the misconception that a named curve is a function.
Graphical
-10 -8 -6 -4 -2 2 4 6 8 10
-10 -8 -6 -4 -2 2 4 6 8 10
Rational Function: f(x) = 4 3 2 − − x x
This graph was chosen to address the misconceptions involving continuity. The students in these particular classes should have recognized both rational curves as functions without being told
x y1(x) -5 -4 -3 -2 -1 0 1 2 3 4 5 6 7 8 9 56 42 30 20 12 6 2 0 0 2 6 12 20 30 42
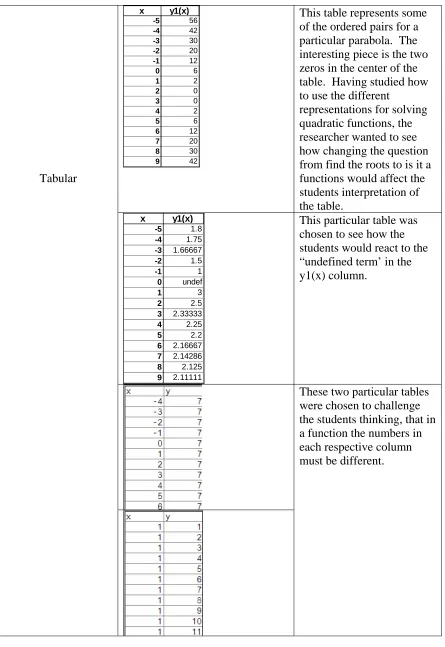
This table represents some of the ordered pairs for a particular parabola. The interesting piece is the two zeros in the center of the table. Having studied how to use the different
representations for solving quadratic functions, the researcher wanted to see how changing the question from find the roots to is it a functions would affect the students interpretation of the table. x y1(x) -5 -4 -3 -2 -1 0 1 2 3 4 5 6 7 8 9 1.8 1.75 1.66667 1.5 1 undef 3 2.5 2.33333 2.25 2.2 2.16667 2.14286 2.125 2.11111
This particular table was chosen to see how the students would react to the “undefined term’ in the y1(x) column.
Tabular
2 y x= 4 − = x y
y = 2x + 5 12 4 3 2 − +
= x x
y
The first four questions were used to find out if students would be able to recognize square root, linear, and quadratic functions as well as curves that are not functions. For the first problem, the students in the study would have thought x was still the independent variable. This has to do with the fact that the students used graphing calculators throughout the course. Symbolic ⎩ ⎨ ⎧ = 0 1 y
This question was used to test their concept definition. Most of the students would not have seen functions of this sort.
The next three questions asked the students to use their concept images and definitions to construct a function from a verbal representation. Since the students did not answer these construction questions, they were removed from the analysis. The final question asked the students to provide their definition for a function. The questionnaire asked students to provide justification for all of their answers in the form of a few words or a sentence.
The instructor of each of the classes gave the questionnaires during a regular classroom session and the students completed them during that time.
Analysis
Initially, all questionnaires collected were analyzed, including those where the student(s) replied with question marks or “I don’t know”. Later, the researcher decided to remove those questionnaires from the study in which the students did not take the questions
seriously and the questionnaires in which every answer was “I don’t know”. The researcher did not feel that the students who responded with justifications such as “No, really!” would improve the knowledge base of research on students’ understanding of the function concept. Also, students whose answers were simply that they did not know, may not have had enough time to complete the questionnaire, did not take the questionnaire seriously, or simply did not know the answers to the questions. In any case these students were left in the study and included in the analysis. Further, there is a gap between being able to answer a mathematical question and being able to communicate why that particular answer was chosen. Therefore, questionnaires with answers and not justifications were also kept in the analysis.
The questionnaire asked the students to identify functions and non-functions, as well as, to provide justification for the decisions. The identification of functions and
non-functions was based on correct yes or no responses. For each representation, the students were given four graphs and tables and five equations, in which to classify as functions or not. By looking at the responses in each of the two groups, the researcher was able to find a percentage of correct answers in each of the representations for both the treatment group and the control group. The questionnaire was scored as either having correct answers or incorrect answers for each of the representations during this part of the analysis. There was not an analysis for comparing total scores on the questionnaire for the treatment and the control groups.
student incorrectly labeled the fourth table as a function, the researcher was interested in knowing why they thought that was a function. Based on the justification, they could be “placed” into a category representing their concept image. The justifications were not scored per se. Rather the researcher grouped the justifications into respective types and these types were compared to the categories adopted from Vinner and Dreyfus’s (1989) framework. The definitions provided by the students were also grouped according to the categories from Vinner and Dreyfus (1989).
The questionnaire responses were analyzed using both Excel and Fathom. Fathom is a statistical software program that will create graphs, calculate statistical measures, and perform tests on data. The data can be entered by hand or imported from other spreadsheets such as Excel. The software has some unique features that allow the user to click on pieces of a specific histogram and see where those students fell in the other graphs or on in the table. Excel was used to help organize the data and look at relationships students have between their concept images and concept definition.
The researcher looked at the answer to each of the questions and then the
-10 -8 -6 -4 -2 2 4 6 8 10
-10 -8 -6 -4 -2 2 4 6 8 10
Figure 3: Continuity Linked to Functions
If we look at one of the definitions: “f(x), what is the equation that will solve or x.” Here, one can see that the student does not have a clear understanding of the definition of a
function. The researcher would categorize this definition as a “formula”, because the student has demonstrated that they desire a rule that will allow them to solve for x.
The questionnaire provided the researcher the opportunity to formally investigate the students’ understanding of function after several weeks of instruction. The students provided their justifications and definitions for the function concept. The students’ responses provide a brief snapshot of their concept images, and understanding. It is by no means an entire summary of what they believe to be true about functions.
students only evoke parts of the image when considering problem solving approaches and solutions to problems.
After classifying students’ understanding of the function concept, the researcher looked to see if there was a difference in the students’ understandings based on the instruction of the class. To help the researcher find differences in the students’
CHAPTER 5 ANALYSIS
The results and the findings of the study are presented in this chapter. They describe the results for the two different groups as well as a comparison between the two groups. The chapter will start with an overall analysis of the students’ accuracy on the questionnaire. It will then describe the findings after looking closer at comparing the two groups. The justifications which the students used will be examined and described. Finally, the researcher will look at comparing the students’ concept images and concept definitions.
The treatment class spent a period discussing in small groups and answering the question “what is a function?” From their work, conversations, and whole class discussion the following definition was reached: “a function is a relation that provides an association between the domain of a set and the range, and it passes the vertical line test and the x-values do not repeat.” While this definition does not encompass the mathematical terms found in textbook definitions, it does a reasonable job of providing a basis for which the students can determine if a relation is a function. The students’ definition is very concrete; it uses a testing strategy for part of the definition. However, the vertical line test is useful for the graphical representation. This means that to employ this definition the students in the treatment courses are going to have to use multiple representations for determining if a relation is a function. For example, if given y =
) 7 )( 4 ( 3 ) 2 ( − + − x x x
they are going to have to
non-integer numbers to integer numbers. None of the students tried to produce a graphical interpretation of this problem, they either gave an answer without a justification or the abstained from answering the question.
Initially, the researcher checked the questionnaires for correct answers. However, some of the participants were removed; one of the treatment classes, specifically the night class, had a large percentage of non-traditional students enrolled. The researcher decided to eliminate these participants also from the sample, as several of these students already had degrees, and one was a high school mathematics teacher.
Overall Analysis of Accuracy of Responses
Table 2
Percentage of Correct Answers Type of
Question
Treatment Group (N=15)
Control Group (N=22)
Graphs 70.31% 82.95%
Tables 65.63% 80.68%
Equations 57.81% 50.90%
Table 3
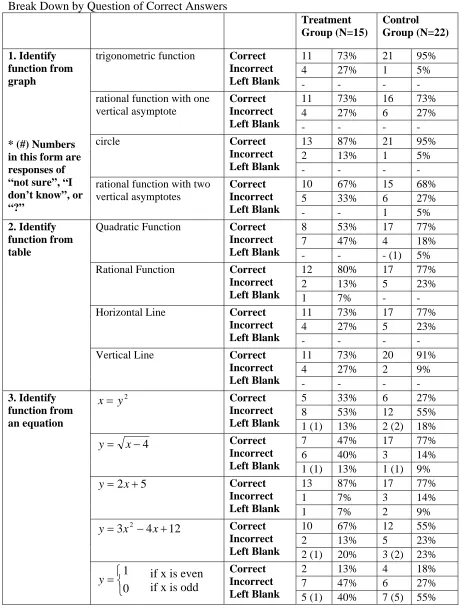
Break Down by Question of Correct Answers
Treatment
Group (N=15)
Control Group (N=22)
11 73% 21 95%
4 27% 1 5%
trigonometric function Correct Incorrect
Left Blank - - - -
11 73% 16 73%
4 27% 6 27%
rational function with one vertical asymptote
Correct Incorrect
Left Blank - - - -
13 87% 21 95%
2 13% 1 5%
circle Correct
Incorrect
Left Blank - - - -
10 67% 15 68%
5 33% 6 27%
1. Identify function from graph
* (#) Numbers in this form are responses of “not sure”, “I don’t know”, or “?”
rational function with two vertical asymptotes
Correct Incorrect
Left Blank - - 1 5%
8 53% 17 77%
7 47% 4 18%
Quadratic Function Correct Incorrect
Left Blank - - - (1) 5%
12 80% 17 77%
2 13% 5 23%
Rational Function Correct Incorrect
Left Blank 1 7% - -
11 73% 17 77%
4 27% 5 23%
Horizontal Line Correct Incorrect
Left Blank - - - -
11 73% 20 91%
4 27% 2 9%
2. Identify function from table
Vertical Line Correct Incorrect
Left Blank - - - -
5 33% 6 27%
8 53% 12 55%
2 y
x= Correct
Incorrect
Left Blank 1 (1) 13% 2 (2) 18%
7 47% 17 77%
6 40% 3 14%
4
−
= x
y Correct
Incorrect
Left Blank 1 (1) 13% 1 (1) 9%
13 87% 17 77% 1 7% 3 14% 5
2 +
= x
y Correct
Incorrect
Left Blank 1 7% 2 9%
10 67% 12 55%
2 13% 5 23%
12 4 3 2 − +
= x x
y Correct
Incorrect
Left Blank 2 (1) 20% 3 (2) 23%
2 13% 4 18%
7 47% 6 27%
3. Identify function from an equation ⎩ ⎨ ⎧ = 0 1 y Correct Incorrect
Left Blank 5 (1) 40% 7 (5) 55%
From the tables and looking at the percentages resulting from this study, there does not appear to be any significant difference in college algebra students’ ability to determine if relations are functions in the three representations, when the concept is introduced using different instructional approaches. The classes with the alternative instruction method (treatment group) did comparably well when compared to the control group when classifying functions in their different representations. In fact, the treatment group did slightly better than the control group with three of questions using the symbolic representation. However, by examining the separate questions and considering the questions that were left blank; the two groups appear to have similar notions of the function concept in terms of being able to identify functions and non-functions.
At an initial glance, the treatment group provided more justification for their answers and a wider range of definitions. The researcher categorized the justifications by simply looking to see if the students provided an explanation for their answer and what category this justification would have fallen into. Also, the treatment group provided a wider variety of types of definitions in the way that they worded the justifications and the different categories according to Vinner and Dreyfus (1989).
Digging Deeper in Comparing the Two Groups
Only comparing the treatment and control group with percent correct in each question does not portray the potential variability that may exist within a group and among the
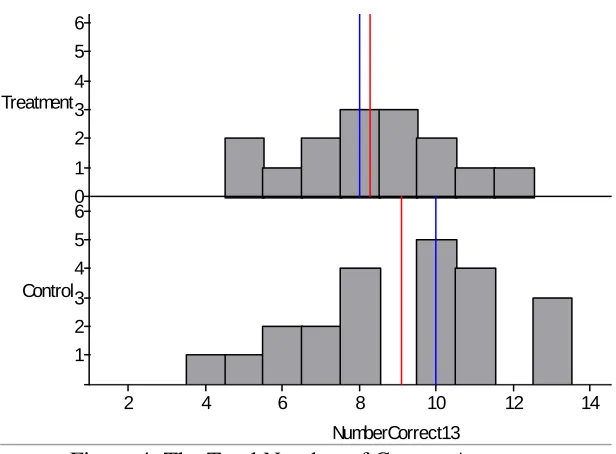
and 5 symbolic). The vertical lines on the histogram represent the mean (red) and median (blue). By looking at the graph, one can see that the means for each group are close together. The treatment group mean is 8.27 correct responses and the mean for the control group is 9.09 correct answers.
1 2 3 4 5 6
Control 0 1 2 3 4 5 6
Treatment
NumberCorrect13
2 4 6 8 10 12 14
8 6 6Figure 4: The Total Number of Correct Answers,
The red line is the mean, and the blue is the median.
There is an obvious split in the control group’s number of correct responses. This split could indicate that in the control group the students either had a reasonably accurate concept image of functions or they did not have a good grasp on the concept. The treatment group’s responses are more evenly spread across the range of the data set. The number of students with 9 or more correct answers in the treatment group is 7 or about 47%. The number of student with 9 or more correct answers in the control group is 12 or about 55%.
knowledge of function in all three representations used on the questionnaire. However, the split in the control group’s responses suggests that the control group students understanding may have been limited to specific representations for some of the students. This will be discussed further in a comparison of the concept images and concept definition.
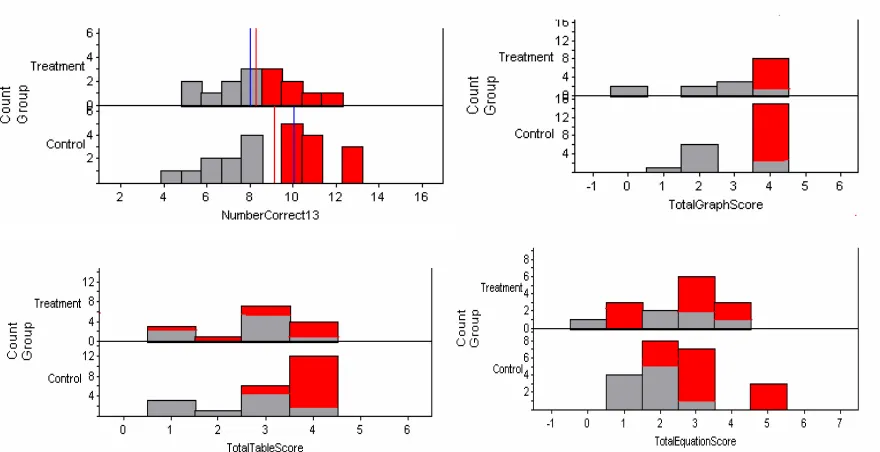
It is interesting to note that all of the students in both groups, who got nine or more of the questions correct, also got all four graphing questions correct. This accounts for all but two of the fours in the following figure (Figure 5). In these histograms, the red line indicates the mean values of correct answers for the two groups. The other two students who also answered the graphical question correctly, one in the treatment group and one in the control group, answered 8 of the 13 survey questions on representations accurately.
p
6 12 Control
0 6 12 Treatment
-1 0 1 2 3 4 5 6
TotalGraphScore Figure 5: Graph Scores
broken” or “it is not continuous”.
In the treatment group, of the two students who did not answer any of the graphical questions correctly, one of them had an inaccurate concept image. The justification that this particular student used was “if the x-axis is crossed more than once, it [the curve] is not a function.” The other student used the vertical line test as their justification, but it may be that this student did not understand what the purpose of the vertical line test is or did not
understand the nature of vertical asymptotes.
Figure 6: Comparison of Total Correct Answers Across Representations
Of the students that answered nine or more questions correctly, they identified all four of the graphs as representing either functions or non-functions (as seen in the graph in the top right corner). In the control group, these students were able to identify at least three of the tables as representing functions or not. Most of the students in this group also correctly identified three or more of the symbolic representations as functions or non-functions. By examining the distribution of the red color in the control group, it seems that a group of these students could apply their concept images to the three different representations with some consistency. However, the other members of the group seem to have demonstrated a lack of accuracy when applying their concept images.