Development
Tom Potok
IBM Corporation
Mladen Vouk
North Carolina State University
Introduction of object-oriented technology does not appear to hinder overall productivity on commercial projects, but it neither seems to improve it in the first two product
generations. In practice, the governing influence may be the business work flow and not the methodology.
As software development cycles become shorter, and software markets become more competitive, the software industry is, yet again, faced with a productivity crisis. There are many who believe that object-oriented software development is the solution to this problem. Therefore, it is quite surprising to see how sparse the quantitative evidence is on the subject of productivity of object-oriented software development.
Evidence
There is surprisingly little quantitative evidence that productivity of object-oriented software development is indeed consistently better than that of "classical" procedural software development in a commercial environment. Published evidence appears to derive primarily from productivity studies made in non-commercial environments under non-commercial business models, and the scalability of the results to commercial environments is not clear.
For example, Lewis et al.1 performed an experiment with undergraduate software engineering students to study the effect of reuse. Based on their productivity metrics Lewis et al. concluded that the object-oriented paradigm can improve productivity when reuse¶ is present by about 50% (about 1.5 times). However, they did not find any statistically significant evidence that object-oriented paradigm has higher productivity than procedural methods when reuse is not a factor. Melo et al.2 also conducted an experiment with graduate students that yielded seven projects ranging is size from 5000 - 25000 lines of code. The projects were developed using the
Waterfall process model, object-oriented design, C++, and varying levels of reuse. Their results support the conclusion that reuse rates can increase programmer productivity by as much as two to three times§. However, at what level reuse becomes cost-effective is still an open question. Optimistic economic models3 of reuse indicate that break-even reuse levels may be as low as 10-20%, while pessimistic models4 contend that cost-effective levels of reuse may be much higher and difficult to achieve. There is also evidence that other factors may confound the picture. For example, different development methodologies may impact software development productivity in ways other than through reuse. Boehm-Davis et al.5 report on a comparison of Jackson program design, object-oriented design, and functional decomposition. They found that Jackson’s method and object-oriented methodologies produce more complete solutions, require less time to design and code a problem, and produce less complex designs than functional decomposition. However, a quantitative comparison of productivities associated with different methodologies was not given. Similarly, Zweben et al.6, again in an experiment with graduate and undergraduate students, show that language-based layering and encapsulation (an object-oriented trait) may reduce software development effort. There are many other studies concerned with the value of object-oriented approach but most are not quantitative in nature.
Recent work by Hansen correctly asserts that software development must first be viewed as a business.17 The referenced productivity studies focus on the productivity effects of object-oriented technology isolated from the effects of a typical business work flow. Noticeably absent are convincing quantitative studies that focus on productivity related to object-oriented software developed by professional programmers under commercial business models. It is not difficult to understand that, although many industrial organizations claim to practice object-oriented software development, many practicing software engineers and managers are quite cautious on the subject of object-oriented productivity. In fact, it would appear7 that many organizations
¶Estimated re-use level may have been as high as 25% in some cases.
simply do not systematically measure software reuse (and the associated productivity) and therefore may not have more than anecdotal evidence for or against object-oriented productivity gains.
Productivity
Productivity can be measured in many ways. A traditional approach is to use project size or amount of functionality, e.g., in lines of code (LOC) or function-points, and divide that by the time or effort spent developing the code. In an object-oriented environment, LOC may not be an appropriate metric for software size or functionality. In fact, in a commercial situation there are many other factors besides the size that impact software costs and productivity, particularly if issues, such as the marketing, staff training, applied research, long-term maintenance and customer support are taken into account. None of these extra factors reflect in traditional LOC metric, but do require expenditure of effort. Unfortunately, in practice LOC is often the only available metric. Therefore, we will define productivity in terms of developed/changed LOC, but with an understanding that the effort (or time) expended may include many non-coding activities that are necessary in viable commercial product.
We define average software productivity of a software team by the following relationship:
Team Productivity = Project Size
Project Ef fort (1)
The average programmer productivity is the team productivity divided by the number of programmers on the team. If we let the project size be in thousands-of-lines-of-code (KLOC), and the project duration be in months, then (1) can be re-stated as
Project Ef fort = Project Size(KLOC)
Programmer Productivity (2)
The above equation implies a linear relationship between the effort and size of a project, but practice shows that the size and productivity of a software team often varies over the duration of a project, and that average programmer productivity is a non-linear function of a number of factors. For example, Walston and Felix of IBM pioneered the use of regression analysis to model software project cost and productivity8. They report 29 factors. Boehm developed the COnstructve COst MOdel, usually called COCOMO9. This model provides a way of estimating the effort required for a project and the duration of a project. COCOMO is probably the most widely used cost model currently available†. Boehm defines three types of software projects and 15 factors (or drivers) that strongly influence development costs. In the COCOMO model the factors are grouped into four categories: product attributes, computer attributes, personnel attributes, and project attributes. On the other hand, Bailey and Basili15 propose 21 cost factors
† COCOMO is being revised. New version, COCOMO 2.0, will include object-orientation. Information on COCOMO 2.0
grouped into three categories: total methodology, cumulative complexity, and cumulative experience.
For each COCOMO project type Boehm developed models relating effort, size (KLOC), and development time:
Effort = α(Size)β (3)
Duration = γ(Effort)δ (4)
Other researchers used similar models. The parameters α, β, γ, and δ can be determined in a number of ways, but frequently it is by regression on the loglinear version of these models. For example,
ln(Effort) = ln(α) + β ln(Size). (5)
The typical experience with this type of model is that β>1, i.e., larger projects have lower productivity than smaller projects. The sublinear form of the model (β<1), which implies economy of scale, is less common, but it has been reported on some projects.9-13 Furthermore, "common" wisdom is that any compression of schedules below some nominal value dramatically increases effort thus lowering productivity. This effect is questioned by Kitchenham12 and Jeffery et al.14 who note that nominal schedules may not be optimal and a reasonable schedule
compression, in fact, may increase productivity. Looking beyond software development, industrial psychology literature reports broad, and significant evidence that productivity increases with specific, challenging goals.16
Data
*The empirical data discussed in this paper was collected at the IBM Software Solutions Laboratory in Research Triangle Park, North Carolina. This laboratory employs about 650 people, with approximately 90% being directly involved in software development. The laboratory was ISO 9000 Certified in 1994, and has consistently received high marks in internal assessments against the Malcolm Baldrige Criteria.
We examined 19 commercially available software products developed at this laboratory. Eleven were developed using object-oriented methods, and eight using traditional procedural methods. All object-oriented projects involved either first or second generation products, while all procedural projects dealt with second or higher generation of the product.
Four of the object-oriented products were inter-platform software ports. Five projects were developed for mainframe use, and fourteen for workstation use. The products range in size from
*Data used by permission. The scales appearing on the axes of all graphs, and any product and date-related information,
about 1 thousand (KLOC) to about 1 million lines-of-code, (the analyses are limited to the actual new and changed code developed in-house). Project development duration is recorded in calendar months from the time when the project is officially funded to the first customer shipping date. The effort is reported in person-years and includes the effort of the programmers, testers, writers, planners, managers, and vendors. In this number is also included a person-year equivalent for purchased software. For example, if software was purchased for $300,000 and the average programmer cost in $150,000 per year, then this purchase would be equated to two person years of effort. Software reuse data was not available.
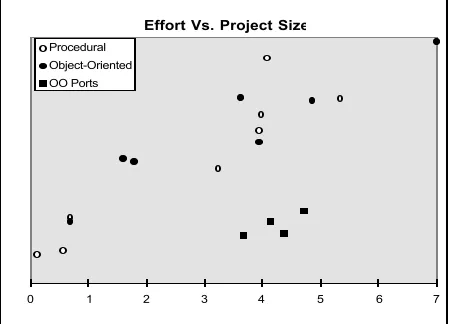
Effort Vs. Project Size
0 1 2 3 4 5 6 7
Procedural Object-Oriented OO Ports
Figure 1 A plot of effort vs. size for procedural, object-oriented, and object-oriented port projects.
Empirical Productivity
In Figure 1 we plot the logarithm of the product effort versus the logarithm of the product size, see equation (5). The hollow circles represent the products developed using procedural methods, the solid circles represent the products developed using object-oriented methods, and the solid squares represent the products developed by porting design and code from existing products that were developed using object-oriented methods.
during the port of object-oriented software may be a good reflection of the possible gains the technology offers if reuse is the key productivity driver.
To examine the issue further we applied the following regression model to the non-ported data:
Y = α + β1X1 + β2X2 + β3X1X2 + ε (6)
where Y is the ln(Person-Months), X1 is the ln(KLOC), and X2 is a class variable that indicates the development method. This relationship provides a single regression model for the full data, and a means of testing whether two models are needed. Analysis shows that α is about 4.4 and
β1 is about 0.49. The hypothesis that β2 and β3 are both equal to zero was tested (F-test) and
was not rejected at 5% significance level. Therefore, in this case, one regression equation is sufficient to model both procedural and object-oriented products that were in the non-port category. In other words, this indicates that for this data there is no statistically significant evidence that the productivity of object-oriented software development and procedural software development differ. As expected, a similar evaluation of the data on ported software vs. other software shows a significant difference between the two. It is good news that introduction of object-oriented technology does not appear to carry excessive productivity penalties, a fear that some managers may have. It is less welcome, but probably not so surprising, that there is no obvious productivity gain in the first and second generations of object-oriented projects.
However, an explicit analysis of project staffing and productivity characteristics shows some puzzling relationships. For example, Figure 2 shows the plot of the logarithm of team productivity vs. the logarithm of product size (changed or modified KLOC). We see that team productivity (expressed as KLOC/person-month) appears to increase with project size. This observation seems contrary to observations often reported in the literature, namely that software development suffers from a diseconomy of scale.
An explanation may be that there is a large but constant overhead associated with all projects or that smaller projects are, for some reason, overstaffed. Although we did find evidence that for smaller projects staffing loads were more generous than for larger projects, there was no evidence of large systematic project overhead, nor of the need to have smaller projects better staffed because of product complexity issues. However, there was evidence‡ that the business model may dictate larger teams for certain types of smaller projects, namely intermediate product releases, to preserve continuity of skills and expertise between large releases of the product. While this may provide a partial explanation for the first six small projects, it does not really explain the productivity growth observed for larger projects. One could also argue that larger projects have stronger development teams which accounts for the economy of scale. This also is not supported by the data. Development teams had roughly the same experience and skill level throughout the organization.
Team Productivity Vs. Project Size
0 1 2 3 4 5 6 7
Figure 2. Team productivity vs. project size.
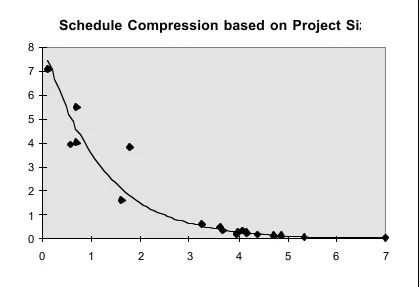
Schedule Compression based on Project Size
0 1 2 3 4 5 6 7 8
0 1 2 3 4 5 6 7
Figure 3. A schedule compression effect.
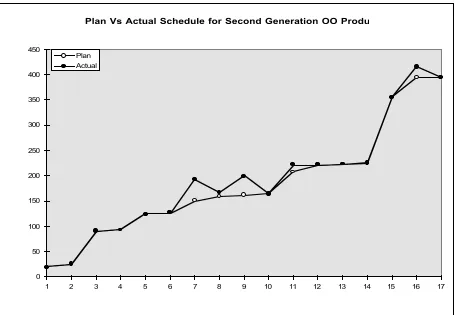
Plan Vs Actual Schedule for Second Generation OO Product
0 50 100 150 200 250 300 350 400 450
1 2 3 4 5 6 7 8 9 10 11 12 13 14 15 16 17 Plan
Actual
Figure 4. Second generation object-oriented project. The actual (solid circles) and planned (hollow circles) project duration vs. milestone number.
Business Model Drivers
As mentioned earlier, investigated software was developed in an environment that recognizes two major software project sub-categories: new version releases, and maintenance releases. The size of a maintenance release is usually smaller than "new version" release, and while the duration of a maintenance release is shorter this reduction is not in proportion to size change. While all new development must be completed with a limited number of personnel, existing projects will have an established team, and typically an effort is made to maintain or even increase the size of the team because it may not be cost-effective to totally dismantle a product software team between "new version" releases. So, it is not unusual to have a maintenance releases developed over a more relaxed schedule using the original team.
However, both categories were subject to frequent high-level reviews of their schedule status against key development dates (or milestones) established at the beginning of development. The progress towards these dates was reviewed regularly and in detail, and schedule slips in these major milestones were strongly discouraged. This approach , which may be quite common in software industry, leads us to believe that to fully explain effects such as those seen in Figures 3 and 4, we need to consider drivers that may not normally be part of a cost model. Namely, the business model milestones in combination with two human related effects, the Parkinson Law9, and the Deadline Effect9,18.
The Parkinson’s Law states that work will expand to fill the allocated time. The Deadline Effect is when programmers are compelled to work extra time to complete a task by a given deadline. These effects are supported by goal theory from industrial psychology. This theory states the productivity will increase with specific, challenging goals, over “do your best” goals. As of 1990, over 400 experiments have been performed testing this theory, with over 90% supporting it.16 With fixes to errors, and small functional enhancements, it is possible to overestimate effort to maintain the team size. This can result is a lax schedule. According to Parkinson’s Law and goal theory, in a situation like that the software team will not finish early but will finish according to the schedule, which may result is low nominal productivity. Conversely, large enhancements, and new products often overcommit function which can lead to aggressive schedules. The Deadline Effect and goal theory show that, up to a point, people will increase their productivity to meet the schedule. To state this in simpler terms, the productivity of the projects appears to be driven by schedule.
Object-Oriented Productivity
Like Hansen,17 we believe that in a commercial software development environment the primary
controlling influence is probably the business model and its major milestones. To study this we developed simulation models that explore the interactions between the business model deadlines and the software methodology and process models10,19.
In our case, the business model is expressed as a series of “soft” and “hard” schedule milestones. Software development operates within the constraints imposed by these milestones. A “hard” milestone must be met, or strong negative consequences result. A “soft” milestone can slip so long as the next hard milestone is achieved. Goal theory clearly shows that productivity is higher for an aggressive schedule, and lower for a lax schedule
.
16 For an aggressive schedule the deadline pressures require people to work over-time and weekends to meet project milestones. For lax schedules, Parkinson’s effect will fill programmers working hours with legitimate work which, however, may not be directed at early completion of the project at hand, thus lowering the apparent overall productivity rate.Project Duration without schedule effects
0 0.01 0.02 0.03 0.04 0.05 0.06
26 29 32 35 38 41 44 47 50 53 56 59 62 65 68 71 74 77 80 83 86 89 92 95 High Productivity
Normal Productivity
Figure 5. Duration distributions for high and low productivity projects conducted without milestone constraints.
We illustrate the impact of “hard” and “soft” deadlines by showing simulation results for two hypothetical projects operating under four business models. One project has “normal” productivity range, the second project differs from the first one only in that it has productivity that has upper bound which twice as large as the “normal” productivity upper bound. Both have the same lower bound on the productivity. The normal range can be considered procedural development, and the high productivity range can be considered as object-oriented development with high levels of reuse, so, in text below, we will sometimes refer to the high-productivity project as the “object-oriented project” and to the other one as the “procedural project”. When a business model is applied, both projects operate under the same milestones and the same constraints (MDRs). When Parkinson’s Law is in effect, MDR lower bound is no earlier than one week before the deadline. When the Deadline Effect is active, MDR upper is the same as the actual deadline. These restrictions are consistent with our empirical data.
model were obtained by simulation and are shown in Figure 5. From the position of the peaks in the two curves, we see that a "typical" high productivity project would be expected to finish well before (about week 60) a typical "normal productivity" project (about week 71). Furthermore, there is a much higher probability that week 50 milestone will be achieved by our hypothetical object-oriented team than by the procedural team.
Project Completion with Parkinson's Law
0 0.01 0.02 0.03 0.04 0.05 0.06
49 52 55 58 61 64 67 70 73 76 79 82 85 88 91 94 Relative Frequency
High Productivity Normal Productivity
Figure 6. A comparison of high and normal productivity project completion distributions with Parkinson’s Law applied
Project Completion with Deadline Effect
0 0.05 0.1 0.15 0.2 0.25 0.3 0.35 0.4
26 28 30 32 34 36 38 40 42 44 46 48 50 High Productivity
Normal Productivity
Figure 7. A comparison of high and normal productivity with only the last deadline held fixed.
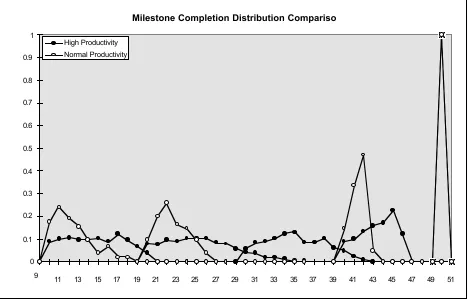
Milestone Completion Distribution Comparison
0 0.1 0.2 0.3 0.4 0.5 0.6 0.7 0.8 0.9 1
9
11 13 15 17 19 21 23 25 27 29 31 33 35 37 39 41 43 45 47 49 51 High Productivity
Normal Productivity
Figure 8. A comparison of high and normal productivity with Parkinson’s Law applied, and the last deadline held fixed.
obvious that under this regime there may not be any visible productivity gains from the higher-productivity methodology for the project as a whole. However, again the benefits may be lowered stress on the software teams, and possibly better quality of the products since the higher productivity teams may have more time to pay attention to, for example, verification and validation details that often fall victim to schedule enforcement.
Summary
Our result indicate that in a commercial environment there may not be a consistent statistically significant difference in the productivity of object-oriented and procedural software development, at least not for the first couple of generations of an object-oriented product. The reason may be low reuse level, but it could also be the underlying business model. Investigation of 19 commercial products has shown an unusual economy of scale for both object-oriented and procedural software that is difficult to explain with traditional productivity drivers. However, a reviewing the underlying business work flows has suggested that business deadlines may strongly influence the overall productivity. In an environment where a typical delivery cycle for product versions or release is of the order of 12-24 months it may be more economical to preserve development team skills and expertise by keeping them together whether they operate under the new release or maintenance schedules. This may produce aggressive schedules for new releases, and lax schedules for maintenance releases. Aggressive schedules are influenced by the Deadline Effect which raises apparent productivity, while lax schedule are under the Parkinson’s Law which lowers apparent productivity. A review of detailed schedule analysis for three products provided empirical support to this explanation. Simulations of projects with two levels of productivity shows that business work flows can play a key role in realizing the potential productivity benefits from a new technology such as object-orientation. Investments in technology that increases productivity can be lost unless the underlying business work flows are adjusted to take advantage the improved software development capabilities.
References
1. A. Lewis, S. M. Henry, and D. G. Kafura, "An empirical Study of the Object-Oriented Paradigm and Software Reuse," Proceedings of the Conference on Object-oriented Programming Systems, Languages and Applications, 1991, pp. 184-196.
2. W. L. Melo, L. C. Briand, and V. R. Basili, “Measuring the Impact of Reuse on Quality and Productivity in Object-Oriented Systems, ”Technical Report, University of Maryland, Dep. Of Computer Science, Jan. 1995, CS-TR-3395.
3. B. Henderson-Sellers, "The Economics of reusing Library Classes," Journal of Object Oriented Programming, Vol. 6, No.4, 1993, pp. 43-50.
4. D. Schimsky, "Software Reuse Some Realities," Vitro Technical Journal, Vol. 10, No. 1, 1992, pp47-57.
6. S. H. Zweben, S. H. Edwards, B. W. Weide, and J. E. Hollingsworth, “The Effects of Layering and Encapsulation on Software Development Cost and Quality,” IEEE Transactions on Software Engineering, Vol.21, No.3, 1995, pp. 200-208.
7. Frakes, W.B. and Fox, C.J., (1995). "Sixteen Questions about Software Reuse," CACM,
Vol. 38(6), 75-87.
8. C. E. Walston and C. P. Felix, “A Method of Programming Management and Estimation,” IBM Systems Journal, Vol.16, No.1, 1977, pp. 54-73.
9. B. W. Boehm, Software Engineering Economics, Prentice-Hall, Inc. Englewook Cliffs, N.J., 1981.
10. T. E. Potok and M. A. Vouk, “Development Productivity for Commercial Software Using Object-Oriented Methods,” Proceedings of CASCON’95, 1995.
11. S. E. Elmaghraby, E. I. Baxter, and M. A. Vouk, “An Approach to the Modeling and Analysis of Software Production Process,” International Transactions in Operational Research Vol.2, No. 1, 1995, pp. 117-135.
12. B. A. Kitchenham, “Empirical Studies of Assumptions that Underlie Software Cost-estimation Models,” Information and Software Technology, Vol.34, No.4, 1992, pp. 211-218.
13. R. D. Banker, C. Hsihui, and C. F. Kemerer, “Evidence on Economies of Scale in Software Development,” Information and Software Technology, Vol.36 No.5, 1994, pp. 275-282.
14. Jeffery, D. R. and Lawrence, M. J. “Managing Programming Productivity,” The Journal of Systems and Software, Vol.5, 1985 pp. 49-58.
15. J. W. Bailey and V. R. Basili, “A Meta-Model for Software Development Resource Expenditures,” Proceedings of the Fifth Internations Conference on Software Engineering, 1981, pp. 107-116.
16. E. A. Locke and G. P. Latham, A Theory of Goal Setting and Task Performance, Prentice Hall, Englewood Cliffs, N.J., 1990.
17. G. A. Hansen, “Simulating Software Development Processes,” IEEE Computer, Vol.29, No.1, 1996, pp. 73-77.
18. D. S. Borger and M. A. Vouk, “Modeling the Behaviour of Large Software Projects,” Center for Communications and Signal Processing Technical Report, NCSU, TR-91/19, 1991.
19. T. E. Potok and M. A. Vouk, “The Effects of the Business Model on Object-Oriented Software Development Productivity,” submitted for publication to IBM Systems Journal.