Volume 8, No. 5, May-June 2017
International Journal of Advanced Research in Computer Science
RESEARCH PAPER
Available Online at www.ijarcs.info
ISSN No. 0976-5697
A Metrics Design for Evaluation of Component’s Performance During
Software Development Process
Kumar Rahul*
Department of Basic and Applied Science Assistant Professor, NIFTEM University
Sonepat, India
Dr. Brijesh Kumar Sinha Associate Professor
Faculty of Computer Science & System Studies Mewar University
Chittorgarh, Rajasthan, India
Dr. Vijay Kumar
Department of Basic and Applied Science Assistant Professor, NIFTEM University
Sonepat, India
Abstract : There are three categories of software metrics: Process, product and project metrics. Process metrics used to develop software and maintenance at end. It evaluate(s) software development process(s) and maintenance cost after implementation of project at end user. It includes error removal efficiency (ERE) calculation during development, testing defect pattern recognition and response time of different process(s) in the module’s of software. Product metric(s) defines different properties of product such as size of product, blueprint of product, complexity of product, performance of the product and levels of qualities of product. It describes all features of product as per input provided to the measurement of metric(s) evaluation in software. Since software quality is one of the important parameter and considered as a part of software metric(s) which focus on different factors of process, product and end user implemented project. Practically, software quality evaluation metric(s) are relatively highly associated with process and product metrics in almost many cases than with comparatively less used project metrics. Metrics must be designed and defined to assess progress among objects. Few parameters have to be applicable during determination of metric(s) for evaluation of performance of state of objects in software field.
Keywords : Metrics, ERE, Reusability, Quality, Productivity, Reuse
I. INTRODUCTION
For any software development process, software reuse used as a process of implementation and consider as a component or module to generate productivity in the software product. Software product includes all features of component and module software as requirement and analysis, specifications, designs, testing process, test cases and proposals for a better software suite. A developed product which originated from an existing software process can be used as reusability tool during software development to improve the efficiency and effectively of software. Different software qualities may be achieved through different functionalities [2]. Construction of a new software required compositional reuse module of developed product which consist of less number of object with advanced features with high impact on development accessibility and productivity. Metrics and reusability is the process of defining measurement of tools, object creation and identifying the module of productivity enhancement in the system rather identifying errors. While using object qualities, one has to understand the performances of qualities in terms of efficiency and time line to execute the unit of software. Since it is a composition of module integrated together to produce the desired outcome, thus it becomes important to measure the component before use in the development process, which results scale up of highest level to meet the requirements [3].
*Research Scholar, Faculty of Computer Science & System Studies, Mewar University, Chittorgarh, Rajasthan, India
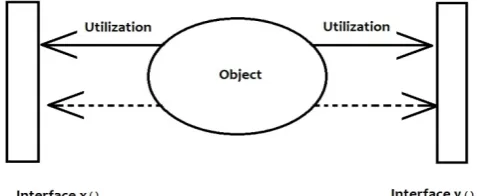
Many languages like JAVA rely on fairly small core of software module along with large pool of library functions and classes targeting to produce software by using of reusability concept and algorithm and identify the abstract of the software as well.Later, these abstracts help to support in data structure and algorithm of objects. A problem with fine-grained reusability module or unit is it depends on almost low level module of abstraction part. Different functional libraries and class libraries are not enough for supporting for grained reusable component of software [6]. Normally, the essentials of these libraries functions work together to achieve the desired functionality of the system. Software system execution depends on these library functions activities where coupling makes an impact during formation of module and execution as well. There should not any mismatch between abstract of software and reusable module of software, in case of existence, the outcome affect and productivity of software does not meet the exact requirement. Reuse asset and reuse requirement are important consideration of software development process using application of module [7]. Many interfaces () are accessed by objects () in a way to improve the utilization factor which rises from low level to high level. Both ways accessing of objects possible through interfaces () which act as platform independent in software development process.
Figure 1. Object utilization through interfaces during software reusability
II.EFFICIENCY IMPROVEMENTS ON REUSE
Reusability used as a tool to reduce development effort in software development process. It categorized in form of productivity or efficiency where it raises from level 0 to highest level 100 and so on. Based on the reusability factor increases, efficiency or productivity goes high and so on to achieve the highest level of efficiency. Efficiency improvement with respect to reusability considered in any development process of software product. It affects the outcome and functionality of module or a system as a whole in application world. Several qualities of an object’s lies on a same floor where it is accessible to whole system or a part of software [8]. Object’s qualities assessment passes through metric(s) availability and transaction based matrix of components available during development of module. Generally reusability enhance efficiency by reducing the time and cost in various ways to meet the standard of required software. Below mentioned diagram represent the efficiency improvement through productivity and reusable
of software module in development process.
Figure 2. Productivity and reuse rate
III. QUALITY IMPROVEMENT ON REUSABILITY
During metric(s) measurement, various components lies on the parameter of evaluation for reusable purposes. Thus quality evaluation performs on the availability and accessibility of component in any transaction based system for maintaining the transaction of module in software development process. qualities upgraded in terms of (%) or Number (0, 10, 20, 30,...100) with respect to reusable factor measured in the interval of 10, 20, 30 and so on, which categories in interval form. object qualities represented in the cluster form for access. more the error fixes leaves high impact on product, as life cycle of product contains error free and prevented error occurs at interface () abstraction of software. According to the component required data presentation, there is a strong linear relationship between qualities of component and reusability in software product development which shown below.
Figure 3. Relationship between Component Quality and Reuse
Since, research objective is to understand the object utilization and its improvement process with help of quality into the object process and in-process quality metrics. In-process quality metrics are usually defined lower than end product metrics, which are widely used by software developers. In-process quality metrics are used for tracking error and defect finding during system testing.
A. Error Removal Efficiency
[image:2.595.41.280.365.463.2]activities for software product by removing error. The evaluation of ERE can be describe as follows.
ERE=R / (R+D) (1)
Where R represents errors found prior to delivery of software to the user and D represents the number of Errors found after delivery of software. The standard value of ERE is 1. As R increases over a given value of D, the overall value of ERE increase, we can also describe ERE as:
EREi = R i / (R i + R i+1) (2)
Where Ri represents number of errors occurred during ith
software development activity and Ri+1 is the number of
[image:3.595.318.533.284.436.2]errors occurred during the software development process activity i+1 those were not discovered in the activity i. ie, The object errors that are not found during the review and analysis phase are passed on to the development phase.
Figure 4. Error Correction Step during SDLC
Defect and error rate during formal system testing (where many objects used in form of reusability or any other form of accessibility) performed during code generations which are usually co related with other module in the system [6]. Higher error rate may occur during unit or module testing is a signal that the impact of application software has affected in development process than the traditional testing where it is more applicable in detecting error in the system.
B. Redefinition of Error Removal Efficiency (ERE) in the
reusability context
Describing and verifying Errors helps on focus problem solving approach and determine the root cause of effort being imposed for analysis. previously used data helps organization during early phases of project planning process development to predict the error identification and finding the error count for every object’s and component as well during transaction of object’s details maintenance [7]. It is important to determine error rate by which different types of errors such as functionality error, calculation error or control flow error generated while reuse based component based software development process system. The left curve illustrates for identification of defect which helps during software testing, which uses a fault injection. It is an approach for improving and enhancing the coverage of test cases of object’s qualities by introducing defects to test code paths for an object’s, especially in error handling a code generation path that rarely is followed. The below diagram explained about defect identification, defect found and fixed and except defect cases with respect to search,
find, build test cases and component integration as well. A defect identification lead to error generations and it begins when project begins. However, the second curve of error identification and find and fix scenario provides the details of defects found and fix and except defect. It slowly goes down in the cases of component integration and in case of generation, it fix somewhere with special cases. In the developmental approach of component integration or When COTs are used during software development process, we can redefine ERE as
EREi = Ri / (Ri + Ri+1) (3)
Whereas Ri represents the number of errors occurred in the
ith object and Ri+1 is the number of errors occurred after
integrating i+1th object with the ith component.That means finding all errors of each object make sure the standard value for ERE.
Figure 5. Error identification and find and fix Scenario
IV. METRIC(S) FOR OBJECT AND ITS FEATURE
EVALUATION
System organizations needs software which is helpful for the operations and keeping those objectives and operations, software designed in a way to evaluate various parameters of software engineering qualities attributes. Metric are helpful to evaluate modules and components at various instant under development process. Sometimes, is based on the input given to the module and its functionality affected based on the input given and the whole system affected by using the metric(s). We have determined few metric(s) such as AOPM, EOPM, IOAM, IOPM and NOM. These metric(s) works based on the availability of object(s) and its usability required in the developing system for an application based software or any other system which are helpful for customer development is on progress. Usability of objects defined as capability to abort, undo, phase by phase, help, progress, execution space and so on in the system. Few objects’ are un-used in the developing system and evaluated through Non-accessible Metric(s) (NOM). Object’s accessibility under module functioning, following considerations achieved such as:
• development effort reduce
• less execution time required
[image:3.595.38.254.285.412.2]• Enhancement of quality under transaction system and so on.
• These features achieved by using of the above metric(s) and others, however a comparison chart and statistical evaluation required before implementation. Software engineering discipline over a decade, actively participating on various research issues on the availability of component, modules and objects across various module in the development system and somewhere they have achieved a high rate of accessibility of components and module but failed to achieve over object’s performance and its evaluation in the development system which directly affect the reduction of time and cost.
• It is important to measure the object’s and it performances before and after access of it in the system where required. Since, there are various qualities of object’s measured during transaction management system (TMS) where a matrix of data’s maintained during identifying reusability and availability of object or component suite are used, showing relationship among availability becomes important. Among various qualities characteristics like understand ability, adaptability, portability the reusability of object and component as well is particularly important when reusing components are required.
• Object’s performance effects during human computation interaction (HCI), where the functionality of interactivity becomes easier by using the objects which are completed through execution process and requires less time and space in the module. Since, the application goes high with respect to the performance not only in application but in case of artificial intelligence based application and the software which are helpful for other application also. However, in cases of implications of object accessibility depends on the recommendations of interface(s) design in a modular based software product. These metric(s) such as AOPM, EOPM, IOAM, IOPM and NOM determinations measures the performances over earlier metric(s) which have been designed in a way to evaluate components and to justify the performances of components under software development systems. Few points are considerable during evaluations of object by using metric(s) such as values of ATOTAL, RTOTAL,
and IACC. The denominator values cannot be 0 and
1 as these two are considerable as special cases.
• Designed metric(s) are helpful for evaluation and performance calculations for the module. These metrics describes the system object’s responsibilities in forms of classes within an architectural model. During development of system, a team gathers list and name of functions which need to be reused under flexible software system with encountered the number of objects through synchronization process. However, prediction of object’s usability and efficiency measurement become higher in comparison of earlier designed metric(s) which can be shown
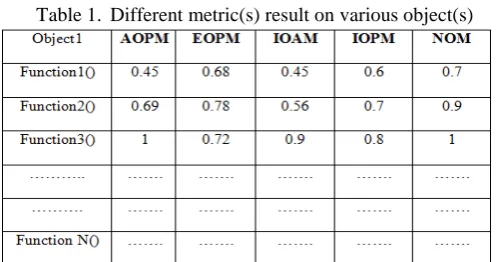
below. The problem given in [7] can be achieved by using the metric(s) AOPM, EOPM, IOAM, IOPM and NOM developed and implemented accordingly.
Table 1. Different metric(s) result on various object(s)
[image:4.595.319.569.110.241.2]For other objects such as object2 and so on, these metric(s) will be applicable and will evaluate the performances such as reusability factor, interactivity level, and interface point and so on. However, by using of earlier metrics, such as PSU, RSU, IDC, IIDC and OIDC, it is given below.
Table 2. Different metric(s) result on various object(s)
• Metric(s) based approach is helpful and suitable to use various functions under object utilization. Metric(s) suitability applicable in a form of access data’s and feature to reduce the developing effort and at the same time improve the performance as well. Since object’s contains views, controlling and monitoring, domain class suit, domain group or class with warning message(s) in the module. Therefore, while reusability feature evaluation of module, it becomes necessary to work up on various facts (i.e. suitability, accuracy, interoperability, security system) to calculate efficiency factor which has been verified through statistical method as well.
A. Available object’s performance metrics (AOPM)
Available object’s performance metrics (AOPM) is suitable to evaluate object’s performance during execution and requirement of modules before accessing in the development process. This kind of metrics will estimate the number of provided component utilization between two entities. The AOPM denotes the ratio of component provided by the system organizations which are actually used in the system.
Where AOPMM represents under module M, how many
objects are available and A AVAILABLE=Number of objects
and its parametric values provided by the system module M that are actually transferred to the module N which are used by other system in the developing module for an application and ATOTAL=Number of objects which are available
throughout the software module and it need to be controlled through the metrics where it is used & ATOTAL=0 &1 (Non
existence case)
B. Executed object performance metrics (EOPM):
Executed object performance metrics (EOPM) defines in a way to evaluation and complexity of object’s with respect to the module of the software where need.
EOPMM= RAVAILIABLE+R/ (RTOTAL-1) (5)
Here, EOPM= Number of objects executed by the system organization M that are basically evaluating the object performance before accessing it and R AVAILIABLE = Total
number of object’s needed by system application process under development system organization M & RTOTAL = 0 &
1 (Non-existence case)
C. Interactivity of objects accessible metrics (IOAM):
Interactivity of objects accessible Metrics (IOAM) defines the level of accessible system’s object executed and provide the module for access with respect to developing an application based software. It is the process of evaluating levels of accessibility which evaluate fact(s) under data’s and functions. It can be measured as:
IOAM= IO/ (IACC-1) (6)
Where IO = It represents the actual interactivity of levels
(level 0=No interaction and value will be as IO=0,
similarly Io=1, it means object interactivity=1, IO =2, it
means object interactivity=2 among modules under the system development process and so on & IACC = It
represents the access point where 0 &1 (Non-existence case)
D. Integrated objects performance metrics (IOPM):
Integrated objects performance metrics (IOPM) evaluated where several object’s being used in a development of module which can be available for the other system component and its functions. Integrated objects available in various modules of a software and it works during execution of the software. The performance of integrated objects stands in coupling status of software for analysis and evaluating through Interactivity of objects accessible (IOAM) metrics
So, the IOPM= IIO/IINTIO (7)
Where, IIO= actual integrated objects and IINTIO= Maximum
number of integrated object’s which are used in development of software process.
E. Non accessible object’s metrics (NOM):
Non accessible object’s metrics (NOM) is suitable to find those objects which are not un-used for the remaining modules in the development process of any application or embedded software, however these kind of non-accessible objects performance cannot be measured in advance and it should be ignored during access of object’s attribute or complexity.
NOM=NOMM1+NOMM2+NOMM3+……+ NOMMN (8)
Where, NOMM1 represents Module 1 and so on in the
development of software systems.
V. DEFECT APPEARANCE PATTERN DURING SYSTEM TESTING
Overall defect appearance form during system testing is a brief indicator of performance. The pattern or form of defect appearance provides vital information under development process. At the time of defect appearance during system integration, system testing, different types of defect or errors in the utilizations of objects indicates different quality levels in the field of quality evaluation of objects or components.
Now, there is a phase-wise error removal form become extension of test error density metric(s). In addition to module testing, it requires the tracking of error at all development phases of the software life cycle which includes analysis view, design view, coding, testing view and ensured before implantation of project at client end. Sometime, a small % of programming error technically related with either design of modular code, conducting a review of verifications to enhance and increase error removal efficiency either at process level, product level or project level.
The format of phase-wise error removal efficiency reflects the whole removal efficiency of system in line of development process. With respect to the developed metric(s) used for the different purposes in utilization cases of objects and other development process including design, coding and testing etc.
VI. RESULTS &DISCUSSION
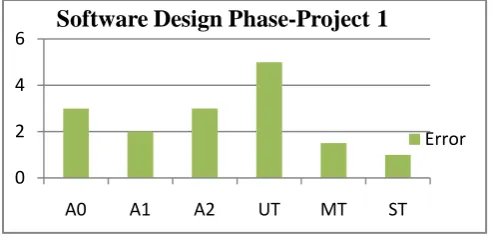
Figure 6. Error Removal Efficiency (ERE) by phase wise-Project 1
Figure 7. Error Removal Efficiency (ERE) by phase wise-Project 2
The metric can be used to calculate the entire software development process for an application. For higher metric value tends to more efficient and effective development process of any project or application. These metric are used as a key parameter of the error removal model for any software development process.
Inspection Error: This kind of error found during process investigation for a system where many module(s) are integrated and which are not fixed at any level of cooperation. It may occur because of these reasons:
• An error state in a later investigation phase
• An error state exist during testing phase
• A section or unit errors
• Non security to the requirement, availability and stipulations.
Interface Error: Interface plays an important role in evaluating object(s) in system integrations [10]. It generate in object communications () in a way to access resources of components or module and access point in the system integrations. These types of error may exist in communication among:
• Modules or Components
• Software Products
• Sub Modules of a component
• User interface (e.g., message(s), panels, access point)
Interface defects per development phase follow:
Software Product: ________Module: ___________ Release:__________
Investigation Type: ___________ (RO, OD, A0, A1, A2) Object Report: ________________
Total time of preparation in hrs: ______ Total Inspection time for objects: _______ Total persons attended: _____________ Investigation date: _____/______/______ Re-investigation need: _________(Y/N)
Error Type: Error original and investigation types:
D: Citations RO: Requirement of objects I: Interface OD: Object Design
L: Reason A0: Advanced Design A1: Moderate Design, A2: Code Deign
REFERENCES
[1] Crnkovic, I., Schmidt, H., Stafford, J. A., Wallnau, K., The 6th ICSE Workshop on Component-Based Software Engineering: Automated Reasoning and Prediction, ACM SIG-SOFT Software Engineering Notes, vol 29, nr 3, pp.1-7, 2004
[2] E. Kayan and O. Ulusoy. An evaluation of real-time transaction management issues in mobile database systems. Submitted journal paper (also a Technical Report, Department of Computer Engineering and Information Science, Bilkent University, 1998.
[3] Fanea, A., Motogna, S., Dio»san, L., Automata-Based Component Composition Analysis, Studia Universitas \Babes-Bolyai", Seria Informatica, vol. L (1), pp. 13 - 20, 2006
[4] Fenton, N.E., Ohlsson, N., “Quantitative Analysis of Faults and Failures in a Complex Software System”, IEEE Trans. Software Engineering, 26(8), 2000, pp. 797-814.
[5] Malaiya, K.Y., Denton, J., “Module Size Distribution and Defect Density”, Proc. 11th International Symposium on Software Reliability Engineering- ISSRE’00, 2000, pp. 62-71. [6] Roger S Pressman, Software Engineering-A practitioner’s
approach, 5th Edition, McGraw-Hill, 2001.
[7] Serban, C., Vescan, A., Metrics for Component-Based System Development, Creative Mathematics and Informatics, Vol. 16,pp. 143-150, 2007
[8] Sherriff, M., Nagappan, N., Williams, L., and Vouk, M. A., "Early Estimation of Defect Density Using an In-Process Haskell Metrics Model," First International Workshop on Advances in Model-Based Software Testing, St. Louis, MO, May 15-21, 2005.
[9] Vescan, A., Motogna, S., Syntactic automata-based component composition, The 32nd EU-ROMICRO Software Engineering and Advanced Applications (SEAA), Work in Progress,2006
[10]Narasimhan, V. L. and Hendradjaya, B., A New Suite of Metrics for the Integration of Software Components, The First International Workshop on Object Systems and Software Architectures (WOSSA'2004), Australia, 2004
0 2 4 6
A0 A1 A2 UT MT ST
Software Design Phase-Project 1
Error
0 1 2 3 4 5
A0 A1 A2 UT MT ST