Page 1 of 6 Big-data Clinical Trial Column
Comparing baseline characteristics between groups: an
introduction to the CBCgrps package
Zhongheng Zhang1, Alberto Alexander Gayle2, Juan Wang3, Haoyang Zhang4, Pablo Cardinal-Fernández5
1Department of Emergency Medicine, Sir Run-Run Shaw Hospital, Zhejiang University School of Medicine, Hangzhou 310016, China; 2Department of Immunology, Mie University Graduate School of Medicine, Mie, Japan; 3Unit of Statistical Genetics, Kyoto University Graduate
School of Medicine, Japan; 4Division of Biostatistics, JC School of Public Health and Primary Care, The Chinese University of Hong Kong, Shatin, Hongkong, China; 5Department of Emergency Medicine, Hospital Universitario HM Sanchinarro, Madrid, Spain
Correspondence to: Zhongheng Zhang. No. 3, East Qingchun Road, Hangzhou 310016, China. Email: [email protected].
Abstract: A usual practice in observational studies is the comparison of baseline characteristics of participants between study groups. The overall population can be grouped by clinical outcome or exposure status. A combined table reporting baseline characteristics is usually displayed, for the overall population and then separately for each group. The last column usually gives the P value for the comparison between study groups. In the conventional research model, the variables for which data are collected are limited in number. It is thus feasible to calculate descriptive data one by one and to manually create the table. The availability of EHR and big data mining techniques makes it possible to explore a far larger number of variables. However, manual tabulation of big data is particularly error prone; it is exceedingly time-consuming to create and revise such tables manually. In this paper, we introduce an R package called CBCgrps, which is designed to automate and streamline the generation of such tables when working with big data. The package contains two functions, twogrps() and multigrps(), which are used for comparisons between two and multiple groups, respectively.
Keywords: Big data; baseline characteristics; publication-style; observational study; R package
Submitted Aug 25, 2017. Accepted for publication Sep 21, 2017. doi: 10.21037/atm.2017.09.39
View this article at: http://dx.doi.org/10.21037/atm.2017.09.39
Introduction
Electronic healthcare records (EHR), which contain digital healthcare information from routine clinical practice for individuals with relatively large sample sizes, are an important source of data to explore potential association between diseases of interest and possible causative variables. However, one of the problems researchers may encounter is the a large number of variables being analyzed (1,2). In addition, some identified associated variables contributed to disease may be overestimated due to the curse of high dimensionality and computational complexity (3), and also some may be underestimated and are false negatives due to confounding factors or other biases. There is no panacea for all these problems. However, One way of solution is to make use of big-data with more reliable and complete
information obtained from EHR systems, in which statistical patterns could be modelled for testing effectively
and efficiently associations between multiple variables and
diseases of interest based on machine-learning techniques, including supervised and unsupervised learning (4).
confounding bias, adjusted analyses with regression modeling or other matching techniques are usually mandatory (7). A usual practice in observational studies is the comparison of baseline characteristics of participants between study groups. The overall population can be grouped by clinical outcome or exposure status. A combined table reporting baseline characteristics is usually displayed, for the overall population and then separately for each group. The last column usually gives the P value for the comparison between study groups. In the conventional research model, the variables for which data are collected are limited in number. It is thus feasible to calculate descriptive data one by one and to manually create the table. The availability of EHR and big data mining techniques makes it possible to explore a far larger number of variables. However, manual tabulation of big data is particularly error prone; it is exceedingly time-consuming to create and revise such tables manually. In this paper, we introduce an R package called CBCgrps, which is designed to automate and streamline the generation of such tables when working with big data.
There is a more user-friendly tutorial displayed in html format (supplemental file, created by J Wang, available online: http://atm.amegroups.com/public/addition/atm/ supp-atm.2017.09.39.html). In this tutorial, the distributions of continuous variables are examined using histograms. It also introduces an alternative way to produce paper-style
tables by first saving the table results as Excel, then copying
them to the Word processor.
The CBCgrps package
The package has been updated to version 2.1, which includes a function to generate tables comparing three or more groups. In the older version (version 1.0), there is only one function cbcgrps() for comparing two groups. Version 2.0 includes two such functions, twogrps() and multigrps(). The twogrps() function in version 2.0 is the same as the cbcgrps() function in version 1.0. The latest package (version 2.1) can be installed and loaded to the workspace with the following code.
> install.packages("CBCgrps") > library(CBCgrps)
Simulated dataset
There is a simulated dataset called df in the CBCgrps
package. The dataset contains 1,000 observations of seven variables. C-reactive protein (crp) is a numeric vector and its value is measured in mg/L. The variable hb is hemoglobin measured in g/dL. This dataset is for the purpose of demonstration only and contains randomly generated data. The variable ddimer stands for D-dimer, which is a measurement of coagulation system. The variable wbc is for white blood cell, which is associated with systemic inflammatory response. The variable comorbid is a factor variable representing comorbidities of a patient. Sex is also a factor variable with two levels male and female. The variable mort is a measure of mortality outcome which has two levels: alive and dead. We now take a look at the structure of the dataset.
> data(df) > str(df)
'data.frame': 1000 obs. of 7 variables: $ crp: num 105.1 130.3 82.9 130.6 45.7 ... $ hb: num 10.48 16.26 6.33 5.44 9.86 ...
$ ddimer: num 0.32294 0.01011 0.05238 0.01109 0.00348 ... $ wbc: num 7.27 5.97 6.15 6.5 10.11 ...
$ comorbid: Factor w/ 7 levels "cirrhosis","COPD",..: 2 7 5 2 5 5 NA 4 2 2 ...
$ sex: Factor w/ 2 levels "female","male": 2 1 2 2 1 1 2 2 1 2 ... $ mort: Factor w/ 2 levels "alive","dead": 1 1 1 1 1 1 2 1 1 1 ...
The twogrps() function
Arguments of the twogrps() function is shown below:
twogrps(df, gvar, p.rd = 3, normtest = "yes", norm.rd = 2, sk.rd = 2, tabNA = "no", cat.rd = 2, maxfactorlevels = 30, minfactorlevels = 10, sim = FALSE, workspace = 2e+05)
size, the Anderson-Darling test can be very sensitive to a small deviation from the normal distribution (8). But in real research practice, such a small deviation is generally not meaningful. In other words, huge samples can
make the insignificant significant. In this circumstance, one
may wish to switch off the normality testing and still use mean and standard deviation to describe the data.
The arguments norm.rd and sk.rd control the number of significant digits for the normal and skewed data, respectively. The dataset may contain missing or NA values. By default, these are removed when calculating percentages for factor variables. Missing or NA values can be included in calculations by setting tabNA="ifany". The cat.rd argument
controls the number of significant digits for the proportion
of factor variables.
The maxfactorlevels defines the maximum number of levels for factor variables. If there are too many levels, it reports a warning message. This is useful for suppressing calculation of date or time variables. Sometimes, categorical variables may be encoded as integer values; for example, male as 1 and female as 2. In such cases R automatically treats the gender variable as a numeric variable, and calculates the mean and standard deviation. By setting the minfactorlevels argument to 10, the function will consider numeric variables with less than 10 values to be categorical variables.
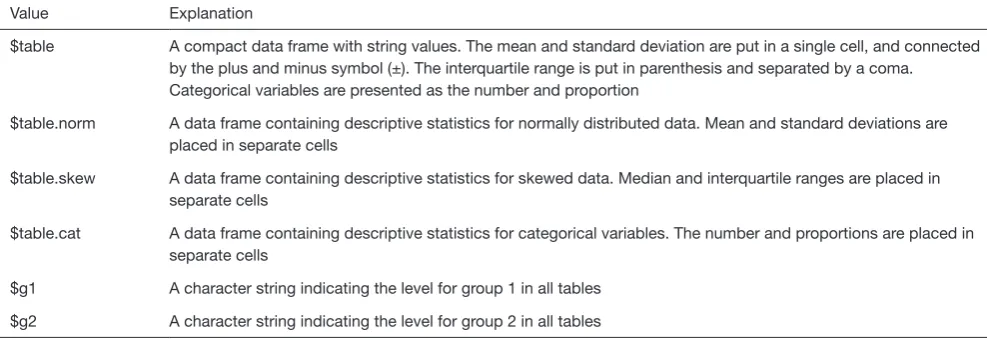
Fisher’s exact test is the accepted criteria for comparing two independent proportions in the case of small samples (9,10). However, Fisher’s exact test takes a lot of workspace thereby requiring an expansion of the workspace used in the network algorithm. By default, the workspace is “2e+05”; this may be expanded to “2e+07”. The sim argument is a logical value, taking either true or false. This indicates whether P values should be computed in Monte Carlo simulation, for tables larger than 2 by 2 (11). The returned object from twogrps() function is shown in Table 1.
The example
The R code for performing statistical descriptions and comparisons is extremely simple with one line of code.
The returned object of the twogrps() function is a list containing data frames. The first element $table is a data frame gathering all types of variables together. The mean and standard deviation are put in a single cell, and connected by plus and minus (±) symbol. The interquartile range is put in parenthesis and separated by a coma. Categorical variables are presented as the number and proportion. If you don’t want descriptive statistics being combined in a single cell, they can be displayed separately. The following is an example containing descriptive
> tab2g<-twogrps(df,"mort") > tab2g$table
[,1] [,2] [,3] [,4]
"tot" "grp1" "grp2" "p"
crp "89.61±19.68" "90.31±19.52" "86.83±20.14" "0.028"
hb "10.03±3.99" "9.84±3.94" "10.8±4.08" "0.003"
statistics for normal data.
> tab2g$table.norm
mean sd mean.1 sd.1 mean.2 sd.2 p
crp 89.61 19.68 90.31 19.52 86.83 20.14 0.028 hb 10.03 3.99 9.84 3.94 10.80 4.08 0.003
Comparisons between multiple groups can be performed with the multigrps() function.
> tabng<-multigrps(df,"comorbid")
The output tables are too wide to be displayed because
there are seven groups. Interpretation of the output is similar to that obtained from the twogrps() function.
Converting R output to publication-style table in Microsoft Word processor
[image:4.595.46.540.308.478.2]The output displayed on R console can be converted to publication-style tables in Microsoft Word. Figure 1 shows the output in R console, highlighted in light blue due to having been selected. Initially, when this output is copied and pasted into MS Word (Figure 2) it appears quite messy! However, the process to convert this into publication-ready tables is quite simple using MS Word (Figure 3). Double quotes separate columns of text. And you can remove any blank columns as
[image:4.595.112.488.499.640.2]Figure 1 The output in R console is selected that the texts are highlighted in light blue. Table 1 Returned object from the twogrps() function
Value Explanation
$table A compact data frame with string values. The mean and standard deviation are put in a single cell, and connected by the plus and minus symbol (±). The interquartile range is put in parenthesis and separated by a coma. Categorical variables are presented as the number and proportion
$table.norm A data frame containing descriptive statistics for normally distributed data. Mean and standard deviations are placed in separate cells
$table.skew A data frame containing descriptive statistics for skewed data. Median and interquartile ranges are placed in separate cells
$table.cat A data frame containing descriptive statistics for categorical variables. The number and proportions are placed in separate cells
$g1 A character string indicating the level for group 1 in all tables
Figure 2 Copy and paste the selected texts onto the Microsoft Word. It appears messy and does not conform to the publication-style of most medical journals.
[image:5.595.308.550.86.255.2]Figure 3 Screen shot of the “Convert text to table” function in Word. The texts are separated at double quotes symbol (arrow).
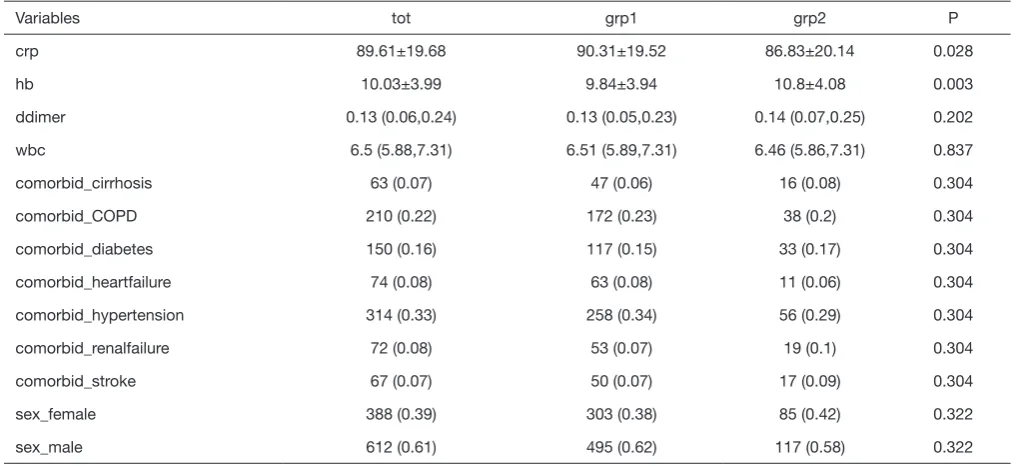
Table 2 The publication-style table
Variables tot grp1 grp2 P
crp 89.61±19.68 90.31±19.52 86.83±20.14 0.028
hb 10.03±3.99 9.84±3.94 10.8±4.08 0.003
ddimer 0.13 (0.06,0.24) 0.13 (0.05,0.23) 0.14 (0.07,0.25) 0.202
wbc 6.5 (5.88,7.31) 6.51 (5.89,7.31) 6.46 (5.86,7.31) 0.837
comorbid_cirrhosis 63 (0.07) 47 (0.06) 16 (0.08) 0.304
comorbid_COPD 210 (0.22) 172 (0.23) 38 (0.2) 0.304
comorbid_diabetes 150 (0.16) 117 (0.15) 33 (0.17) 0.304
comorbid_heartfailure 74 (0.08) 63 (0.08) 11 (0.06) 0.304
comorbid_hypertension 314 (0.33) 258 (0.34) 56 (0.29) 0.304
comorbid_renalfailure 72 (0.08) 53 (0.07) 19 (0.1) 0.304
comorbid_stroke 67 (0.07) 50 (0.07) 17 (0.09) 0.304
sex_female 388 (0.39) 303 (0.38) 85 (0.42) 0.322
sex_male 612 (0.61) 495 (0.62) 117 (0.58) 0.322
Notes: the head title tot represents the overall group, grp1 is group 1 and grp2 is group 2. The last column is the P value for the comparison between the two groups. The P value for a categorical variable is the same because a Chi-square test or Fisher’s exact text is applied to all levels.
needed. The final table is shown in Table 2. In this process, the table is created automatically, which is time-saving and can avoid potential errors induced by manual data input.
Acknowledgements
Funding: The study was funded by Zhejiang Engineering
Research Center of Intelligent Medicine (2016E10011) from
the First Affiliated Hospital of Wenzhou Medical University.
Footnote
Conflicts of Interest: The authors have no conflicts of interest
[image:5.595.43.554.323.556.2]References
1. Wu PY, Cheng CW, Kaddi C, Advanced Big Data Analytics for -Omic Data and Electronic Health Records: Toward Precision Medicine. IEEE Trans Biomed Eng 2016;64:263-73.
2. Butte AJ. Big data opens a window onto wellness. Nat Biotechnol 2017;35:720-1.
3. Bourgon R, Gentleman R, Huber W. Independent filtering increases detection power for high-throughput experiments. Proc Natl Acad Sci U S A 2010;107:9546-51.
4. Jensen PB, Jensen LJ, Brunak S. Mining electronic health records: towards better research applications and clinical care. Nat Rev Genet 2012;13:395-405.
5. Zhang Z. Univariate description and bivariate statistical
inference: the first step delving into data. Ann Transl Med
2016;4:91.
6. von Elm E, Altman DG, Egger M, et al. Strengthening the Reporting of Observational Studies in Epidemiology (STROBE) statement: guidelines for reporting
observational studies. BMJ 2007;335:806-8.
7. Harrell FE. Regression Modeling Strategies. New York, NY: Springer New York, 2001.
8. Nelson LS. The Anderson-Darling test for normality. Journal of Quality Technology 1998;30:298-9.
9. Andrés AM, Del Castillo JD. P-values for the Optimal Version of Fisher's Exact Test in the Comparison of Two Independent Proportions. Biometrical Journal 1990;32:213-27.
10. Camilli G. The relationship between Fisher’s exact test and Pearson’s chi-square test: A Bayesian perspective. Psychometrika 1995;60:305-12.
11. Campbell I. Chi-squared and Fisher-Irwin tests of two-by-two tables with small sample recommendations. Stat Med 2007;26:3661-75.