International Journal of Research in Advent Technology, Vol.6, No.9, September 2018
E-ISSN: 2321-9637
Available online at www.ijrat.org
Fault Detection Using Hilbert Huang
Transform
Balvinder Singh1, Tanuj Manglani2
1
M.Tech Scholar, 2Professor, Department of Electrical Engineering Yagyavalkya Institute of Technology, Jaipur, India
Abstract— This paper accords a method based on the Hilbert Huang Transform (HHT) for detection of symmetrical faults on the transmission line. A test system comprising of a transmission line connected at both ends to AC sources is used for the proposed study. Current is recorded at both ends of the transmission line. Current is decomposed using the Hilbert Huang Transform. A fault index is proposed to diagnose the symmetrical fault involving all the 3 phases and ground. The threshold value of the proposed fault index is used for detection of the fault. It is established that the proposed effectively detects symmetrical fault involving the ground.
Keywords—Hilbert Huang Transform; power system fault; Transmission line.
1. INTRODUCTION
The complicated nature of present power system network increases the significance of fault location methods which are considered one of the most interesting research projects in the recent years. The transmission line relaying is an extremely important device in safety operations of the power system. It must be done as fast and accurate as possible to turn off the faulted line in order to protect the system against the harmful fault effects. Conventional techniques such as fault impedance measurements in such difficult conditions represent a problem primarily due to big fault resistance. Measuring instruments and devices for fault location estimation are usually located in a main grid substation. Cost reduction of the fault location can be obtained with current and voltage measurements in combination with computer simulations and calculations and precise planning of the network. In this regard, signal processing techniques may play an important role for the detection of the faults using a threshold value which is used to actuate a relay to generate a command signal for outage of faulty section. The artificial intelligent technique may be utilized to classify and find the type of fault occurred in the network.An algorithm to detect and classify the fault and indicate the fault position in a transmission line with respect to a FACTS device placed in the midpoint of the transmission line has been proposed in [1]. In [2], two approaches are presented to detect short-circuit faults in power transmission lines. In [3], authors proposed a method for fault location on
transmission lines, which is based on time to frequency
domain transformation of transient signals of the fault instant measured at one end. Fast Fourier Transform (FFT) is used for determination of the fault location using the travelling wave theory of the transmission line. In [4], time domain relaying schemes for complete protection of parallel transmission lines using wavelet and artificial neural network (ANN) are presented. In [5], authors presented a new approach to classify fault types and predict the fault location in the high-voltage power transmission lines, by using Support Vector Machines (SVM) and Wavelet Transform (WT) of the measured one-terminal voltage and current transient signals. In [6], authors presented a statistical algorithm for classification of faults on power transmission lines. The proposed algorithm is based upon the wavelet transform of three phase currents measured at the sending end of a line.
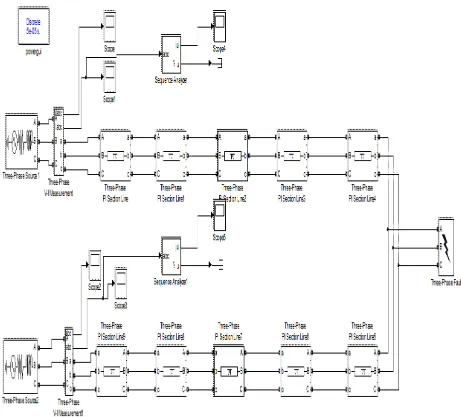
2. TEST SYSTEM USED FOR STUDY
Fig. 1. Proposed test system used for the study of fault analysis.
3. PROPOSED FAULT INDEX
The current signal of phase-A is decomposed using Hilbert transform. Absolute value of output of the Hilbert Huang Transform based decomposition is obtained. The intrinsic mode functions at decomposition level 1 are calculated. The proposed fault index (FI) is calculated as below.
C=IMF1.*IMF1
The peak values of the FI are used to detect and discriminate the symmetrical fault involving the ground.
4. SIMULATION RESULTS AND DISCUSSION
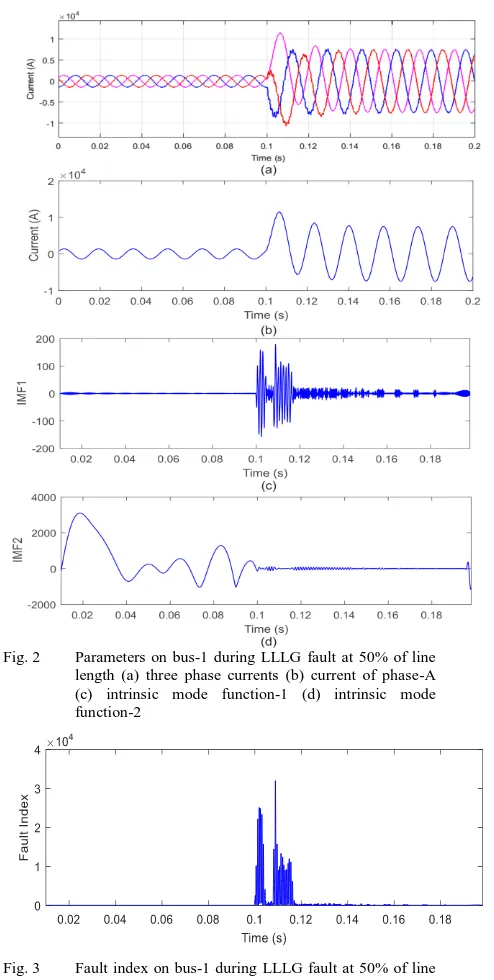
The three-phase fault involving ground (LLLG) is simulated at 50% of line length from the AC source-1
components are also observed in the values of IMF at second level of decomposition as shown in Fig. 2 (d). Hence, it is observed that significant disturbance components are present in the IMFs at the time of fault occurrence which will help to detect the LLLG fault.
The fault index calculated on bus-1 during the event of three-phase involving the ground is shown in Fig. 3. It is noticed from this figure that the value of fault index is zero before the occurrence of the fault i.e. for initial 6 cycles. High magnitude peak having the value 34000 is observed at the time of fault occurrence indicating the presence of LLLG fault. Hence, the LLLG fault can be detected effectively using the proposed algorithm. The LLLG fault is also simulated at 10%, 20%, 30%, 40%, 50%, 60%, 70%, 80% and 90% of line length from the end of AC source-1 and peak values of the proposed fault index measured on bus-1 are provide in Tale I.
The three phase fault involving ground (LLLG) fault is simulated at 50% of line length from the AC source-1 end. The current recorded on bus-2 is decomposed using the Hilbert transform. The absolute value of the output of Hilbert transform is decomposed using the empirical mode decomposition and IMFs at first and second decomposition levels are obtained. The proposed fault index is obtained from IMF at first level of decomposition.
Three phase currents on bus-2, current of phase-A, IMF at first level of decomposition, IMF at second level of decomposition are shown respectively in Fig. 4 (a), (b), (c) and (d). This can be observed from the Fig. 4 (c) that the value of IMF at first level of decomposition are non-zero at the time of fault occurrence indicating the presence of disturbances other than the fundamental frequency. The values of this IMF are zero before the fault occurrence. The transient components are also observed in the values of IMF at second level of decomposition after fault occurrence as shown in Fig. 4 (d). Hence, it is observed that significant disturbance components are presented in the IMFs at the time of occurrence of LLLG fault which helps to detect the LLLG fault.
Fig. 2 Parameters on bus-1 during LLLG fault at 50% of line
Fig. 4 Parameters on bus-2 during LLLG fault at 50% of line length (a) three phase currents (b) current of phase-A (c) intrinsic mode function-1 (d) intrinsic mode function-2
Fig. 5 Fault index on bus-2 during LLLG fault at 50% of line length
TABLE I PEAK VALUES OF THE FAULT INDICES DURING LLLG FAULT
Line length from AC source-1 side
Peak value of Fault Index
Bus-1 Bus-2
10% 34500 23600
20% 34300 23800
30% 34200 23850
40% 34100 23900
50% 34000 24000
60% 33900 24100
70% 33800 24200
80% 33750 24250
90% 33900 24400
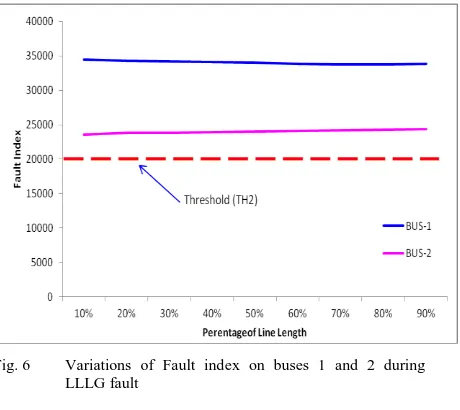
ground at the locations 10%, 20%, 30%, 40%, 50%, 60%, 70%, 80% and 90% of line length from AC source-1 are provide in the Table I. The variations of fault indexes are plotted in the Figure 6. It is observed from the Fig. 6 that the peak values of the fault indexes calculated on buses at both ends of the transmission line are above the threshold value (TH2) of 20000. If the peak value of the fault index is below 20000 then there will be other types of the fault on the system or may be the healthy condition. The value of faulty fault index above 20000 indicates the presence of the three phase fault involving the ground. It is also observed that the values of the fault index on bus-1 are highest at 10% of the line length which is near the bus-1 end and it is minimum on the 90% of the line length. The reverse trend is observed with the fault index calculated on the bus-2 of the test system. It is maximum on the 90% of the line length which is near the bus-2 of the test system and minimum at the 10% of line length which is near the bus-2 of the test system. However, the value of proposed fault index during the LLLG fault significantly high compared to the corresponding values observed on the bus-1.
Fig. 6 Variations of Fault index on buses 1 and 2 during LLLG fault
5. SIMULATION RESULTS AND DISCUSSION
non-zero values during the faulty events. The plots of variations of the fault indexes at different line lengths are also obtained. The threshold value is used to discriminate faulty event from the healthy condition.
REFERENCES
[1] A. M. El-Zonkoly, H. Desouki, ―Wavelet entropy based algorithm for fault detection and classification in FACTS compensated transmission line,‖ Electrical Power and Energy Systems, Vol. 33, pp. 1368–1374, 2011.
[2] Hassan Fathabadi, ―Two novel proposed discrete wavelet transform and filter based approaches for short-circuit faults detection in power transmission lines,‖ Applied Soft Computing, Vol. 36, pp. 375–382, 2015.
[3] Mehmet Salih Mamis, Müslüm Arkan, Cemal Keles, ―Transmission lines fault location using transient signal spectrum,‖ Electrical Power and Energy Systems, Vol. 53, pp. 714–718, 2013. [4] Aleena Swetapadma, Anamika Yadav, ―Time
domain complete protection scheme for parallel transmission lines,‖ Ain Shams Engineering Journal, pp. 1-15, 2015.
[5] Sami Ekici, ―Support Vector Machines for classification and locating faults on transmission lines,‖ Applied Soft Computing, Vol.12, pp. 1650–1658, 2012.
[6] J. Upendar, C.P. Gupta, G.K. Singh, ―Statistical decision-tree based fault classification scheme for protection of power transmission lines‖ Electrical Power and Energy Systems, Vol. 36, pp. 1–12, 2012.