Volume 8, No. 3, March – April 2017
International Journal of Advanced Research in Computer Science RESEARCH PAPER
Available Online at www.ijarcs.info
De-Noising Mammogram images by Hybridizing Deviation about Mean, Median and
Maximum Filters
Dr.S.K. Jayanthi
Associate Professor & Head, Dept. of Computer Science Vellalar College for Women
Erode, Tamil Nadu, India
K. Preetha*, K. Sridevi
Research Scholars, Dept. of Computer Science Vellalar College for Women
Erode, Tamil Nadu, India
Abstract: Mammograms are X-ray images of the breast. Digital mammogram is to detect abnormalities in the breast, which may require monitoring or treatment. Early detection is the most appropriate treatment to reduce breast cancer mortality. Mammogram images are poor in quality due to low dose radiation, because higher dose may destroy patient’s health. Mammogram images affected by noise can degrade the quality of an image which leads to wrong diagnosis by a radiologist. The goal of pre-processing is to enhance the quality by removing the noise and to preserve the details in an image which is suitable for further analysis. This paper proposes a novel idea to de-noise the image by introducing a hybrid statistical filter which is a combination of maximum, deviation about mean and median. Performance Evaluation is done based on the metrics Mean Square Error (MSE) and Peak Signal to Noise Ratio (PSNR). The proposed filter yields better results compared to existing filters.
Keywords: Mammogram; Pre-processing; Noise; Maximum; Median; Variance
I. INTRODUCTION
Breast cancer is a malignant cell growth in the breast. It is the second most common cancer among the women in the United States (other than skin cancer). The body is made up of cells, which may grow and divide to produce more cells to keep the body healthy based on the need. Sometimes cells keep dividing when new cells are not needed. These cells may form a mass of extra tissue called a growth or tumor, which can be benign or malignant [4]
II. LITERATURE REVIEW
. When breast cancer is found and treated early, the chances for survival rate is high. Women can take an active part in the early detection of breast cancer by having regular screening of mammograms, clinical breast exams and breast self-exams.
Mammograms are used as a screening tool to detect early breast cancer in women. The false positive rate is higher with ultrasound images so mammogram images are taken for analysis in the proposed work. In Australia, it is recommended that all women over 50 years of age have a screening mammogram every two years. Breast tissue is quite dense; therefore a mammography is designed to increase the quality of the pictures without increasing the radiation. The aim is to detect abnormalities in women with no symptoms; early detection is a better chance of treatment and recovery [3]. Mammogram images may be affected by Gaussian Noise, Salt and Pepper Noise, Speckle Noise and Poisson Noise due to low dose radiation. Pre-processing plays a vital role in removal of noise in an image. In this paper, the two filtering techniques have been proposed based on hybridizing the filters mean, median and maximum to de-noise a mammogram image.
This paper is organized as follows: Section II briefly reviews the existing filtering techniques, Section III describes the methodology, Experimental results are discussed in Section IV, Performance analysis is done in Section V and finally conclusion is presented in Section VI.
A number of filtering techniques have been proposed to remove the noise in a mammogram image. R.Ramani et al. [5] proposed a different filtering technique like Mean filter, Median filter, and Adaptive median filter, Wiener filter to remove Salt and Pepper, Gaussian and Speckle noise in an image. This result shows that the Adaptive Median filter is better while compared to other filters. The performance evaluation for MSE is 6.75 and highest PSNR is only 39.83. P.K Saranya et al. proposed methodology a noise reduction in breast ultrasound images using modified AVM Filter [1]. This result shows that modified AVM filter suppresses maximum Speckle noise in an image and yields 3% higher PSNR value than the existing AVM filter.
The various filtering algorithms are used to remove the noise from mammogram images and preserve the quality of them. These techniques have some advantages and disadvantages. Among the existing filters, none of them remove all types of noises in an image. It has been observed that the noise reduction in mammogram images is still an open research area to produce better results than the existing techniques. In our proposed method, a combination of Maximum, Mean, Median and Variance are implemented to remove the noise-free images from the mammograms. The details are discussed in the methodology section.
III. METHODOLOGY
Pre-processing
suspected as noise component in the proposed work. Image de-noising is carried out by the combination of Maximum, Mean, Median and Variance which is implemented in MATLAB. The overview of proposed methodology is depicted in Figure 1.
Figure 1. Diagramatic Representation of Proposed Methodology
Filtering Techniques
Filtering is the process of replacing a pixel with a new value based on the filtering functions. Mammogram images are corrupted by various types of noise in an image [6]. In order to remove the noise in an image various filtering techniques are explained below.
Maximum Filter
Maximum filter is used to find the brightest point in an image. The maximum filter selects the largest values within a local region of an image. It reduces the pepper noise in an image. Max Filter is also known as 100th
Input: Original Mammogram Image I
percentile filter.
Output: Noise Removed Image O
Step 1: Add Noise to the Original Image I. Step 2: Pad the Matrix with Zeros on all sides. Step 3: Consider the window size 3*3 and CP
Step 4: The maximum value is calculated by using Eq 1. be the center pixel of the window.
Max value = max (window) (1) Step 5: Replace the center pixel value with the maximum of the gray levels in the neighborhood of that pixel.
Step 6: Similarly, find the maximum by sliding the window on the whole image.
Repeat the Steps 3, 4, 5 until all the pixels in an image are replaced by the maximum value of the corresponding window.
AVM
AVM Filter is a combination of Mean, Median and variance. It reduces the Gaussian, Speckle and Poison noise in an image. The center pixel value of the window is replaced with average sum of row wise and column wise median and variance of the window.
Input: Original Mammogram Image I Output: Noise Removed Image O
Step 1: Add Noise to the Original Image I. Step 2: Pad the Matrix with Zeros on all sides. Step 3: Consider the window size 3*3 and CP
Step 4: Sort each column of I and calculate the sum of the median of column median and median of column variance
to be the center pixel of the window.
C = median (column_median (I)) + median (column_variance (I)) Step 5: Sort each row of I and calculate the sum of the median of row median and median of row variables
R = median (row_median (I)) + median (row_variance (I)) Step 6: Replace the center pixel value CP
C
with
P = (CP
Step 7: Repeat Step 3,4,5,6 until the window slides over an image.
+ C +R)/3 (2)
Mean Deviation about Mean
Mean Deviation about Mean reduces the Gaussian and Poison noise in an image. It is replaced with the average of the maximum mean deviation.
Input: Original Mammogram Image I Output: Noise Removed Image O
Step 1: Add Noise to the Original Image I. Step 2: Pad the Matrix with Zeros on all sides.
Step 3: Consider the window size 3*3 for Mean/Average Deviation about Mean Filter.
Step 4: Average of elements in the selected window is calculated and stored in the variable MAvg.
Step 5: Mean Deviation is calculated for all the elements by subtracting each and every element with MAvg and Deviations are stored in an array MM.
Step 6: Maximum among the values of the array MM is calculated along with its location.
Step 7: The locations which have Maximum Mean Deviation is replaced with the Average MAvg in the matrix B.
Step 8: Repeat Steps 3 to 7 until the window slides over all image pixels.
Step 9: Final filtered image is obtained in Matrix B.
Mean Deviation about Median
Mean Deviation about Median filter reduces the Salt and Pepper noise in an image. Mean Deviation about Median is replaced with the Mean of the maximum median deviation.
Input: Original Mammogram Image I Output: Noise Removed Image O
Step 1: Add Noise to the Original Image I. Step 2: Pad the Matrix with Zeros on all sides.
Step 3: Consider the window size 3*3 for Median Deviation about Median filter
Step 4: Average of elements in the selected window is calculated and stored in the variable MAvg.
Step 5: Calculate the median for the particular window. Step 6: Median Deviation is calculated for all the elements by subtracting each and every element with step 5 and deviations are stored in an array MM.
Step 7: Maximum value among MM is calculated along with its location.
Mammogram Image
Add a Noise
Apply Filter to Noisy Image
Filtered Image
Step 8: The Particular locations which have maximum Median Deviation is replaced with the Mean value in the matrix B.
Step 9: Repeat Step 3 to 7 until the window slides over all image pixels.
Step 10: Final filtered image is obtained in Matrix B.
Hybrid (MAX-AVM)
Hybrid filter is a combination of Maximum and AVM filter. Hybrid filter reduces the Gaussian, Salt and Pepper, Speckle and Poison Noise in an image.
Input: Original Mammogram Image I Output: Noise Removed Image O
1: Add Noise to the Original Image I.
Step 2: Pad the Matrix with Zeros on all sides. Step 3: Consider the window size 3*3 and CP
IV. EXPERIMENTAL RESULT ANALYSIS
to be the center pixel of the window.
Step 4: Compute the maximum value M using Eq. (1) Step 5: Replace the center pixel with the maximum value by sliding over an image and creates a new image as Out_image
Step 6: Consider the Out_image as an input to the AVM Filter.
Step 7: Compute the Mean, Median and Variance using Eq. (2)
Step 8: Repeat Step 4,5,6,7 until the window slides over an image.
Step 9: Final MAX-AVM filtered image is obtained in Matrix B.
The experimental result analysis of the proposed filter is tested and selected randomly from the Mammographic Image Analysis Society (MIAS) Database. The database consists of 322 mammogram images among 201 are normal images, 67 benign and 54 malignant images. The size of all mammogram images is 1024 *1024 pixels [2]. The combination of maximum and AVM filter has successfully
removed all types of noise from mammograms, the resultant mammogram is improved and noise free images which can be used for further processing like segmentation, Feature Extraction and Classification. Salt and pepper noise has been removed well in Mean Deviation about Median than Mean Deviation about Mean. Gaussian and Poison noise provide a better result in Mean Deviation about Median and Mean Deviation about Mean. Figure 2 shows the experimental result for Maximum, AVM, Mean Deviation about Mean, Mean Deviation about Median, Hybrid Filter (MAX-AVM) for four types of noises like Gaussian, Salt and Pepper, Speckle and Poison noise.
V. PERFORMANCE EVALUATION
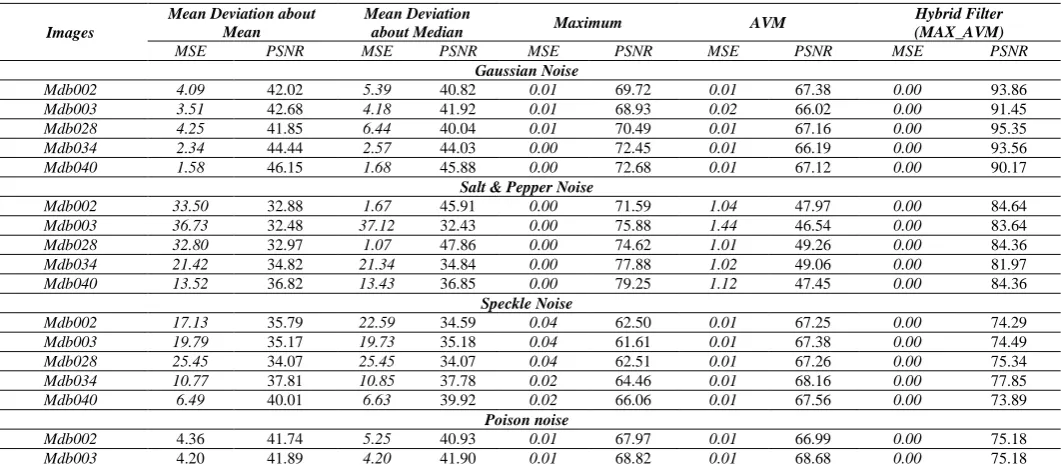
[image:3.595.327.545.296.383.2]Performance evaluation is to measure the quality of an original image and the filtered image. It is evaluated based on MSE and PSNR and the result is tabulated in Table II. The MSE is the cumulative squared error between the compressed and the original image, whereas PSNR is a measure of the peak error.
Table I. Formula Measures
Measures Formula
MSE
PSNR
MSE
2
10
255 log 10
Where I (x,y) is the original image, I' (x,y) is a reconstructed Image and M,N is the dimensions of the images. It produces a better result with a lower value for MSE indicate the lesser error and higher value of PSNR is good to indicate that the ratio of signal to noise is higher. Table II Shows the performance metrics of proposed and existing filtering techniques for four types of noise. Figure 3 and 4 graphically show the performance of various filters to different noises corresponding to the evaluation metrics MSE and PSNR respectively. From the observation, it is clear that the proposed filter is better than the existing filters.
Table II. Comparison between Existing and Proposed Filters
Images
Mean Deviation about Mean
Mean Deviation
about Median Maximum AVM
Hybrid Filter (MAX_AVM)
MSE PSNR MSE PSNR MSE PSNR MSE PSNR MSE PSNR
Gaussian Noise
Mdb002 4.09 42.02 5.39 40.82 0.01 69.72 0.01 67.38 0.00 93.86
Mdb003 3.51 42.68 4.18 41.92 0.01 68.93 0.02 66.02 0.00 91.45
Mdb028 4.25 41.85 6.44 40.04 0.01 70.49 0.01 67.16 0.00 95.35
Mdb034 2.34 44.44 2.57 44.03 0.00 72.45 0.01 66.19 0.00 93.56
Mdb040 1.58 46.15 1.68 45.88 0.00 72.68 0.01 67.12 0.00 90.17
Salt & Pepper Noise
Mdb002 33.50 32.88 1.67 45.91 0.00 71.59 1.04 47.97 0.00 84.64
Mdb003 36.73 32.48 37.12 32.43 0.00 75.88 1.44 46.54 0.00 83.64
Mdb028 32.80 32.97 1.07 47.86 0.00 74.62 1.01 49.26 0.00 84.36
Mdb034 21.42 34.82 21.34 34.84 0.00 77.88 1.02 49.06 0.00 81.97
Mdb040 13.52 36.82 13.43 36.85 0.00 79.25 1.12 47.45 0.00 84.36
Speckle Noise
Mdb002 17.13 35.79 22.59 34.59 0.04 62.50 0.01 67.25 0.00 74.29
Mdb003 19.79 35.17 19.73 35.18 0.04 61.61 0.01 67.38 0.00 74.49
Mdb028 25.45 34.07 25.45 34.07 0.04 62.51 0.01 67.26 0.00 75.34
Mdb034 10.77 37.81 10.85 37.78 0.02 64.46 0.01 68.16 0.00 77.85
Mdb040 6.49 40.01 6.63 39.92 0.02 66.06 0.01 67.56 0.00 73.89
Poison noise
Mdb002 4.36 41.74 5.25 40.93 0.01 67.97 0.01 66.99 0.00 75.18
[image:3.595.34.565.546.782.2]Mdb028 3.91 42.20 5.09 41.06 0.01 70.49 0.01 67.42 0.00 76.46
Mdb034 2.57 44.04 2.58 44.01 0.00 72.06 0.01 68.25 0.00 79.79
Mdb040 1.68 45.88 1.67 45.90 0.00 74.37 0.01 69.15 0.00 78.76
Original Image Gaussian Salt & Pepper Speckle Poison
Maximum
AVM
Mean Deviation about Mean
Mean Deviation about Median
Hybrid Filter(MAX_AVM)
Figure 2. Experimental Result
[image:4.595.33.565.45.755.2]Figure 3. MSE for various filters to different Noise
Figure 4. PSNR for Various Filters to Different Noise
VI. CONCLUSION
De-noising is an important step in the early diagnosis of the breast cancer. Pre-processing is to improve the image quality to make it suitable for further processing by removing or reducing the noise in an image without affecting the information in an image. The proposed hybrid statistical filters replace the pixel values which has highly deviated values with average or median and hence noise is suppressed. Results show that the proposed filter reduces the maximum noise in an image. The performance evaluation of Hybrid statistical filter, MAX_AVM shows higher the PSNR value indicate that the reconstruction of higher quality and lower value in the MSE indicate the less error when compared to existing filters. Hence this work is used in future research for better Segmentation, Feature Extraction and Classification for early diagnosis of breast cancer.
VII. REFERENCES
[2] Cholavendhan Selvaraj, Siva kumar R, Karnan M, "A Research on various Filtering Techniques in Enhancing Mammogram Image Segmentation", International Journal of Engineering Trends and Technology (IJETT) - Volume 9 No 9 - March 2014. [3] K.Meenakshi Sundaram , D.Sasikala, P.Aarthi Rani, "A Study
on Preprocessing a mammogram Image using Adaptive Median Filter",International Journal of Innovative Research in Science, Engineering and Technology ISSN:2319-8753, Vol.3,Issue 3, March 2014.
[4] Vidya.M, S.Dilip Kumar, " Study and Analysis of Various Pre-processing Techniques used in Breast Cancer Detection using Image Processing", International Journal foir Research in Applied Science & Engineering Technology (IJRASET), ISSN:2321-9653, Volume 4, Isuue 5, May 2016.
[5] R.Ramani, Dr.N.Suthanthira vanitha, S.valarmathy, "The Pre-Processing Techniques for Breast Cancer Detection in Mammography images", I.J.Image, graphics and Signal Processing, 2013,5,47-54, April 2013.
[6] Sheikh Tania and Raghad Rowaida, " A Comparative study of Various Image Filtering Techniques for Removing Various Noisy Pixels in Aerial Image", International Journal of Signal Processing, Image Processing and Pattern Recognition,Vol.9,No.3 (2016).