Volume 3, No. 4, July- August 2012
International Journal of Advanced Research in Computer Science
RESEARCH PAPER
Available Online at www.ijarcs.info
Performance Evaluation of AQM Algorithms for SRM based group communication in
Centralised Multicasting Network
Shaveta Khepra*
Computer Science Engineering
Dr. B R Ambedkar National Institute of Technology Jalandhar, India
Harsh K Verma
Computer Science Engineering
Dr. B R Ambedkar National Institute of Technology Jalandhar, India
Ashish Kumar
Computer Science Engineering
Dr. B R Ambedkar National Institute of Technology Jalandhar, India
Abstract: Over the last decade numerous active queue management (AQM) schemes have been proposed in the literature. Many of these studies have been directed towards improving congestion control in best-effort networks. However, there has been a notable lack of standardized performance evaluation of AQM schemes. A rigorous study of the influence of parameterization on specific schemes and the establishment of common comparison criteria is essential for objective evaluation of the different approaches. A framework for the detailed evaluation of AQM schemes is described in this paper. This provides a deceptively simple user interface whilst maximally exploiting relevant features of the NS2 simulator. The credibility of the results obtained is enhanced by vigilant treatment of the simulation data. The impact of AQM schemes on global network performance is assessed using three carefully selected metrics. These metrics are Throughput (Quantity of Service), Delay (Quality of Service) and Packet Drop.
Keywords: Congestion Control; SRR; RED; RIO; BLUE; SFB.
I. INTRODUCTION
AQM (Active Queue Management) techniques are used to improve the performance of network to transfer less congestion or congestion free data from sender to receiver. Research in this area was inspired by the proposal of RED algorithm in 1993[1]. These schemes are called active because they drop packets implicitly if the queue exceeds its limit or dynamically by sending congestion signal to sources [2]. This is in contrast to Drop-Tail queuing algorithm which is passive: packets are dropped if, and only if, the queue is full. On the basis of Drop probability many algorithms have been developed. Design goals of the various schemes, a wide range of network scenarios and performance metrics have been used to evaluate and compare AQM schemes. The challenge is to evaluate the various schemes proposed in a consistent and unbiased fashion. In this paper five AQM schemes are selected for detailed evaluation. The main criterion used for selection of these schemes is the ease with which they may be deployed in existing best-effort networks. The evaluation is carried out using a specially developed framework which uses the NS2 simulator [3]. A consistent evaluation of schemes using the chosen performance metrics facilitates an unbiased comparison which highlights their similarities and differences. The simulation results show better performances on packet loss rate, delay and throughput.
Multicasting is a widely used service in today’s computer networking system; it is mostly used in Streaming media,
Internet television, video conferencing and net meeting etc. Routers involved in multicasting packets need a better management over stacking system of packets to be multicast [4].The paper is organized as follows. Section 2 describes system topology, multicasting, CM and the descriptions of the different queue management algorithms like SRR, RED, RIO, SFB, and BLUE. Section 3 describes the simulation results of SRR, RED, RIO, SFB and BLUE queue algorithms using NS-2. Section 4 summarizes the dynamic queue algorithm and reports other approaches. Finally, section 5 concludes a future work.
II. SYSTEMDESCRIPTION
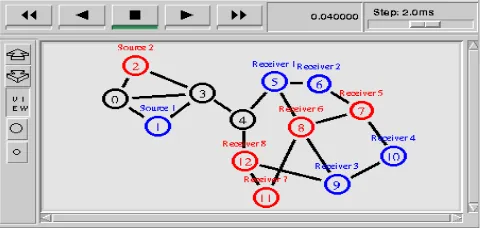
Figure 1. Topology Design
#Topology
$ns duplex-link $n0 $n1 2Mb 10ms DropTail $ns duplex-link $n0 $n2 2Mb 10ms DropTail $ns duplex-link $n0 $n3 2Mb 10ms DropTail $ns duplex-link $n3 $n1 1Mb 10ms DropTail $ns duplex-link $n3 $n2 1Mb 10ms DropTail $ns duplex-link $n3 $n4 1.544Mb 20ms Blue $ns duplex-link $n4 $n5 2Mb 10ms DropTail $ns duplex-link $n5 $n6 2Mb 10ms DropTail $ns duplex-link $n5 $n8 2Mb 10ms DropTail $ns duplex-link $n6 $n7 2Mb 10ms DropTail $ns duplex-link $n7 $n8 2Mb 10ms DropTail $ns duplex-link $n7 $n10 2Mb 10ms DropTail $ns duplex-link $n8 $n9 2Mb 10ms DropTail $ns duplex-link $n9 $n10 2Mb 10ms DropTail $ns duplex-link $n11 $n8 2Mb 10ms DropTail $ns duplex-link $n11 $n12 2Mb 10ms DropTail $ns duplex-link $n12 $n9 2Mb 10ms DropTail $ns duplex-link $n12 $n4 2Mb 10ms DropTail # Group Events
$ns at 0.5 "$n5 join-group $srm1 $group1" $ns at 0.9 "$n6 join-group $srm2 $group1" $ns at 2.0 "$n10 join-group $srm3 $group1" $ns at 9.0 "$n5 leave-group $srm1 $group1" $ns at 8.7 "$n6 leave-group $srm2 $group1" $ns at 9.5 "$n10 leave-group $srm3 $group1" $ns at 9.6 "$n9 leave-group $srmsink0 $group1" $ns at 0.3 "$n7 join-group $udp1 $group2" $ns at 0.5 "$n8 join-group $udp2 $group2" $ns at 1.0 "$n11 join-group $udp3 $group2" $ns at 8.0 "$n7 leave-group $udp1 $group2" $ns at 8.0 "$n8 leave-group $udp2 $group2" $ns at 9.5 "$n11 leave-group $udp3 $group2" $ns at 0.0 "$n12 join-group $udpsink0 $group2" $ns at 9.7 "$n12 leave-group $udpsink0 $group2"
Node 5, 6 and 10 will leave the group communication at 9.0s, 8.7s and 9.5s respectively whereas node 9 stays active throughout the communication period as CBR receiver. Node 7, 8 and 11 will leave the group communication at 8.0s, 8.0s and 9.5s respectively but node 12 stays active throughout the communication period as UDP receiver. Data rate for both senders is 832Kb. Queuing technique used on all the link except (3 – 4) is Drop Tail. The network is simulated for 10s.
A. CM (Centralized Mode):
The centralized multicast [5] is a sparse mode implementation of multicast similar to PIM-SM. A
Rendezvous Point (RP) rooted shared tree is built for a multicast group. The actual sending of prune, join messages etc. to set up state at the nodes is not simulated. A centralized computation agent is used to compute the forwarding trees and set up multicast forwarding state, S, G at the relevant nodes as new receivers join a group.
The method of enabling centralised multicast routing in a simulation is:
set mproto CtrMcast # set multicast protocol; set mrthandle [$ns mrtproto $mproto]
The command procedure []mrtproto returns a handle to the multicast protocol object. This handle can be used to control the RP and the boot-strap-router (BSR), switch tree-types for a particular group, from shared trees to source specific trees, and recompute multicast routes.
$mrthandle set_c_rp $node0 $node1 # set the RPs; set group1 [Node allocaddr]
set group2 [Node allocaddr]
B. SRM (Scalable Reliable Multicast):
Scalable Reliable Multicast [6] protocol which solves the buffer management problem, by distributing the required packets between the repair node and some selected receives which already received these packets. This distribution decreases the number of packets saved in the buffer of the repair node, thereby solves the congestion problem and increases the network throughput, the suggested method reduces the overhead in repair node by easing the burden of retransmit lost packets among the selective receivers, thereby increases the number of receivers that can be served by the repair node, which increases the scalability.
# SRM Agent
set srm0 [new Agent/SRM] $srm0 set dst_addr_ $group1 $srm0 set fid_ 1
$ns attach-agent $n1 $srm0 # Create a CBR traffic source set cbr0 [new Application/Traffic/CBR] $cbr0 attach-agent $srm0
$cbr0 set fid_ 1 set packetSize 210
$cbr0 set packetSize_ $packetSize $cbr0 set burst_time_ 500ms $cbr0 set idle_time_ 500ms $cbr0 set rate_ 832kb $srm0 set tg_ $cbr0 $srm0 set app_fid_ 0
$srm0 set packetSize_ $packetSize
III. QUEUEMANAGEMENTALGORITHM
In this section, we focus on RED, RIO, BLUE, SFB and SRR, and briefly explain them in each of the sub section. The main idea of this work is to compare these typical dynamic queuing algorithms instead of exhaustively reviewing the existing ones. This will be used in performance comparison.
A. RED:
avg. This is calculated using an exponentially weighted moving average filter and can be expressed as
avg ¨ (1 – wq) ◊ avg + wq ◊ q,
Where wq is filter weight. When the average queue size is smaller than a minimum threshold minth, no packets are dropped. When the average queue size exceeds the minimum threshold, the router randomly drops arriving packets with a given drop probability. As given in the Appendix, the probability that a packet arriving at the queue is dropped depends on the average queue length, the time elapsed since the last packet was dropped, and the maximum drop probability parameter maxp. If the average queue size is larger than a maximum threshold maxth, all arriving packets are dropped. It is shown in [8] that the average queue length avg increases with the number of active connections N (actually proportional to N2/3) in the system until maxth is reached when all incoming packets are dropped. We also observe that there is always an N where maxth will be exceeded. Since most existing routers operate with limited amounts of buffering, maxth is small and can easily be exceeded even with small N. Dropping all incoming packets may result in global synchronization, which is usually followed by a sustained period of low link utilization.
B. SRR:
Smoothed Round Robin, or SRR, is a work-conserving packet scheduling algorithm that attempts to provide maximum fairness while maintaining only O(1) time complexity [12].
In SRR two novel data structures, the weightmatrix (WM) and the weight spread sequence (WSS), are introduced to mitigate the problems of packet burstiness and fairness associated to ordinary RR-based schedulers with large number of sessions. The WM stores the bitwise weight representation associated to each backlogged session while the WSS provides the sequence order of sessions to service. For each x in the WSS visit the xth column of WM in a top-to-bottom manner and service the session containing the element 1. At the termination of WSS, repeat the servicing procedure by beginning with the first element of WSS. Since the WSS is predefined before any packet selection is made, only a constant time operation is required to obtain the next value from WSS. This gives SRR its O(1) time complexity [13].
C. BLUE:
BLUE [10] is an active queue management algorithm to manage congestion control by packet loss and link utilization history instead of queue occupancy. BLUE maintains a single probability, Pm, to mark (or drop) packets. If the queue is
continually dropping packets due to buffer overflow, BLUE increases Pm, thus increasing the rate at which it sends back
congestion notification or dropping packets. Conversely, if the queue becomes empty or if the link is idle, BLUE decreases its marking probability. This effectively allows BLUE to “learn” the correct rate it needs to send back congestion notification or dropping packets.
The typical parameters of BLUE are d1, d2, and freeze_time. d1determines the amount by which Pm is increased when the queue overflows, while d2 determines the
amount by which Pm is decreased when the link is idle. freeze_time is an important parameter that determines the minimum time interval between two successive updates of Pm. This allows the changes in the marking probability to take effect before the value is updated again. Based on those parameters. The basic blue algorithms can be summarized as following:
Upon link idle event: if ((now-last_update)>freeze_time)
Pm = Pm-d2; Last_update = now;
Upon packet loss event: if ((now– last_updatte)>freeze_time)
Pm = Pm+d1; last_update = now;
Figure 2. BLUE Algorithm
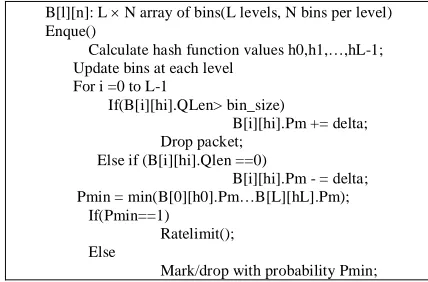
D. SFB:
Based on BLUE, Stochastic Fair Blue (SFB) [11] is a novel technique for protecting TCP flows against non-responsive flows. SFB is a FIFO queuing algorithm that identifies and rate-limits non-responsive flows based on accounting mechanisms similar to those used with BLUE. SFB maintains accounting bins. The bins are organized in L levels with N bins in each level. In addition, SFB maintains L independent hash functions, each associated with one level of the accounting bins. Each hash function maps a flow into one of the accounting bins in that level. The accounting bins are used to keep track of queue occupancy statistics of packets belonging to a particular bin. As a packet arrives at the queue, it is hashed into one of the N bins in each of the L levels. If the number of packets mapped to a bin goes above a certain threshold (i.e., the size of the bin), the packet dropping probability Pm for that bin is increased. If the number of
packets in that bin drops to zero, Pm is decreased. The
observation is that a non-responsive flow quickly drives Pm to
1 in all of the L bins it is hashed into. Responsive flows may share one or two bins with non-responsive flows, however, unless the number of non-responsive flows is extremely large compared to the number of bins, a responsive flow is likely to be hashed into at least one bin that is not polluted with non-responsive flows and thus has a normal value. The decision to mark a packet is based on Pmin the minimum Pm value of all
bins to which the flow is mapped into. If Pmin is 1, the packet
is identified as belonging to a non-responsive flow and is then rate-limited.
B[l][n]: L × N array of bins(L levels, N bins per level) Enque()
Calculate hash function values h0,h1,…,hL-1; Update bins at each level
For i =0 to L-1
If(B[i][hi].QLen> bin_size)
B[i][hi].Pm += delta; Drop packet;
Else if (B[i][hi].Qlen ==0)
B[i][hi].Pm - = delta; Pmin = min(B[0][h0].Pm…B[L][hL].Pm);
If(Pmin==1) Ratelimit(); Else
[image:3.612.340.554.558.699.2]Mark/drop with probability Pmin;
The typical parameters of SFB algorithm are QLen, Bin_Size, d1, d2, freeze_time, N, L, Boxtime, Hinterval. Bin_Size is the buffer space of each bin. Qlen is the actual queue length of each bin. For each bin, d1, d2 and freeze_time have the same meaning as that in BLUE. Besides, N and L are related to the size of the accounting bins, for the bins are organized in L levels with N bins in each level. Boxtime is used by penalty box of SFB as a time interval used to control how much bandwidth those non-responsive flows could take from bottleneck links. Hinterval is the time interval used to change hashing functions in our implementation for the double buffered moving hashing. Based on those parameters, the basic SFB queue management algorithm is shown in the above table.
E. RIO:
The RIO algorithm [9] allows two traffic classes within the same queue to be treated differently by applying a drop preference to one of the classes. RIO is an extension of RED, "RED with In and Out". RIO can be viewed as the combination of two RED algorithms with different drop probability curves, chosen to give one group of packets preference. For OUT packets, as long as the average queue size is below minth_out no packets are dropped. If the average queue size exceeds this, arriving packets are dropped with a probability that increases linearly from 0 to maxp_out. If the average queue size exceeds maxth_out, all OUT packets are dropped. Note that the average queue size is based on the total number of packets in the queue, regardless of their marking. For IN packets, the average queue size is based on the number of IN packets present in the queue and the parameters are set differently in orders to start dropping OUTs well before any INs are discarded. However, when there are only OUT (or best-effort) packets, RIO has to perform much like RED. Therefore we have to set OUT parameters following almost the same rules as for RED.
IV. SIMULATIONRESULTS
[image:4.612.327.553.60.217.2]A. Throughput:
Figure 4 show the throughput graph for CBR traffic of link (3 – 4). RED provides average maximum throughput of 729.792Kb/s whereas maximum throughput in case of RED queuing technique is 772.8Kb/s. SFB queuing algorithm provides minimum average throughput of 674.352K/s. 787.92Kb/s is the maximum throughput value in case of Blue algorithm, 727.44Kb/s in case of RIO and 712.32Kb/s in case of SFB, and 725.76Kb/s in SRR queuing algorithm. We can analyze from that all the algorithms initially start with lesser throughput of about 340Kb/s. The required throughput is 832Kb/s which is closely achieved in case of RED queuing algorithm.
Figure 4. Throughput of bottleneck link (3–4) for CBR Traffic
Figure 5 show the throughput graph for Pareto traffic of link (3 – 4). SFB provides average maximum throughput of 800.016Kb/s whereas maximum throughput in case of SFB queuing technique is 833.28Kb/s. RED queuing algorithm provides minimum average throughput of 744.408K/s. 809.76Kb/s is the maximum throughput value in case of Blue algorithm, 833.28Kb/s in case of RIO and 833.28Kb/s in case of SRR, 776.16Kb/s in RED queuing algorithm. We can analyze from that all the algorithms initially start with lesser throughput of about 495Kb/s. The required throughput is 832Kb/s which can be closely achieved by SFB queuing algorithm.
Figure 5. Throughput of bottleneck link (3–4) for Pareto Traffic
B. Drop of Packets:
[image:4.612.339.566.384.525.2]Figure 6. Number of Dropped packets at Node 3
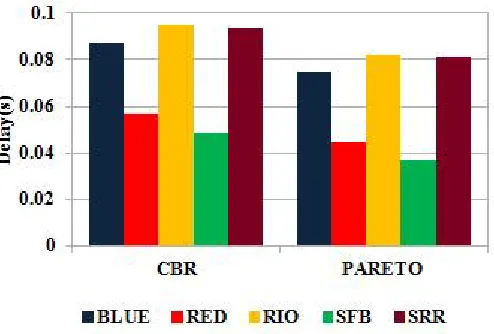
C. End to End Delay:
[image:5.612.40.287.346.513.2]Figure 7 shows the end to end delay graph for CBR and Pareto Traffic. Graph has been plotted against Type of Traffic on x-axis and average end to end Delay on y-axis.RIO shows maximum average end to end delay for CBR and Pareto i.e. 0.094454s and 0.082104s respectively. SFB shows minimum average end to end delay for CBR and Pareto Traffic i.e. 0.048808s and 0.036895s respectively.
Figure 7. Average end-to-end delay for CBR and Pareto traffic
[image:5.612.41.285.578.701.2]Table 1 shows the average end to end delay for BLUE, RED, RIO, SFB and SRR queuing algorithms.
Table I. Average end-to-end delay for CBR and Pareto
AQM Delay(s)
CBR(Node 9) PARETO(Node 12)
BLUE 0.086846 0.074556
RED 0.056706 0.044644
RIO 0.094454 0.082104
SFB
0.048808 0.036895
SRR 0.093459 0.081113
V. CONCLUSIONS
We have compared the performance of BLUE, RED, RIO, SFB and SRR with a standard parameter setting such as bandwidth for source to receiver link is 1.544 Mb/s. Performance metrics are Throughput, average queuing delay and the Packet Drop.
Our main findings are:
RED provides maximum throughput for CBR traffic while SFB provides maximum traffic for Pareto Traffic.
RIO, SFB and SRR show significantly lesser number of Drop of Packets for Pareto Traffic while RED shows minimum Drop of Packets for CBR Traffic. These AQM techniques are best suited because users are sensitive for delay.
SFB shows minimum average end to end Delay for CBR and Pareto Traffic.
SFB shows maximum throughput and minimum number of packet drops for Pareto Traffic and RED shows maximum throughput and minimum number of drops for Pareto Traffic.
SFB and RED show significantly better performance above all other AQM techniques in case of CM-SRM multicast network.
VI. REFERENCES
[1] S. Floyd and V. Jacobson, “Random Early Detection Gateways for Congestion Avoidance,” IEEE/ACM Trans. Net., vol. 1, no. 4, Aug. 1993, pp. 397–413.
[2] S. Floyd, “TCP and explicit congestion notification,” ACM Computer Communication Review, vol. 24, no. 5, pp. 10–23, 1994.
[3] The ns Manual (formerly ns Notes and Documentation), The VINT Project A Collaboration between researchers at UC Berkeley, LBL, USC/ISI, and Xerox PARC. Kevin Fall [email protected], Editor Kannan Varadhan [email protected], Editor, May 9, 2010.
[4] Ashish Kumar, Ajay K Sharma, Arun Singh, “Performance Evaluation of Centralized Multicasting Network over ICMP Ping Flood for DDoS,” International Journal of Computer Applications (0975 – 8887) Volume 37– No.10, January 2011.
[5] S. Deering, D. Estrin, D. Farinacci, V. Jacobson, Ching-Gung Liu, and L. Wei. Architecture for wise-area multicast routing. Technical Report USC-SC-94-565, Computer Science Department, University of Southern California, Los
Angeles, CA 90089, 1994. http://www.isi.edu/nsnam/ns/doc/node342.html.
[7] S. Floyd and V. Jacobson, “Random Early Detection Gateways for Congestion Avoidance,” IEEE/ACM Trans. Net., vol. 1, no. 4, Aug. 1993, pp. 397–413.
[8] R. Morris, “Scalable TCP Congestion Control,” Proc. IEEE INFOCOM 2000, Tel Aviv, Israel, Mar. 26–30, 2000, pp.1176–83.
[9] “Recommendations on Queue Management and Congestion Avoidance in the Internet” http://tools.ietf.org/html/draft-ibanez-diffserv-assured-eval-00.
[10] “The BLUE Active Queue Management Algorithms” Wu-chang Feng, Kang G. Shin, Fellow, IEEE, Dilip D. Kandlur, Member, IEEE, and Debanjan Saha, Member, IEEE
[11] Wu-chang Feng Dilip D. Kandlur Debanjan Saha Kang G. Shin “Stochastic Fair Blue: A Queue Management Algorithm for Enforcing Fairness”.
[12] “The Smoothed Round-Robin Scheduler Paul” Southerington, Member, IEEE.