Missing values in big data research: some basic skills
Zhongheng Zhang
Department of Critical Care Medicine, Jinhua Municipal Central Hospital, Jinhua Hospital of Zhejiang University, Jinhua 321000, China Correspondence to: Zhongheng Zhang, MMed. 351#, Mingyue Road, Jinhua 321000, China. Email: [email protected].
Introduction
Missing value occurs when there is no data value for a variable in an observation. The phenomenon of missing value is universal in clinical researches involving big data. Nurses may forget to record urine output at a certain time point. Patients may have only one measurement of blood lactate, while the researcher is interested in exploring the impact of lactate trend on mortality outcome. Other reasons of missing values include but not limited to coding
errors, faulty equipment and nonresponses (1). In statistical packages, some commands (e.g., logistic regression) may automatically deleted observations with missing values. There is no problem if there are a few incomplete observations. However, when there are a large number of observations with missing values, the default listwise deletion may result in significant loss of information. In such situation, analysts should take a close look at the missing patterns and find appropriate means to cope with it. The present article will introduce how missing values are Author’s introduction: Zhongheng Zhang, MMed. Department of Critical Care Medicine, Jinhua Municipal Central Hospital, Jinhua Hospital of Zhejiang University. Dr. Zhongheng Zhang is a fellow physician of the Jinhua Municipal Central Hospital. He graduated from School of Medicine, Zhejiang University in 2009, receiving Master Degree. He has published more than 35 academic papers (science citation indexed) that have been cited for over 200 times. He has been appointed as reviewer for 10 journals, including Journal of Cardiovascular Medicine, Hemodialysis International, Journal of Translational Medicine, Critical Care, International Journal of Clinical Practice, Journal of Critical Care. His major research interests include hemodynamic monitoring in sepsis and septic shock, delirium, and outcome study for critically ill patients. He is experienced in data management and statistical analysis by using R and STATA, big data exploration, systematic review and meta-analysis.
Submitted Oct 15, 2015. Accepted for publication Nov 23, 2015. doi: 10.3978/j.issn.2305-5839.2015.12.11
View this article at: http://dx.doi.org/10.3978/j.issn.2305-5839.2015.12.11
handled in R, and provide some basic skills in dealing with missing values.
How missing value is handled in R
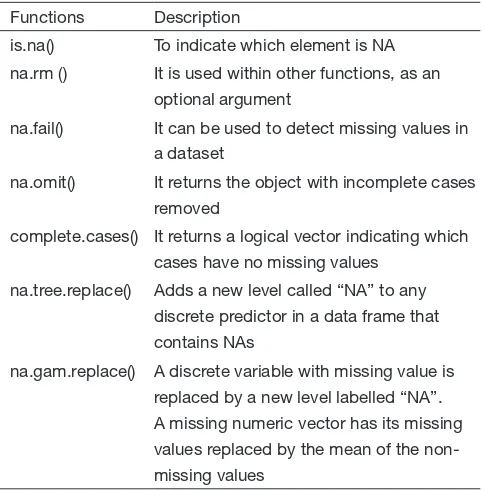
Missing value is represented by the symbol NA (not available) in R. When you read an Excel spreadsheet containing empty cells into R console, these empty cells will be replaced by NAs. This is different from STATA where empty cells are replaced with “.”. The same missing value symbol is used in R for both numeric and character variables. R provides several functions for handling missing value (Table 1).
The function is.na() is the most commonly used method to indicate which element is NA. It returns logical values (FALSE or TRUE) and have the same length as its argument. Suppose we have six patients. Five lactate values are recoded and one is missing.
>lactate<-c(0.2,3.3,4.5,NA,6.1,2.4) >is.na(lactate)
[1] FALSE FALSE FALSE TRUE FALSE FALSE > which(is.na(lactate))
is missing in the forth patient.
Someone may think of using logical test (e.g., lactate==NA) to examine the missing pattern. This can never be TRUE because missing values are considered non-comparable and you have to use missing value functions. The “==” operator returns NA when either argument is NA. By using which() function, you can locate which element of a vector contains NA. In the example, which() function returns 4, indicating the forth patient has missing lactate.
Next, you may want to describe lactate levels of the six patients. In statistical description, mean, variance and standard deviation are among the most commonly used statistics.
>mean(lactate) [1] NA
>sum(lactate) [1] NA >var(lactate) [1] NA >sd(lactate) [1] NA
All of these functions return NA value because the vector lactate contains missing values. Fortunately, there is a function na.rm() to remove NAs when applying statistical functions.
>mean(lactate,na.rm=TRUE) [1] 3.3
>sd(lactate,na.rm=TRUE) [1] 2.219234
The results are exactly what you want. Both mean and standard deviation are calculated based on the five patients with lactate values available.
Data frame with missing values
In real world setting, what you encounter is missing values in a data frame. Thus, this section focuses on how to handle data frames with missing values. First we create a data frame of three variables and five observations.
>ptid<-c(1,2,3,4,5)
[image:2.595.46.288.98.343.2]>sex<-c("m","f",NA,"f","m") Table 1 R functions to handle missing values
Functions Description
is.na() To indicate which element is NA na.rm () It is used within other functions, as an
optional argument
na.fail() It can be used to detect missing values in a dataset
na.omit() It returns the object with incomplete cases removed
complete.cases() It returns a logical vector indicating which cases have no missing values
na.tree.replace() Adds a new level called “NA” to any discrete predictor in a data frame that contains NAs
ptid sex lactate
1 1 m 0.2
2 2 f 3.3
3 3 <NA> 4.5
4 4 f NA
5 5 m 6.1
Note that the third patient have missing value on sex, and the forth patient have missing value on lactate.
> na.fail(data)
Error in na.fail.default(data) : missing values in object
The function na.fail() can be used to detect missing values in a dataset. If there is no missing value it returns the assigned object (see below). If there is missing value it returns an error message indicating there is one or more missing values in the dataset.
Although some good default settings in regression model can effectively ignore observations with missing values, it is useful to create a new data frame by omitting observations with missing values.
> na.omit(data)
ptid sex lactate
1 1 m 0.2
2 2 f 3.3
5 5 m 6.1
The function na.omit() returns the object with incomplete cases removed. As you can see, the third and forth patients with missing value in one variable are removed. Alternatively, the same purpose can be achieved by using the following code.
> complete.data<- data[complete.cases(data), ] > complete.data
ptid sex lactate
1 1 m 0.2
2 2 f 3.3
5 5 m 6.1
By applying na.fail() to the complete dataset obtained by na.omit(), the error message is replaced by a new complete dataset. The test passed when the new dataset
contains no NAs.
> na.fail(complete.data)
ptid sex lactate
1 1 m 0.2
2 2 f 3.3
5 5 m 6.1
Sometimes you may want to locate which variable of a patient contains missing value. Try functions is.na() and which() as described previously.
> is.na(data)
ptid sex lactate
[1,] FALSE FALSE FALSE
[2,] FALSE FALSE FALSE
[3,] FALSE TRUE FALSE
[4,] FALSE FALSE TRUE
[5,] FALSE FALSE FALSE
> which(is.na(data)) [1] 8 14
It returns 8 and 14 indicating the location of missing values. R counts the place in a column-wise fashion. There is no problem when the dataset is not large. However, if the dataset is large (always the case in big data exploration) you are overwhelmed by a long list of location numbers. The following code helps you to select observations with at least one missing value.
> unique (unlist (lapply (data, function (x) which (is.na (x)))))
[1] 3 4
As expected, the returned results indicate the third and forth patients who have at least one missing variable. The function lapply() returns a list of the locations of missing values across variables ptid, sex and lactate. Unlist() simplifies list structure to produce a vector. When there is more than one missing value in an observation, unique() simplified it to list observations with missing values only once.
> unlist(lapply(data, function(x) sum(is.na(x))))/ ncol(data)
ptid sex lactate
0.0000000 0.3333333 0.3333333
Missing values in regression model
Regression model building is probably the most commonly used in statistical analysis. However, details on missing values are always omitted in regression model fitting. With small number of missing values, it is safe to fit a model by default argument. Problem may arise with substantial number of missing values and analysts have to understand how missing values are handled in model building. Here the difference between na.omit() and na.exclude() will be shown.
For the illustration purpose, I will regress lactate on patient id. Of course, this has no practical meaning.
> model.omit <- lm(ptid ~lactate, data = data, na.action = na.omit)
> model.exclude <- lm(ptid ~lactate, data = data, na.action = na.exclude)
> resid(model.omit)
1 2 3 5
0.3895652 -0.60522 -0.37739 0.593044 > resid(model.exclude)
1 2 3 4 5
0.3895652 -0.60522 -0.37739 NA 0.593044 > fitted(model.omit)
1 2 3 5
0.6104348 2.605217 3.377391 4.406957 > fitted(model.exclude)
1 2 3 4 5
0.6104348 2.605217 3.377391 NA 4.406957
As you can see, the na.exclude() function pads the residuals and fitted values with NAs where there are missing values. However, the na.omit() function simply exclude observations with missing values. In this regard, na.exclude() is a placeholder for missing values.
Some advanced functions for missing values
lactate values may indicate that the patient have been fully recovered from shock (e.g., lactate is a biomarker of tissue hypoperfusion and hypoxia and clinicians typically do not order lactate for patients who are hemodynamically stable). Therefore, NAs in lactate indicates stable patients. Because NAs contain important information, it is wise to add a new category called “NA” to replace the missing values. You can try na.tree.replace() in the tree package for this purpose (2). However, this function is limited by the fact that it is only applicable for discrete variables with missing value. I create a new data frame for the illustration.
>install.packages(“tree”) >library(tree)
>data.discrete<-data.frame(ptid=c(1,2,3,4,5),lactate =c("low",NA,"moderate",NA,"high"),death=c("y","y", NA,"n","y"))
> na.fail(data.discrete)
Error in na.fail.default(data.discrete) : missing values in objects
> newdata.discrete<-na.tree.replace(data.discrete) > na.fail(newdata.discrete)
ptid lactate death
1 1 low y
2 2 NA y
3 3 moderate NA
4 4 NA n
5 5 high y
The data frame data.discrete contains three variables and the last two discrete variables have NAs. The error message returned by na.fail() indicates NAs in the data frame data.discrete. Then, a new data frame called newdata. discrete is created by using na.tree.replace(). The na.fail() function returns the new data frame without error. As you can see missing values are replaced by string value “NA”. The limitation of na.tree.replace() is that it stops if any continuous variable contains NAs.
> na.tree.replace(data) Error in na.tree.replace(data):
continuous variable lactate contained NAs
> install.packages(“gam”) > library(foreach)
> library(gam)
> newdata<-na.gam.replace(data) > na.fail(newdata)
ptid sex lactate
1 1 m 0.200
2 2 f 3.300
3 3 NA 4.500
4 4 f 3.525
5 5 m 6.100
Note that the data frame newdata pass the na.fail() test and returns the new dataset. For variable sex the missing value is replaced by string value “NA”, and the missing numeric value of lactate is replaced by the mean of the available lactate values.
Summary
The article reviews some basic skills in dealing with missing values in R. missing values in R cannot be compared by using logical operators and thus specific function is.na() is fundamental in judging whether an object contains missing value or not. There are varieties of tips to do with missing values in data frame. Some useful codes are to locate and count missing values by using lapply() function. Lapply() is very useful in that it applies
functions across all variables while avoiding the time-consuming loop functions. Regression model performs casewise deletion of missing values by default. However, the performance of na.omit() and na.exclude() with respect to residuals and fitted values of NAs. There are also some advanced packages for handling missing values. These include na.tree.replace() in tree package and na.gam. replace() in gam package.
Acknowledgements
None.
Footnote
Conflicts of Interest: The author has no conflicts of interest to declare.
References
1. Montez-Rath ME, Winkelmayer WC, Desai M. Addressing missing data in clinical studies of kidney diseases. Clin J Am Soc Nephrol 2014;9:1328-35.
2. Ripley B. Tree: classification and regression trees (2007). (R
package version 1.0-26).
3. Hastie T. Gam: generalized additive models (2011). (R package version 1.06.2).