Volume 5, No. 8, Nov-Dec 2014
International Journal of Advanced Research in Computer Science
REVIEW ARTICLE
Available Online at www.ijarcs.info
Overview on Data Mining Schemes to Design Business Intelligence Framework for
Mobile Technology
Manish P. Tembhurkar
Department of CSE,G. H. Raisoni College of Engineering, Nagpur, India
Dr. R. M. Tugnayat
Principal,S. S. Agnihotri College of Engineering, Wardha, India
Ashlesha S. Nagdive
Department of IT,G. H. Raisoni College of Engineering, Nagpur, India
Abstract:Mining is such as automated technology which facilitates us to find the relations between various parameters and predicts the future outcomes of business sector. Mining tools (data mining, text mining, and web mining) are used to foreseen the future, profit, investment relations in large databases for BI. In this paper, we review various data mining tools and techniques and their performance in BI sectors. Finally, we shall state some of the important factors to be considered while designing & developing a BI framework using data mining techniques for various sectors.
Business Intelligence (BI) has turned out to be a predictable technological advantage in the last couple of years, for the large enterprises (especially Mobile Technology Ventures). Such ventures could afford to buy, implement and maintain BI solutions. Recently, small and medium size enterprises all over the globe have understood the competitive and financial benefits of BI. However, limited IT budgets of small companies and BI’s high total cost of ownership have created a gap between large and small enterprises where small enterprises do not become fortunate to avail the virtues of BI because of the affordability factor.
This Paper provides the systematic study and analysis of various factors (Data Mining techniques, BI framework and their effects on designing a successful automated decision making system). It presents the strong knowledge foundation so that one can give a proper justice to achieve BI objectives.
Keywords: Data Mining, Data visualization, Data warehousing, Mobile Technology, Nanocube, Spatiotemporal dataset, OLAP, Business Intelligence.
I. INTRODUCTION
A. Data Mining:
Data mining is the technology comprises of tools and techniques for the extraction and analysis of knowledge in systematic format from the large database. Sometimes, the large amount of data is very hard, complex and time consuming to process and derive the expected outcome from it. Larger the size if database, larger will be the processing overload, delay for processing. Furthermore, the extraction of exact required knowledge for analyse is crucial when it comes for the BI sector. The prior objective of any BI is to achieve business patterns. These BI patterns [1] are further being processed and analysed for designing new business goals. Data mining uses tools and techniques for the following [2].
Prediction Classification
Segmentation/clustering
Affinity analysis using association rules.
B. Business Intelligence [3]:
BI can be defined as the collection of tools and techniques. BI transforms raw data into significant information useful for analyzing business systems. Business Intelligence refers to the process of collection, structuring,
analyzing and leveraging of so that it can be converted into to easily understandable structure. The objective of BI is to assist a user to make easy decision to assist their business.
C. BI Terms [3]:
There are several BI terms currently in discussion such as,
operational databases, OLTP,
Data warehouse, data mart,
OLAP and OLAP Server, Drill down/up,
ad-hoc query and analysis, dimension,
Fact/Measure, KPI,
dashboard, and scorecard.
D. BI Tools [3]:
BI tools are the tools & techniques in the form of application software designed to
The BI techniques primarily read data that have been provided, though a data warehouse or data mart. BI tools can be categorised into the following three categories:
a) Query and reporting;
b) Online analytical processing (OLAP); and c) Information mining/ Data Mining
II. DATAMININGALGORITHMS
Data recovery operations and future prediction operations are based on the data mining techniques used. Figure 2 demonstrates some of the significant techniques and algorithms to produce and learn fascinating system patterns.
The Data warehousing [4] & Data mining techniques [5] are initially classified as either Predictive or Descriptive Data Mining Models. In addition, we further provide comparative Analysis of four Data Mining Techniques & Algorithms in Table I. These four techniques are;
a) Nanocubes
b) Association Rule Mining c) Classification
d) Regression
Definitions and limitations are stated for these respective Data Mining techniques in Table I.
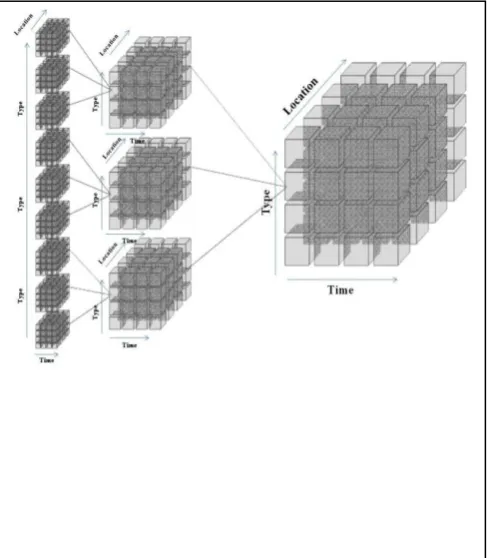
A. Data Mining with Spatiotemporal Datasets (Nanocubes) [11]:
Nanocubes provide a possible solution for an efficient storage and to access high dimensional datasets shown in figure. As datasets get larger, exploratory data visualization becomes more difficult. Consider a dataset with a billion entries. We can compute a small summary of the dataset and visualize the summary instead of the dataset, summaries might help, but in order to understand if that is the case, we will inevitably find ourselves having to visualize over million residuals.
Figure 1. Data Visualization with Data Cubes (3 dimensions: Type, Location & Time) [16]
B. Classification:
Figure 2. Classification of Data Mining Algorithms
Data Mining Models
Predictive
Association Rule
Apriori Algorithm
Eclat Algorithm
FP- growth Algorithm
Clustering
K-Means
Bi-Clustering
Density Based
Agglomerative Hierarchic
Descriptive
Classification
C 4.5
K-Nearest Neighbor Algorithm
Naïve Bayes
ADA BOOS
Regression
Generalized Linear Models
Table I. Comparative Analysis of Data Mining Techniques & Algorithms
Sr. No. Techniques Algorithm Name Introduction Limitations
1 NANOCUBES OLAP Datacubes [8]
• Data cubes are structures that perform aggregations across every possible set of dimensions of a table in a database, to support quick exploration. [7]
• High Dimensional Data Visualization [16]
• Timings for the queries are dominated by network and user-interaction latencies. (WM) • specifically to answer queries from
interactive visualization systems that explore massive datasets [7]
2 ASSOCIATION RULE MINING
Apriori Algorithm [12]
• Apriori Algorithm find frequent item sets from a transaction dataset and derive association rules [12]
• Candidate generation generates large numbers of subsets. [12]
3 CLASSIFICATION C4.5
• C4.5 is an algorithm used to generate a decision tree. [13]
• Such systems take as input a collection of cases, each belonging to one of a small number of classes and described by its values for a fixed set of attributes, and output a classifier that can accurately predict the class to which a new case belongs.
• Does not work well with small training data set [13]
• Small variation in data can lead to different decision trees (especially when the variables are close to each other in value)
4 REGRESSION Support Vector Machines
• In machine learning, support vector are supervised learning models with associated learning algorithms that analyze data and recognize patterns, used for classification and regression analysis. [14]
• The aim of SVM is to find the best classification function
• to distinguish between members of the two classes in the training data.
• One of the initial drawbacks of SVM is its computational inefficiency [14]
• SVM is a binary classifier. To do a multi-class classification, pair-wise classifications
• can be used (one class against all others, for all classes
III. REQUIREMENTOFBIINMOBILE TECHNOLOGY
Data mining provides overviews, filters, zooming, and details-on-demand inside the spatiotemporal dimensions themselves. But three stages are to be achieved for using the technique of Data Cubes [8] before we proceed on further objectives:
a. Design OLAP Datacubes b. Data Aggregation c. Data Visualization
Whereas the Mobile Technologies Index [6] is concerned, a broad composite of eight enabling components that underlie the power of the mobile device & communication [9] to sense, analyse, store and connect information for Business Intelligence sector. The eight components are as follows:
a. Device connectivity speed b. Infrastructure speed c. Processor speed
d. Memory
e. Storage
f. Image sensor
g. Display
h. Mobile operating system*
A. Mobile Innovations Forecast[6]:
Questions in Mobile Technology require not just a keen understanding of the innovative approaches of the enabling technologies, but also a wider approach for analysing mobile innovation quantitatively and qualitatively. Four-part frameworks for analysing and understanding mobile innovation are:
a. Enabling technologies;
b. New technological capabilities; c. New use cases and
d. New business models.
.
Figure 3. Mobile technologies index - relative progress of components (source: IHS Supply Database) [15]
Table II. Top 30 Mobile Service Provider companies in the world (Source: RBI, Financial Access 2013-CGAP) [15]
Sr.
No. Company Country
Total subscribers (Millions)
1. China Mobile China 775.6 2. Vodafone UK 419.4 3. China Unicom China 285.7 4. Airtel India 275.2 5. América Móvil Mexico 269.9 6. Telefónica Spain 254.7 7. Axiata Malaysia 239.7 8. Orange France 231.5 9. VimpelCom Ltd. Russia 209 10. China Telecom China 185 11. MTN Group South Africa 175.98 12. Etisalat UAE 167 13. Telenor Norway 166 14. TeliaSonera Swedan/
Finland 160 15. T-Mobile Germany 142.5 16. Saudi Telecom Company (STC) Saudi Arabia 139 17. Reliance Communications India 135.88 18. Verizon Wireless USA 122 19. Idea Cellular India 113.9 20. AT&T Mobility USA 116.01 21. MTS Russia 106.07 22. Telecom Italia Mobile (TIM) Italy 102.5 23. BSNL India 96.28 24. Tata Teleservices India 77.4 25. Turkcell Turkey 70.7 26. Aircel India 66.79 27. Smart Communications Philippines 72.5 28. Maxis Communications Malaysia 63.71 29. MegaFon Russia 62 30. Ooredoo Qatar 60.53
a) Automation due to Information and
Communications Technology (ICT) b) Business needs of service providers
c) There is also a growing need from industry players such as banks, educational institutions, healthcare providers etc. to use mobile applications and other value added services as a channel to provide easy access to services to their customers, as well as, increase productivity and efficiency of employees. d) MVAS is also being seen as a means for reaching
customers who were previously inaccessible due to lack of the presence of physical infrastructure and/ or high cost of servicing in remote areas.
Figure 4. Number of subscribers (in millions) of region
We believe there is a vast scope for the research in Mobile Technology here in India. There are various positive aspects about the country, such as,
a. India has the 2nd largest population in the world, hence Mobile users cover 2nd largest portion of the total population of the world.
i. Total number of mobile phones in India: 904,510,000
ii. Total Population of the country: 1,220,800,359
0 500 1000 1500 2000 2500 3000
Africa Asia Europe North
America
Total
iii. Ranks with respect to mobile phone users in the world: 2nd
iv. phones per 100 citizens: 74.09 mobile phones per 100 citizens
b. 13 mobile service providers in the country
c. 6 Indian Mobile providers Operators have secured their positions in "top 30 Mobile Network Operators in the world" list
d. 2nd Highest no. of mobile phone users in the world after China.
i. Total no. of mobile users in India: 765.45 millions
ii. Total no. of mobile users in the world: 5362.45 millions
iii. Ratio: 1/7
Table III. Number of Subscribers (in millions) in region (Countrywise)
Region/ Country Sum of Total subscribers (Millions)
Africa 175.98
South Africa 175.98
Asia 2754.19
China 1246.3
India 765.45
Malaysia 239.7
Malaysia 63.71
Philippines 72.5
Qatar 60.53
Saudi Arabia 139
UAE 167
Europe 1924.37
France 231.5
Germany 142.5
Italy 102.5
Norway 166
Russia 377.07
Spain 254.7
Swedan/ Finland 160
Turkey 70.7
UK 419.4
North America 507.91
Mexico 269.9
USA 238.01
Grand Total 5362.45
IV. DATATRANSFORMINGINTOBI
Data Transforming into BI is a revolutionary approach to understand the potentials of business enterprises and to test their limits. This approach provides the completive advantages; understand the hidden relations between various business components. Every system has to have a systematic approach to achieve its ultimate goal. Implementing Data mining in BI is no other exception.
Figure 5. Data Transforming into BI [2]
Following are the five important stages (as shown in Figure 5) to apply data transforming into BI successfully. A. Collection of Raw data from Business Enterprise B. Data Cleaning through search Engines & Filtering
process
C. Data warehousing
D. Implementation of BI tools E. Analyzing outputs
Some of the BI tools in the market are,
• IBM Cognos [18];
• ProClarity [19];
• and QlikView [20]
V. CONCLUSION
Business sector is very dynamic in nature and BI tools provide us the BI solutions to keep up with rapidly evolving sector. When the Data Mining technique was first used for finding BI solutions, the approach opens the door for vast possibilities in future business sector. The Mobile Technology sector is currently a booming sector. Data mining assists us to calculate E-Business solutions for this growing sector. In this paper, we provide a systematic overview of three important domains (Data Mining, Business Intelligence & Mobile Technology). The paper will surely assist to help designing the BI framework to understand the Mobile Technology components. To find BI relations requires BI framework. Data mining techniques are the key component of such framework.
VI. ACKNOWLEDGMENT
One of us (M. P. Tembhurkar.) thanks RBI, Financial Access 2013-CGAP for providing Mobile consumer database & Raman Chitkara, Founder of Mobile Innovations Forecast for guiding us through the necessity of BI in Mobile Technology sector.
VII. REFERENCES
[1] Mohamed Ridda Laouar and Sean B. Eom, “Book: Business Intelligence and Mobile Technology Research: An Information Systems Engineering Perspective”, Cambridge Scholars Publishing, ISBN (10): 1-4438-5507-3, ISBN (13): 978-1-4438-5507-5, 2014.
[2] Abdul-Aziz Rashid Al-Azmi, “Data, Text, And Web Mining For Business Intelligence: A Survey”, International Journal of Data Mining & Knowledge Management Process (IJDKP) Vol.3, No.2, March 2013 [3] Muhammad Sohail, Khalid Khan, Rizwan Iqbal and
Noman Hasany, “Developing Business Intelligence Framework to Automate Data Mapping, Validation, and Data Loading from User Application”, International Journal of Computer Theory and Engineering, Vol. 4, No. 5, October 2012.
[4] Risi, M. ; Sessa, M.I. ; Tucci, M. ; Tortora, G., “CoDe Modeling of Graph Composition for Data Warehouse Report Visualization”, IEEE Transactions on Knowledge and Data Engineering, Volume:26 , Issue: 3, 2014. [5] Zeljko Panian, “The Evolution of Business Intelligence:
From Historical Data Mining to Mobile and Location-based Intelligence”, WSEAS International Conference on Recent Researches in Business and Economics, ISBN: 978-1-61804-102-9, 2012
[6] Raman Chitkara, “Mobile Innovations Forecast: The elements of contextual intelligence”, Mobile Innovations Forecast: Phase II, PwC, 2014
[7] LauroLins, James T. Klosowski, and Carlos Scheidegger, “Nanocubes for Real-Time Exploration of Spatiotemporal Datasets”, IEEE Transactions on Visualization And Computer Graphics, Vol. 19, No. 12, December 2013. [8] Abello, A. ; Romero, O. ; Pedersen, T. ; Berlanga Llavori,
R. ; Nebot, V. ; Aramburu, M. ; Simitsis, A., “Using Semantic Web Technologies for Exploratory OLAP: A Survey”, IEEE Transactions on Knowledge and Data Engineering, Volume: PP, Issue: 99, 2014. [9] Deepak Pareek, “Book: Business Intelligence for
Telecommunications”, CRC Press, 29-Nov-2006, ISBN 0-8493-8792-2. Retrieved 18 March 2008.
[10] N. Elmqvist and J. D. Fekete, “Hierarchical aggregation for information visualization: Overview, techniques, and design guidelines”, IEEE Transactions on Visualization and Computer Graphics, 16(3):439–454, May 2010. [11] “Real – Time exploration of spatiotemporal datasets”
Official web site
http://www.nanocubes.net
[12] Rakesh Agrawal and Ramakrishnan Srikant “Fast algorithms for mining association rules in large databases”. Proceedings of the 20th International Conference on Very Large Data Bases, VLDB, pages 487-499, Santiago, Chile, September 1994.
[13] Wei Dai, Wei Ji, “A MapReduce Implementation of C4.5 Decision Tree Algorithm”, International Journal of Database Theory and Application, vol 7, issue 1 pp. 49-60, 2014
[14] Max Welling, “Support Vector Machines”, Department of Computer Science, University of toranto,
http://www.ics.uci.edu/~welling/classnotes/papers_class/S VM.pdf
[15] “IHS iSuppli Mobile and Wireless Communication Service” official Website
https://technology.ihs.com/
[16] Vinod S. Bawane, Shireesh P. Bhoyar, Manish Tembhurkar, “A Review on High Dimensional Data Visualization”, International Journal of Emerging Trends in Engineering and Development (IJETED 2014), Issue 4, Vol.3, Page 878-884, ISSN 2249-6149, R S. Publication (rspublication.com), May 2014.
[17] “SAP Business Objects” official website https://www.sapbusinessobjectsbi.com/ [18] “IBM Cognos software” official website
http://www.ibm.com/software/analytics/cognos/ [19] “ProClarity - XLCubed” official website by Microsoft
http://www.xlcubed.com/proclarity/
[20] “Qlik: Business Intelligence and Data Visualization Software” official website
![Figure 3. Mobile technologies index - relative progress of components (source: IHS Supply Database) [15]](https://thumb-us.123doks.com/thumbv2/123dok_us/695194.1077160/4.595.40.558.57.335/figure-mobile-technologies-relative-progress-components-supply-database.webp)
![Figure 5. Data Transforming into BI [2]](https://thumb-us.123doks.com/thumbv2/123dok_us/695194.1077160/5.595.31.562.263.711/figure-data-transforming-into-bi.webp)
