Global lunar-surface mapping experiment using the Lunar
Imager/Spectrometer on SELENE
Junichi Haruyama1, Tsuneo Matsunaga2, Makiko Ohtake1, Tomokatsu Morota1, Chikatoshi Honda1, Yasuhiro Yokota1, Masaya Torii1, Yoshiko Ogawa2,
and the LISM Working Group
1Institute of Space and Astronautical Science, Japan Aerospace Exploration Agency,
Yoshinodai 3-1, Sagamihara City, Kanagawa 229-8510, Japan
2National Institute for Environmental Studies, 16-2 Onogawa, Tsukuba City,
Ibaraki 305-8506, Japan
(Received April 2, 2007; Revised August 24, 2007; Accepted October 31, 2007; Online published April 9, 2008)
The Moon is the nearest celestial body to the Earth. Understanding the Moon is the most important issue confronting geosciences and planetary sciences. Japan will launch the lunar polar orbiter SELENE (Kaguya) (Katoet al., 2007) in 2007 as the first mission of the Japanese long-term lunar exploration program and acquire data for scientific knowledge and possible utilization of the Moon. An optical sensing instrument called the Lunar Imager/Spectrometer (LISM) is loaded on SELENE. The LISM requirements for the SELENE project are intended to provide high-resolution digital imagery and spectroscopic data for the entire lunar surface, acquiring these data for scientific knowledge and possible utilization of the Moon. Actually, LISM was designed to include three specialized sub-instruments: a terrain camera (TC), a multi-band imager (MI), and a spectral profiler (SP). The TC is a high-resolution stereo camera with 10-m spatial resolution from a SELENE nominal altitude of 100 km and a stereo angle of 30◦to provide stereo pairs from which digital terrain models (DTMs) with a height resolution of 20 m or better will be produced. The MI is a multi-spectral imager with four and five color bands with 20 m and 60 m spatial resolution in visible and near-infrared ranges, which will provide data to be used to distinguish the geological units in detail. The SP is a line spectral profiler with a 400-m-wide footprint and 300 spectral bands with 6–8 nm spectral resolution in the visible to near-infrared ranges. The SP data will be sufficiently powerful to identify the lunar surface’s mineral composition. Moreover, LISM will provide data with a spatial resolution, signal-to-noise ratio, and covered spectral range superior to that of past Earth-based and spacecraft-based observations. In addition to the hardware instrumentation, we have studied operation plans for global data acquisition within the limited total data volume allotment per day. Results show that the TC and MI can achieve global observations within the restrictions by sharing the TC and MI observation periods, adopting appropriate data compression, and executing necessary SELENE orbital plane change operations to ensure global coverage by MI. Pre-launch operation planning has resulted in possible global TC high-contrast imagery, TC stereoscopic imagery, and MI 9-band imagery in one nominal mission period. The SP will also acquire spectral line profiling data for nearly the entire lunar surface. The east-west interval of the SP strip data will be 3–4 km at the equator by the end of the mission and shorter at higher latitudes. We have proposed execution of SELENE roll cant operations three times during the nominal mission period to execute calibration site observations, and have reached agreement on this matter with the SELENE project. We present LISM global surface mapping experiments for instrumentation and operation plans. The ground processing systems and the data release plan for LISM data are discussed briefly.
Key words:Moon, camera, imagery, multi-band, spectral, stereo.
1.
Introduction
The Moon is the nearest celestial body to the Earth. How-ever, these two bodies exhibit totally different features: the Earth has an atmosphere, oceans, and living plants and ani-mals, whereas the Moon appears to have ceased all internal activity and is covered by nothing but fine dust (regolith) with small to massive craters. Since long ago, the Moon has remained a most important target to be studied.
In the 1960s and 1970s, the Moon was explored using
Copyright cThe Society of Geomagnetism and Earth, Planetary and Space Sci-ences (SGEPSS); The Seismological Society of Japan; The Volcanological Society of Japan; The Geodetic Society of Japan; The Japanese Society for Planetary Sci-ences; TERRAPUB.
numerous unmanned and manned missions of the United States and the Soviet Union. Remote sensing data, in-situ experiment data, and returned sample data provided by the missions were analyzed in great detail. Consequently, an excellent dataset was obtained for use in geology, geochem-istry, mineralogy, petrology, chronology, and internal struc-ture of the Moon that is unequaled by that for any plane-tary body other than the Earth (Hiesinger and Head, 2006). The view revealed by handling the dataset became a stan-dard. For example, the Moon is known not to be a prim-itive body. Its dark areas, called mare, mainly comprise basalt; lightly colored areas called high-lands, which are mostly anorthosite, are probably related to the existence of
Fig. 1. SELENE mission profile (from JAXA photo archives, photo no. P-044-0001-13123). SELENE will be launched from the Tanegashima Space Center in the summer of 2007. After the launch, the SELENE will take the phasing orbit, revolving around the Earth to adjust its time-position with the Moon. After about one month of the phasing orbit, the SELENE will be injected into the orbit revolving the Moon. The initial perilune and apolune of the SELENE will be 100 km and 13,000 km, respectively. During the Descending phase, the two sub-satellites will be released from the SELENE main orbiter. The SELENE main orbiter will be finally a polar circular orbit of nominal altitude of 100 km. The LISM main power will be usually off during the phasing orbit, and occasionally on to check the power on/off with telemetry condition. First one and half months of the circulating orbit phase, the initial checkout phase in a one or a few days will be assigned for each mission instrument to confirm the possibility of transition to normal operation phase with checking if its telemetries and commands will be normally worked. In the initial checkout phase, the LISM will execute main function checks with imagery and line profiling operations.
the magma ocean. Lunar craters are mostly not of volcanic origin but are of impact origin (e.g. Melosh, 1989), mare volcanism was last active between nearly 3.9 and 3.1 Ga (Hiesinger and Head, 2006; Head, 1976; Nyquist and Shih, 1992).
The 1990s brought a new era with new views that had been improved from previous ones, with global material mapping experiments by Galileo, Clementine, and Lunar Prospector. Using those explorers’ global data, we con-firmed that the Moon is more complex than had been thought. Lunar crustal terrains have been distinguished into at least three major units: (1) the Procellarum KREEP Ter-rane, (2) the Feldspathic High-land Terrane (FHT), and (3) the South Pole–Aitken Terrane (SPAT) (Jolliffet al., 2000). Volcanic activities likely lasted until nearly 1–2 b.y. ago (Hiesingeret al., 2000, 2003). At the lunar polar regions, the hydrogen concentration has been confirmed (Feldman et al., 1998, 1999, 2001; Lawrenceet al., 2006) although whether hydrogen on the pole regions form water or not, and the origin of the hydrogen has been studied (e.g. Butler, 1997; Starukhina, 2000, 2006; Lawrenceet al., 2006) but not established.
In this coming era for new views of the Moon, Japan will also launch the SELENE (Kaguya) lunar polar orbiter (Kato et al., 2007) in 2007 as the first mission of the Japanese long-term lunar exploration program, which will acquire
data for scientific knowledge and possible utilization of the Moon. Three satellites constitute SELENE: the main lunar orbiter with a nominal altitude of 100 km (±30 km) (Sasaki et al., 2003) and two small sub-satellites (the relay satellite and the VRAD satellite) with a semi-major axis of 3000 km (Namikiet al., 1999; Iwataet al., 2007). SELENE will as-sume a phasing orbit after its launch and approach the Moon in about one month (see Fig. 1 for a schematic mission pro-file of SELENE). The key items of SELENE are listed in Table 1.
We will load an optical instrument on SELENE’s main orbiter. This instrument is the Lunar Imager/SpectroMeter (LISM), which consists of three sub-instruments: a terrain camera (TC), multi-band imager (MI), and a spectral pro-filer (SP) (Haruyamaet al., 2000, 2001, 2003a, 2007). The quality of data obtained by the LISM will be superior in spa-tial resolution, wavelength resolution, and signal-to-noise ratio (SNR) to that acquired in previous lunar missions. In addition, LISM will satisfy the requirements listed above. We present the LISM instruments and its operational plan for lunar global mapping.
2.
Outline of Scientific Requirements for LISM
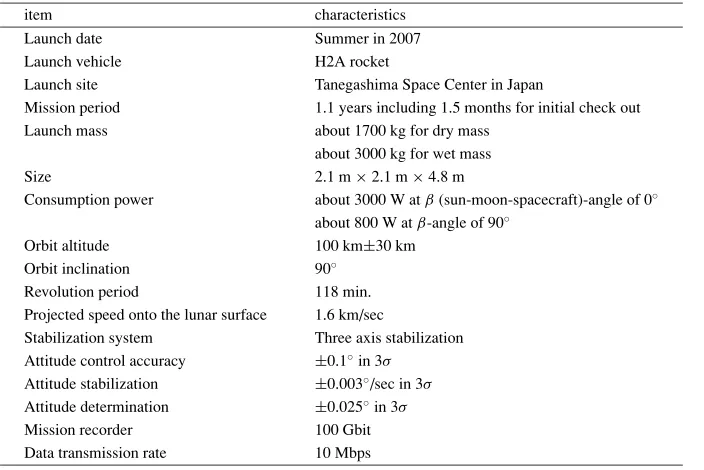
mineralog-Table 1. Key items of the SELENE main orbiter.
item characteristics
Launch date Summer in 2007
Launch vehicle H2A rocket
Launch site Tanegashima Space Center in Japan
Mission period 1.1 years including 1.5 months for initial check out
Launch mass about 1700 kg for dry mass
about 3000 kg for wet mass
Size 2.1 m×2.1 m×4.8 m
Consumption power about 3000 W atβ(sun-moon-spacecraft)-angle of 0◦ about 800 W atβ-angle of 90◦
Orbit altitude 100 km±30 km
Orbit inclination 90◦
Revolution period 118 min.
Projected speed onto the lunar surface 1.6 km/sec
Stabilization system Three axis stabilization Attitude control accuracy ±0.1◦in 3σ
Attitude stabilization ±0.003◦/sec in 3σ Attitude determination ±0.025◦in 3σ
Mission recorder 100 Gbit
Data transmission rate 10 Mbps
ical information than that obtained by past lunar explo-rations. We describe the outline of requirements for LISM from some important perspectives such as the age, distribu-tion and materials of geological units to provide a scientifi-cally important dataset.
2.1 Age
Understanding relative and absolute chronology is ex-tremely important to timestamp the Moon’s geologic records. The most reliable timestamp is radiometric age, as provided from rock and/or sand samples. However, global collection of samples is nearly impossible for the Moon. A popular alternative means to determine the age of a geo-logical unit is crater counting, which is based on the simple principle that the crater size distribution in a region depends on the erupted date of the region. Correlating crater data of a region with radiometric ages from returned samples on the Moon, the crater counting chronology was developed to in-fer the ages of even unsampled geological units and provide the lunar stratigraphy (Hiesinger and Head, 2006; Neukum et al., 2001).
The 1990s’ Galileo, Clementine, and Lunar Prospector explorers provided new perspectives of the Moon’s mate-rial distribution. The cumulative crater frequency Ncum(D)
at diameter Dis expressed in the form ofc D−b, wherec
andbare coefficients (e.g. Melosh, 1989). Therefore, be-cause the counting error ofNcum(D)is estimated simply
us-ing Ncum(D)1/2, the better the detectability of the smallest
craters becomes, the less the error would be. For example, when the smallest detectable crater diameter improves by 10 times, the error would decrease to 10−b/2. On the Moon, bis 2–3.4 in the case of a crater diameter of less than 4 km (Melosh, 1989). Consequently, the accuracy of this case would be at least 10 times and even as much as 50 times im-proved when the spatial resolution increases 10 times. The smaller error for crater counting leads to improved accuracy of the model age estimation. Although the 60–100 m spatial resolution data imply a model age of 2 Ga with nearly 1 Ga
error in 2σthe 10 m resolution data can give a model age of 2 Ga with a few tens of millions of years’ error in 2σ (Mo-rotaet al., in preparation) because past lunar mission data have not covered the entirety of mare regions at 10 m resolu-tion and almost 60 m or worse (Wilhelms, 1987) or obtained at too much higher solar elevation angle conditions to de-tect craters as for Clementine (see Nozetteet al., 1994 and NSSDC catalogues for information about the Clementine mission and cameras on board the Clementine spacecraft). Therefore, the 10 m scale global coverage with appropriate solar elevation angle conditions of less than 30–40◦is def-initely required for imagery exploration of the Moon from the perspective of crater-counting chronology.
Another approach to investigate the relative age is spe-cific examination of the degradation state of smaller craters of less than 1 km diameter. The smallest diameters of de-stroyed craters are nearly 1000 m, 500 m, and 100 m for craters on the volcanic basalts formed in pre-Imbrian (Nec-tarian), Imbrian, and Eratosthenian, respectively (Wilhelms, 1987). For that reason, the degradation extents of craters with diameters of 1 km to 500 m, 500–100 m, and less than 100 m respectively provide information about the relative age of Imbrian, Eratosthenian, and Copernican mare units in great detail. For example, an Eratosthenian unit is clas-sified in terms of its relative age by investigating depths of craters with 400 m diameter in the range from 80 m (for fresh bowl shape craters) to 0 m (for destroyed craters). Therefore, data with a few tens-of-meters’ or better height resolution are very useful to investigate the relative age, as inferred from the crater degradation state.
2.2 Distribution of geological units
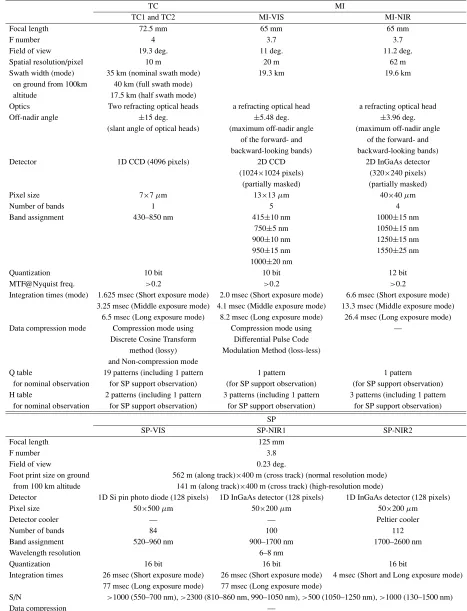
Table 2. LISM (TC, MI, and SP) hardware specifications.
TC MI
TC1 and TC2 MI-VIS MI-NIR
Focal length 72.5 mm 65 mm 65 mm
F number 4 3.7 3.7
Field of view 19.3 deg. 11 deg. 11.2 deg.
Spatial resolution/pixel 10 m 20 m 62 m
Swath width (mode) 35 km (nominal swath mode) 19.3 km 19.6 km
on ground from 100km 40 km (full swath mode) altitude 17.5 km (half swath mode)
Optics Two refracting optical heads a refracting optical head a refracting optical head
Off-nadir angle ±15 deg. ±5.48 deg. ±3.96 deg.
(slant angle of optical heads) (maximum off-nadir angle (maximum off-nadir angle of the forward- and of the forward- and backward-looking bands) backward-looking bands)
Detector 1D CCD (4096 pixels) 2D CCD 2D InGaAs detector
(1024×1024 pixels) (320×240 pixels) (partially masked) (partially masked)
Pixel size 7×7μm 13×13μm 40×40μm
Number of bands 1 5 4
Band assignment 430–850 nm 415±10 nm 1000±15 nm
750±5 nm 1050±15 nm
900±10 nm 1250±15 nm
950±15 nm 1550±25 nm
1000±20 nm
Quantization 10 bit 10 bit 12 bit
MTF@Nyquist freq. >0.2 >0.2 >0.2
Integration times (mode) 1.625 msec (Short exposure mode) 2.0 msec (Short exposure mode) 6.6 msec (Short exposure mode) 3.25 msec (Middle exposure mode) 4.1 msec (Middle exposure mode) 13.3 msec (Middle exposure mode)
6.5 msec (Long exposure mode) 8.2 msec (Long exposure mode) 26.4 msec (Long exposure mode)
Data compression mode Compression mode using Compression mode using —
Discrete Cosine Transform Differential Pulse Code method (lossy) Modulation Method (loss-less) and Non-compression mode
Q table 19 patterns (including 1 pattern 1 pattern 1 pattern
for nominal observation for SP support observation) (for SP support observation) (for SP support observation) H table 2 patterns (including 1 pattern 3 patterns (including 1 pattern 3 patterns (including 1 pattern
for nominal observation for SP support observation) for SP support observation) for SP support observation) SP
SP-VIS SP-NIR1 SP-NIR2
Focal length 125 mm
F number 3.8
Field of view 0.23 deg.
Foot print size on ground 562 m (along track)×400 m (cross track) (normal resolution mode) from 100 km altitude 141 m (along track)×400 m (cross track) (high-resolution mode)
Detector 1D Si pin photo diode (128 pixels) 1D InGaAs detector (128 pixels) 1D InGaAs detector (128 pixels)
Pixel size 50×500μm 50×200μm 50×200μm
Detector cooler — — Peltier cooler
Number of bands 84 100 112
Band assignment 520–960 nm 900–1700 nm 1700–2600 nm
Wavelength resolution 6–8 nm
Quantization 16 bit 16 bit 16 bit
Integration times 26 msec (Short exposure mode) 26 msec (Short exposure mode) 4 msec (Short and Long exposure mode) 77 msec (Long exposure mode) 77 msec (Long exposure mode)
S/N >1000 (550–700 nm),>2300 (810–860 nm, 990–1050 nm),>500 (1050–1250 nm),>1000 (130–1500 nm)
Data compression —
ejecta distribution, lava flow fronts and so on were obtained and became information to distinguish the geological units. Systematically acquired imagery data with a high SNR and high spatial resolution are necessary to divide the geolog-ical units in detail and exactly. For example, to
con-ditions of a lower solar elevation angle of less than 45◦ is probably necessary to provide data for spreading extents of lava flows.
Spectral information is also important for dividing the geological units. As described in the preceding subsec-tion, especially the Clementine global multi-spectral data, with nearly 100 m resolution, provided information to in-vestigate each geological unit in detail. Clementine spectral data also provided information of the Moon’s subsurface structure. Tompkins and Pieters (1999) examined central peaks of more than 100 craters using Clementine UV-VIS multi-spectral data and discussed the lunar crust’s compo-sitional diversity. Pieters et al.(2001) analyzed the min-eralogical diversity of the South Pole–Aitken Basin, also using Clementine UV-VIS data, and discussed implications for basin evolution. The techniques to determine the lithol-ogy of the lunar surface using Clementine UV-VIS data developed by Tompkins and Pieters (1999) and Pieterset al.(2001) have often been used (e.g. Giguereet al., 2006). Dividing geological units and analyzing the materials with multi-spectral data is now a standard method for geological study of the Moon. Clementine data were, in that sense, a key to open the new era of lunar studies. However, higher spatial resolution for multi-spectral data is now necessary to understand diverse conditions of materials, not only in the horizontal but also vertical range and to discuss them in greater detail. For example, the difference of materials be-tween stratified lava flows under the surface, each of which is only 10 m thick or less (H¨orz et al., 1991), might be detected using multi-band imagery with resolution greater than 100 m at the floor of a 100-m-diameter crater when we focus on a fresh bowl-shaped crater with a diameter-to-depth ratio of 0.2.
2.3 Materials
The ultimate means of studying the Moon’s material, of course, is to recover samples and analyze them using state-of-the-art techniques in ground laboratories. However, sample-returning missions from all over the Moon are al-most impossible. For that reason, remotely sensed data play important roles to investigate the materials constituting the Moon. In the 1990s’ three missions, Galileo, Clementine, and Lunar prospector’s UV to NIR camera data, in addi-tion to data from the gamma-ray spectrometer, yielded ex-tremely important information related to lunar crustal ma-terials and their distributions (summarized in Jolliffet al., 2001). The information related to elements provided by the gamma-ray spectrometry and the X-ray spectrometry are important to elucidate materials of the lunar crust. On the other hand, visible to near-infrared spectral investiga-tion has the following characteristics or merits compared to data obtained using gamma-ray and X-ray spectrometers: (1) the UV-NIR spectral observation can provide informa-tion related to the minerals themselves and (2) the spatial resolution of visible to near-infrared spectral observation onboard is 1 km or better currently, although the spatial res-olution of gamma-ray and X-ray spectrometers onboard is a few 10 km at best.
The dataset of Galileo and Clementine UV-NIR multi-band spectra has served important roles for lunar science progress. However, the following problems are pointed out:
the dataset has a lack of bands or is insufficiently calibrated in the longer wavelength region>1μm, where key absorp-tion bands of the lunar minerals exist. Pyroxene has its ab-sorption bands at 0.9–1.0 μm and 1.8–2.3μm, olivine in 1.0–1.1 μm, and plagioclase in 1.2–1.3μm (e.g. Pieters, 1993). Therefore, to discuss the constituent minerals in the surface and subsurface area of the Moon in greater detail, it is necessary to acquire a comprehensive visible-to-near-infrared spectral dataset, especially in the NIR region and well calibrated for the entire Moon.
2.4 Summary requirements
As described above, a more detailed and global imagery and spectral dataset is strongly required to advance the lunar sciences using an optical instrument such as LISM. Here we summarize the requirements for LISM:
- high-resolution data at 10 m spatial resolution at ap-propriate solar elevation angle conditions less than 30– 40◦;
- multi-band images with spatial resolution at 100 m or higher;
- stereo-pair images to produce digital terrain models (DTMs) with relative height resolution of few tens of meters; and
- spectral profiling data in the visible to the near-infrared range with onboard calibrators for wavelength and ra-diance.
We install LISM consisting of three sub-instruments to sat-isfy the above requirements: (1) Terrain Camera (TC), Multi-band Imager (MI), and Spectral Profiler (SP) on SE-LENE (Kaguya). The LISM (TC, MI, and SP) hardware specifications are listed in Table 2. We introduce these in-struments and their operation plan in the following sections.
3.
LISM Instrumentation Outline
3.1 Terrain Camera (TC)
The mission objectives of the TC are to provide (1) global/local high-contrast mosaicked maps with 10 m pixel resolution of the Moon and (2) DTMs for the Moon’s en-tirety, with relative height resolution of a few tens of meters or better and ultimately a DEM with absolute height infor-mation (Haruyamaet al., 2003b, 2005, 2006a, b), which are expected to become base data for lunar sciences and future lunar explorations.
TC telescopes
MI telescopes
LRU (SP)
TC/MI Cover
SELENE bus 20cm
42cm
29cm 30cm
22cm 25cm
+Z
+Y
+X LRU(TC/MI )
A
B C
Fig. 2. (A) LISM Radiation Units: LRU (TC/MI) and LRU (SP) drawing. The LRUs are mounted on+Z plane facing the Moon. Since the SELENE will be operated as the sun light irradiates onto the−Y plane of the SELENE during the nominal operation, the radiators of LISM are put on the+Y plane of the LRUs. The SELENE moves along the+or −X direction. The reversing the flight direction will be carried out once in about half year by Yaw Around maneuver. The LRU (TC) has two slant optical heads: TC1(+X) and TC2(−X). The LRU (MI) also has two but nadir optical heads: MI-VIS(+X) and MI-NIR(−X). The LRU (TC/MI) is covered by a box. The LRUs are finally covered by black Multi-layered Insulators (not drawn in this figures). The SP NIR1 and NIR2 detectors are mounted on the+X side of the LRU(SP) and the SP-VIS detector is mounted on the−X side. (B), (C) Photos of LISM radiator units: the left is LRU(TC/MI) and the right is LRU(SP). See text for detailed explanations.
The linear detector in each TC optical head has 4096-pixels which are 7×7μm with a panchromatic visible range filter of 430–850 nm. The TC data are obtained using push-broom scanning (see Fig. 4). Both of the TC telescopes are 72.5 mm. For that reason, the TC cross-track field of view of each pixel is 5.5×10⁻³◦. Future TCs will have
10-m cross-track pixel resolution at 100 km nominal alti-tude. The TC sampling interval has been designed to be 6.5 ms and then 10 m on the ground along the track. Be-cause the SELENE attitude control accuracy is designed to achieve±0.003◦/s (or 2×10⁻⁵◦/s) (see Table 1), the dizzi-ness of TC pointing vectors will be within 0.4% or less of TC pixel resolution for both the along and cross track fields. Therefore, a conservative evaluation for the DTM height resolution from spatial resolution over the base to height results in 17 m. Moreover, refined stereo-matching techniques such as sub-pixel matching can achieve better height resolution than a few tens-of-meters for TC stereo pairs (Haruyama et al., in preparation). The active pixels are changed by commands in three modes: full (4096 pixels active), nominal (3504 pixels active, including four dummy pixels for compression), and half (1752 pixels active
in-SELEN nominal altitude of 100km
57km
Lunar surface SELENE orbit TC backward
looking angle of 15
TC forward looking angle of 15
Center of the Moon
Fig. 3. TC stereo-configuration. The TC slant angles are±15◦from the nadir vector. When the SELENE nominal altitude is 100 km, the base line of the TC stereo-pair is 0.57.
Fig. 4. TC flight configuration. The TC swath will be 35/40 km for normal/full swath mode at the SELENE nominal altitude of 100 km, thus the TC adjacent strip images will have extended overlaps.
cluding two dummy pixels for compression). The FOV is 22.4◦, 19.3◦, and 9.65◦ for full, nominal, and half swath modes (the swaths on the ground will be 40 km, 35 km and 17.5 km). The interval between SELENE’s adjacent orbits will be 33 km at an altitude of 100 km. Consequently, the TC adjacent strip images will have extended overlaps with the same solar angle conditions, which will facilitate the production of large mosaic images.
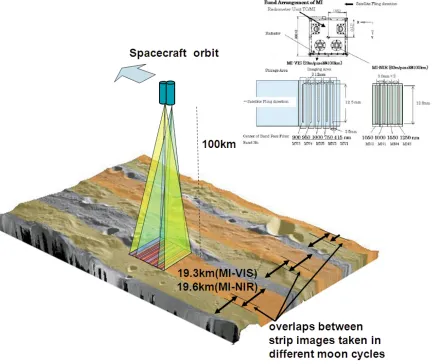
Fig. 5. MI flight configuration and its band pass filter placement. The swath of MI is 19.3 km, and is too narrow to have overlaps between sequential strips of MI in almost areas except for the high latitudes. The imaging gaps left in the one Moon cycle operation for MI will be taken in the coming opportunities. To set the appropriate orbits for MI filling the observation gaps, the SELENE will carry out the change of its orbital plane.
flight model test revealed a high SNR of more than 100 at a solar reflectance intensity of 2%, which makes it pos-sible to distinguish one-degree slope areas from flat areas at solar elevation angles of less than 40◦(Haruyamaet al., 2003b, 2004). We adopted an onboard lossy DCT compres-sion method for the TC to reduce the data volume. There are 32 patterns installed in the onboard Q-table, including 13 for redundancy. The TC has a non-compression mode. Non-compressed data will be used to estimate the compres-sion error.
3.2 Multi-band Imager (MI)
The mission objectives of the MI are to provide global mosaicked maps of geological units with 20 m and 62 m pixel resolutions in the visible and near-infrared ranges, which will be one-order higher resolution than Clemen-tine’s UV-VIS and NIR camera data (Ohtakeet al., 2003, 2007). The maps produced using the MI color band data will be used (1) to search for the most primitive lunar costal materials, (2) to clarify the horizontal and vertical structure of Mare basalt, (3) to survey the mantle-rock distribution, and (4) to clarify the impact crater formation mechanism.
The MI has two optical heads, MI-VIS and MI-NIR, for the visible range and near-infrared range. Each head is com-posed of a nadir-refracting telescope, a two-dimension
SIR on Smart-1 (0.94 m - 2.4 SP on SELENE ( 0.54 - 2. )
MI−NIR MI−VIS
0.30 0.60 0.90 1.20 1.50 1.80 2.10 2.40 2.70
WAVELENGTH IN MICRONS 0.00
0.20 0.40 0.60 0.80 1.00
TRANSMITTANCE
Fig. 6. Bandpasses of Clementine filters for UV-VIS and NIR cameras superimposed on reflectance spectra of lunar samples (upper: Nosetteet al., 1994) and those of MI-VIS and NIR (lower) with spectral coverage of SP on SELENE and that of SIR on Smart-1 (Basilevskyet al., 2004).
(including 16 pixels for compression) for VIS and MI-NIR. The FOV is 11◦for both MI-VIS and NIR; the swath on the ground will be 19.3 km. The interval between SE-LENE’s adjacent orbits at the equator will be 33 km at a nominal altitude of 100 km. For that reason, the MI adja-cent strip images will not have an extended overlap, and a few changes of SELENE’s orbit plane during the mission period will be required to achieve global coverage using MI nine-band imagery.
The readout method of the MI-VIS detector is frame transfer. A frame transfer correction will be executed on the ground. In contrast, the MI-NIR detector uses an electrical shutter, which prevents ghost images resulting from frame transfer. The A/D rate is 10 bit/12 bit for MI-VIS/NIR. The exposure time is selected by commands from three lev-els: 8.2 ms (long), 4.1 ms (middle), and 2.0 ms (short) for MI-VIS, and 26.4 ms (long), 13.2 ms (middle), and 6.6 ms (short) for MI-NIR. The dark levels of the MI flight model have been set at about 40 DN for MI-VIS and 200–900 DN depending on the row number of the pixels. The saturation levels 1023 DN/4095 DN of MI-VIS/NIR respectively rep-resent solar reflectance intensities of 15%, 30%, and 60% for long, middle, and short exposure times. The MI flight model test revealed a high SNR of greater than 100 at a solar reflectance intensity of 5%. The MI-VIS data will also be
compressed using the DPCM lossless compression method to reduce the data volume. Compression experiments using simulated images demonstrated a possible achievement of less than 80% (Haruyamaet al., in preparation). The MI-NIR data are not compressed onboard because the MI-MI-NIR data rate is about one-tenth that of MI-VIS.
3.3 Spectral Profiler (SP)
The primary purpose of the SP is to provide global and regional mineral/rock type distributions on the Moon by ob-taining accurate spectral characteristics of the surface (Mat-sunagaet al., 2001, 2003). The mineral/rock information will serve as a fundamental database of each geological unit, which will be distinguished by discrete color infor-mation of the surface provided by the MI (see Fig. 7).
The SP is a Cassegrain line spectral profiler. The SP radi-ation unit, LRU (SP), attached on the+Z panel of SELENE, consists of foreoptics and two spectrometers, VIS and NIR. The LRU (SP) is thermally controlled within 20±5◦C with thermostats to achieve high spectral and radiometric stabil-ity. The LRU (SP) is roughly 42 cm×20 cm×25 cm; its total weight is about 10 kg (see Fig. 2).
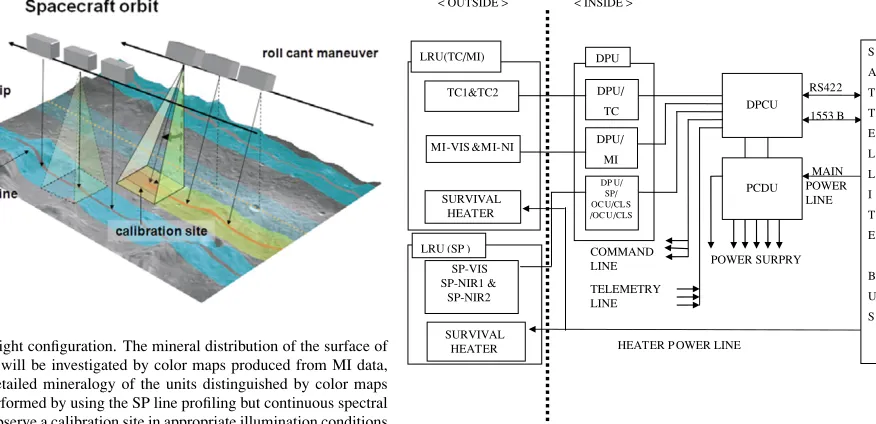
cover-Fig. 7. SP flight configuration. The mineral distribution of the surface of the Moon will be investigated by color maps produced from MI data, and the detailed mineralogy of the units distinguished by color maps will be performed by using the SP line profiling but continuous spectral data. To observe a calibration site in appropriate illumination conditions at least a few times in the SELENE nominal mission period, roll-cant maneuvers will be carried out. An area near the Apollo 16 landing sites is a candidate of calibration site.
ing 490–980 nm, avoiding secondary diffracted light. The light is split by a dichroic mirror into NIR1 and NIR2 detec-tors inside the SP-NIR spectrometer. Both detecdetec-tors of the SP-NIR spectrometers have the same type 1D (128 pixels) InGaAs sensor of 50×200μm pixels. The band-pass filters cover 900–1700 nm for SP-NIR1 and 1700–2600 nm for SP-NIR2. The SP-NIR2 detector is cooled using a three-stage Peltier cooler to 243 K to reduce thermal noise during operation. The spectral resolutions are 6 nm for SP-VIS and 8 nm for SP-NIR1 and NIR2. There are 84 bands for SP-VIS, 100 for NIR1, and 112 for NIR2. The wavelength coverage of the SP is wider than that of SIR on Smart-1 (see Fig. 6).
The SP will have a field of view (FOV) of 0.23◦, or 400 m cross-track pixel resolution on the ground, at a 100 km nom-inal altitude. The along-track sampling interval is 90 ms, corresponding to 562 m on the lunar surface. Four 90 ms data are integrated in the nominal resolution mode, packed, and transmitted to SELENE’s data handling system. The 90 ms data are processed without integration in the high-resolution mode. The analog-to-digital (A/D) conversion rate of the SP is 16 bit. The exposure time for SP-VIS and NIR1 will be selected from two levels: 77 ms (long) and 26 ms (short). The exposure time for SP-NIR2 is 4 ms. The saturation levels (216 DN) of the SP are solar reflectance intensities of nearly 60%, and 20% for long and short expo-sure times. The SP flight model test yielded a good SNR of more than 1000 at 550–700 nm and 1300–1500 nm, more than 2300 at 810–860 nm and 990–1050 nm, and more than 500 at 1050–1250 nm at a solar reflectance intensity of 6% for SP-VIS and NIR1. The SNR of SP-NIR2 was more than 300. The SP has an onboard calibrator module that con-sists of a lighting module attached on the LRU (SP) foreop-tics and two light source (halogen lamp) modules for radi-ance and wavelength calibration in the data processing unit (DPU) (SP) installed in the SELENE bus component. The two modules are connected by optical fibers.
SURVIVAL
HEATER P OWER LINE
MAIN
Fig. 8. Block diagram of the LISM.
3.4 LISM block diagram
Figure 8 presents a block diagram of LISM, which con-sists of five separate units: the LISM radiometer unit of TC and MI (LRU TC/MI), LISM radiometer unit of SP (LRU SP), DPU, data processing and control unit (DPCU), and the power control and distribution unit (PCDU). The LRU (TC/MI) and LRU (SP) are attached on the+Z plane of the SELENE bus (see Fig. 2).
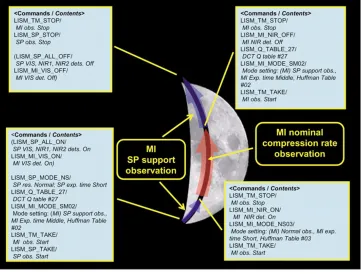
per-Fig. 9. Schematics of a typical revolution observation by MI: MI lower latitude observation. In this revolution, MI observes with compressing MI-VIS and NIR data by loss less DPCM method in the lower latitude and executes the SP support observation with highly compressing the MI VIS one band (usually 750 nm band) data in the middle and higher latitude. SP will observe through the daytime. At changes of observation type, the LISM once stops the data acquisition and change the operational detectors and reset the modes for the exposure time, and compression tables. Detectors of MI and SP will “not” be off even in the night side to maintain stable conditions.
forms command processing, telemetry data acquisition, and all instrument controls.
The SELENE bus voltage will vary from 50.9 to 52.8 V in the sunshine and from 32.6 to 51.2 V in the shade. The PCDU in LISM is a DC/DC power converter to supply stable voltage to the LISM internal units. The temperatures of the TC/MI telescopes and SP spectrometers are adjusted automatically to 20◦C±5◦C by a thermal-controlled heater depending on the temperature when the LISM main power is on. The thermal control unit does not function when the LISM main power is off. Instead, the survival heaters are independently controlled by the spacecraft bus system operating to maintain the instrument temperature as higher than−30◦C.
4.
LISM Operation Plan
4.1 Nominal operation
To store data, SELENE has a mission data recorder with 100 Gbit memory. The data transmit rate from SELENE to the Usuda Deep Space Center (UDSC) in Japan is 10 Mps. Such large resources for data recording and transmission have not previously been allotted for Japanese deep space science missions. However, the data volume will exceed 1 Tbit/day when TC and MI operate simultaneously in the daytime without data compression. For that reason, the data volume per day from LISM would be too great to transmit to the UDSC during its operative time of at most 12 h for a Moon orbiter. The LISM data volume was set to 50 Gbit/day after considering the total data acquisition rates of other mission instruments and bus systems. We
have discussed methods to reduce the daily data volume for LISM and concluded that the following operational re-straints should be imposed.
1) TC and MI will not operate simultaneously. 2) TC/MI will compress data on board.
3) TC/MI will acquire images within a scheduled latitude range.
two TC high-contrast images, one stereo-pair image, and a set of MI 9-band images by the end of the mission. The SP will acquire data throughout the daytime without data compression. The east-west interval of SP strip data will be only 3–4 km at the equator by the end of the mission, and shorter at higher latitudes.
4.2 Orbit plane change operation
Although the SELENE orbit interval between sequential revolutions will be about 100 km at the equator, the MI swath width is less than 20 km, which is too narrow to have any overlap in sequential orbits at lower latitudes. There-fore, SELENE will change its orbital plane three times to achieve seamless MI global mapping in the nominal mis-sion period: once for middle latitude observations and twice for lower latitude observations. Our proposal for the SE-LENE orbiter to execute necessary orbital plane change op-erations during the nominal mission period has been dis-cussed and approved by the SELENE project.
4.3 Calibration operation
Raw TC, MI, and SP data contain dark-level outputs that were set in the flight model development phase. The dark levels are varied with dark currents depending on tempera-ture and radiation damage conditions. We acquired dark-level data and its dependence on temperature in the pre-launch test phase to remove the dark level and to derive the net values for reflected light from the lunar surface. How-ever, the dark levels and their dependence on temperature might be changed because of radiation damage or other fac-tors. Therefore, we will regularly acquire dark-level data to carry out night-side operations. It will be activated for SP before the terminator passes from the night side to the day side, and will be deactivated after the terminator passes from the day side to the night side to collect dark level data. The straight imaging operations of the SP might increase the data volume for MI and TC, which will not be allowed. We will execute an independent operation sequence to ac-quire dark-level data in the night side at least once per rev-olution for MI and several times a week for TC.
We collected pre-flight calibration data using well-calibrated integrating spheres to calibrate the radiance. However, calibration coefficients might change for various reasons, such as structural transformation, contamination, or radiation damage during the launch and in the space en-vironment. For that reason, in-flight radiometric calibra-tions, particularly for MI and SP, are necessary to acquire the corrected calibration coefficients. The lunar surface is a good calibration site because it has no atmosphere and no ocean or plants that might drastically change the spectral reflectance. Some areas on the Moon that were found to be homogeneous and substantial in ground-based observa-tions or previous lunar exploraobserva-tions have been proposed as sites. Mare Serenitatis and the Apollo 16 landing site (6◦S, 15.5◦E) are particularly regarded as appropriate reference sites because the mineral abundances in those areas have been estimated using returned samples. We have chosen a large area (about 8 km in the east-west direction) near the Apollo 16 landing site as the reference site. Both SP and MI will likely miss observations of the reference site if we do not execute any intentional pointing operations; there-fore, SELENE will change its attitude around a role axis
using the momentum wheel so that MI and SP can observe the site three times during the one-year mission period (see Fig. 7).
The SP will also calibrate the data using onboard wave-length/radiance calibration lamps. The calibration lamp op-eration will be executed several times a week.
4.4 Extra observations
The lunar surface exhibits various features: dark or bright and flat, uneven, or steep. Consequently, it might be diffi-cult to acquire data for entire areas with one set of operation modes of the exposure time (for TC, MI, and SP), com-pression table (for TC), and resolution (for SP). Therefore, we plan to execute extra observations for important and in-teresting areas with a set of appropriate observation modes when the allowed observable data volumes are increased. The candidates for extra observation target areas will be listed before the SELENE launch. The lists of candidates for extra observation will be updated at monthly LISM sci-ence team meetings by referring to past observation results and the future operation plans of the SELENE orbiter and other mission instruments.
5.
Conclusion and Discussion
SELENE Level-
Digital Terrain Model (DTM) production system
Mission Data in X-band (10 Mbps)
Fig. 10. The LISM mission data flow among the SELENE, Usuda Deep Space Center, SELENE Operation and Analysis Center, and the Co-Is in their institutes. The LISM data processing systems in the SOAC consists of three sub-systems: the Level 2A processing system, the radiometric calibration and geometric correction system, and the digital terrain models (DTM) production system. The LISM products will be public via Level 2 database one year after the end of the nominal mission period.
provide two high-contrast images, stereo pair images, nine-band color images, and a spectral strip of 4 km or shorter in the east-west interval. Furthermore, LISM will provide a fundamental dataset to advance lunar sciences and investi-gations of future human activities on the Moon.
The LISM flight model has been fabricated and tested to yield satisfactory performance. The final steps of prepara-tion prior to the SELENE/LISM launch are to complete de-velopment of 1) operation support systems for busy weekly operational command planning and 2) ground-processing systems. The command timeline will be transferred from the ground station to the SELENE once a week. The LISM command sequence will differ daily to acquire data by ap-propriate observation modes. In addition, the regions that are missed because of operational problems with the space-craft or ground station, lower altitude conditions in high-land observations, unexpectedly excessive or minimal re-flectance conditions, or other factors, must be compen-sated in subsequent opportunities during the mission period. Weekly operation planning would be too complex. There-fore, we are developing an operation support tool to aid the LISM operation team in systematically checking previous acquisition conditions and designing an efficient set of oper-ational commands by verifying the command rules, the data rate by referring to the predicted compression rate and total volume per day, the appropriate exposure mode, and other elements. Three LISM data-processing systems will have been constructed in the SELENE Operation and Analysis Center (SOAC) at the Institute of Space and Astronautical
Science (ISAS). These systems include a Level 2A process-ing system that will produce the LISM raw data and attach necessary information for subsequent procedures, a radio-metric calibration and georadio-metric correction system to pro-duce radiance and reflectance data with corrected geometry used to view the pointing vectors that are first obtained in pre-flight tests and later corrected using in-flight data (some of which will be mosaicked to serve as a source for geolog-ical base maps), and a digital terrain model (DTM) produc-tion system that produces DTMs and ortho image data from the TC stereo pairs (Demuraet al., 2001; Haruyamaet al., 2006b). Figure 10 depicts the LISM mission data flow. The primary LISM products, such as radiometrically calibrated and geometrically corrected radiance data, surface albedo or reflectance maps, and digital terrain models with ortho im-age data, produced using the systems will be stored in the SELENE Level 2 database. The LISM data will be analyzed by more than 20 LISM team members, who will acquire the information via the database and analyze data at their insti-tutes. We plan to begin releasing carefully checked LISM data one year after the end of the nominal mission period, which starts in 2007, or by the beginning of 2010 to con-tribute to lunar and planetary sciences.
References
Basilevsky, A. T., H. U. Keller, A. Nathues, U. Mall, H. Hiesinger, and M. Rosiek, Scientific Objectives and Selection of Targets for the SMART-1 Infrared Spectrometer (SIR),Planet. Space Sci.,52, 14, 1261–1285, 2004.
Butler, B. J., The Migration of Volatiles on the Surfaces of Mercury and the Moon,J. Geophys. Res.,102(E8), 19283–12291, 1997.
Demura, H., N. Hirata, H. Otake, M. Ohtake, A. Sugihara, M. Higa, T. Matsunaga, and J. Haruyama, Data Processing Flow and Products of LISM: Lunar Imager and SpectroMeter,32nd Lunar Planet. Sci. Conf., abst. #11648, 2001.
Feldman, W. C., A. B. Binder, B. L. Barraclough, and R. D. Belian, First results from the Lunar Prospector Spectrometers,29th Lunar Planet. Sci. Conf., abst. #1936, 1998.
Feldman, W. C., D. J. Lawrence, S. Maurice, R. C. Elphic, B. L. Barra-clough, A. B. Binder, and P. G. Lucey, Classifi cation of Lunar Terranes using Neutron and Thorium Gamma-ray Data,30th Lunar Planet. Sci. Conf., abst. #2056, 1999.
Feldman, W. C., S. Maurice, D. J. Lawrence, R. C. Little, S. L. Lawson, O. Gasnault, R. C. Wiens, B. L. Barraclough, R. C. Elphic, T. H. Prettyman, J. T. Steinberg, and A. B. Binder, Evidence for Water Ice Near the Lunar Poles,J. Geophys. Res.,106(E10), 23,231–23,251, 2001.
Giguere, T. A., B. R. Hawke, L. R. Gaddis, D. T. Blewett, J. J. Gillis-Davis, P. G. Lucey, G. A. Smith, P. D. Spudis, and G. J. Taylor, Remote Sensing Studies of the Dionysius Region of the Moon,J. Geophys. Res., 111(E6), doi:10.1029/2005JE002639, 2006.
Hapke, B.,Theory of Reflectance and Emittance Spectroscopy, 262, Cam-bridge Univ. Press, 1993.
Haruyama, J., H. Otake, M. Ohtake, A. Shiraishi, N. Hirata, and T. Matsunaga, LISM (Lunar Imager/SpectroMeter) Mission for SELENE Project,31st Lunar Planet. Sci. Conf., abst. #1317, 2000.
Haruyama, J., H. Otake, and M. Ohtake, LISM Mission for SELENE Project,Proc. 22nd Int. Sym. Tec. Space Sci., 1686–1691, 2001. Haruyama, J., M. Ohtake, N. Hirata, R. Nakamura, and T. Matsunaga,
Ex-pected Performance of Lunar Imager/SpectroMeter on SELENE,34th Lunar Planet. Sci. Conf., abst. #1565, 2003a.
Haruyama, J., M. Ohtake, T. Matsunaga, N. Hirata, and LISM Working Group, Flight Model Performance of SELENE Terrain Camera,Proc. 23rd. Int. Sym. Tec. Space Sci., 1992–1996, 2003b.
Haruyama, J., M. Ohtake, T. Matsunaga, and LISM Working Group, The Detectability of Degradation of Lunar Impact Crater by SELENE Ter-rain Camera,35th Lunar Planet. Sci. Conf., abst. #1496, 2004. Haruyama, J., M. Ohtake, N. Hirata, R. Nakamura, and T. Matsunaga,
Haruyama, J., M. Ohtake, T. Matsunaga, T. Morota, A. Yoshizawa, and LISM Working Group, Planned Digital Terrain Model Products from SELENE Terrain Camera Data,37th Lunar Planet. Sci. Conf., abst. #1132, 2006a.
Haruyama, J., M. Ohtake, T. Matsunaga, and LISM Working Group, Global High-resolution stereo mapping of the Moon with the SELENE Terrain Camera, inAdv. Geosci., 3: Planetary Science, World Scientific Publishing, edited by W.-H. Ip and A. Bhardwaj, pp. 101–108, 2006b. Haruyama, J., T. Matsunaga, T. Morota, C. Honda, M. Torii, Y. Yokota, H.
Kawasaki, M. Ohtake, and LISM Working Group, Pre-Launch Opera-tion Planning of Lunar Imager/Spectrometer (LISM) on SELENE,38th Lunar Planet. Sci. Conf., abst. #1136, 2007.
Head, J. W., Lunar volcanism in space and time,Rev. Geophys. Space Phys.,14, 265–300, 1976.
H¨orz, F., R. A. Grieve, G. D. Heiken, P. D. Spudis, and A. B. Binder, Lunar Surface, Processes, inThe Lunar Sourcebook: A User’s Guide to the Moon, edited by G. D. Heiken, D. Vaniman, and B. M. French, Lunar and Planet. Inst. and Cambridge Univ. Press, pp. 61–120, 1991. Hiesinger, H. and J. M. Head, New Views of Lunar Geosiceces: An
Intro-duction and Overview, in New Views of the Moon,Rev. Min. Gechem., 60, 1–81, 2006.
Hiesinger, H., R. Jaumann, G. Neukum, J. W. Head, and U. Wolf, Ages and Stratigraphy of Mare Basalts on the Lunar Nearside,J. Geophys. Res.,105(E12), 29239–29275, 2000.
Hiesinger, H., J. W. Head, U. Wolf, R. Jaumann, and G. Neukum, Ages and Stratigraphy of Mare B Basalts in Oceanus Procellarum, Mare Nubium, Mare Cognitum, and Mare Insularum,J. Geophys. Res.,108(E7), 5065, doi:10.1029/2002JE001985, 2003.
Iwata, T., N. Namiki, H. Hanada, H. Minamino, T. Takano, N. Kawano, K. Matsumoto, and S. Sasaki, SELENE Small Sub-Satellites for Lunar Gravity Observation,38th Lunar Planet. Sci. Conf., abst. #1557, 2007. Jolliff, B. L., J. J. Gillis, L. A. Haskin, R. L. Korotev, and M. A. Wieczorek,
Major Lunar Crustal Terrains: Surface Expression and Crust-mantle Origins,J. Geophys. Res.,105(E2), 4197–4216, 2001.
Kato, M., Y. Takizawa, and S. Sasaki, Selene Project Team, The SELENE Mission: Present Status and Science Goals,38th Lunar Planet. Sci. Conf., abst. #1211, 2007.
Lawrence, D. J., W. C. Feldman, R. C. Elphic, J. J. Hagerty, S. Mau-rice, G. W. McKinney, and T. H. Prettyman, Improved Modeling of Lunar Prospector Neutron Spectrometer Data: Implications for Hy-drogen Deposits at the Lunar Poles,J. Geophys. Res.,111, E08001, doi:10.1029/2005JE002637, 2006.
Matsunaga, T., M. Ohtake, Y. Makiko, and J. Haruyama, Development of a Visible and Near-infrared Spectrometer for Selenological and Engineer-ing Explorer (SELENE), inHyperspectral Remote Sensing of the Land and Atmosphere, edited by W. L. Smith and Y. Yasuoka, Proc. SPIE, 4151, 32–39, 2001.
Matsunaga, T., M. Ohtake, J. Haruyama, T. Sugihara, and LISM
Work-ing Group, Environmental Test Resutls and Their Implications to the Perfommance of SELENE Spectral Profiler,Proc. 23rd Int. Sym. Tec. Space Sci., 1922–1927, 2003.
Melosh, H. J.,Impact Cratering: A Geological Process, Oxford University Press, 1989.
Namiki, N., H. Hanada, T. Tsubokawa, N. Kawano, M. Ooe, K. Heki, T. Iwata, M. Ogawa, and T. Takano, Selenodetic Experiments of SELENE: Relay Subsatellite, Differential VLBI, and Laser Altimeter,Adv. Space Res.,23, 11, 1817–1820, 1999.
Neukum, G., B. A. Ivanov, and W. K. Hartmann, Cratering records in the inner solar system in relation to the lunar reference system,Space Sci. Rev.,96, 55–86, 2001.
Nozette, S. and the Clementine team, The Clementine Mission to the Moon: Scientific Overview,Science,266, 1835–1839, 1994.
Nyquist, L. E. and C.-Y. Shih, The isotopic record of lunar volcanism,
Geochim. Cosmochim. Acta,56, 2213–2234, 1992.
Ohtake, M., J. Haruyama, and T. Matsunaga, Scientific Goals and Perfor-mance of Multiband Imager for the SELENE mission,Proc. 23rd Int. Sym. Tec. Space Sci., 1997–2000, 2003.
Ohtake, M., J. Haruyama, T. Matsunaga, T. Morota, Y. Yokota, C. Honda, A. Yamamoto, T. Arai, and H. Takeda, Objectives of the SELENE Multiband Imager and Spectral Study of Dho489,38th Lunar Planet. Sci. Conf., abst. #1829, 2007.
Pieters, C. M., Compositional diversity and stratigraphy of the lunar crust derived from reflectance spectroscopy, inRemote Geochemical Analysis Elemental and Mineralogical Composition, edited by C. M. Pieters and P. A. J. Englert, Cambridge University Press, Cambridge, pp. 309–339, 1993.
Pieters, C. M., L. Gaddis, B. Jolliff, and M. Duke, Rock Types of South Pole-Aitken Basin and Extent of Basaltic Volcanism,J. Geophys. Res., 106(E11), 28001–28022, 2001.
Sasaki, S., Y. Iijima, K. Tanaka, M. Kato, M. Hashimoto, H. Mizutani, and Y. Takizawa, The SELENE mission: Goals and status,Adv. Space Res., 31(11), 2335–2340, 2003.
Starukhina, L. V., Polar Regions of the Moon as a Potential Repository of Solar-Wind-Implanted Gases,Adv. Space Res.,37(1), 50–58, 2006. Starukhina, L. V. and Y. G. Shkuratov, The lunar poles: water ice or
chemically trapped hydrogen,Icarus,147, 585–587, 2000.
Tompkins, S. and C. M. Pieters, Mineralogy of the Lunar Crust: Results from Clementine,Meteorit. Planet. Sci.,34(1), 25–41, 1999.
Wilhelms, D. E., The Geologic History of the Moon,U.S. Geol. Surv. Prof. Pap.,1348, 302 pp, 1987.