ground-motion simulation of multi-segment rupture
during 1891 Nobi earthquake
Masayuki Kuriyama1and Tomotaka Iwata2
1Civil Engineering Research Laboratory, Central Research Institute of Electric Power Industry, 1646, Abiko, Abiko-shi, Chiba 270-1194, Japan
2Disaster Prevention Research Institute, Kyoto University, Gokasho, Uji-shi, Kyoto 611-0011, Japan
(Received December 10, 2009; Revised September 23, 2010; Accepted December 13, 2010; Online published February 28, 2011)
We examine the construction methodology of a source model for strong ground-motion prediction of scenario earthquakes with a long active-fault zone including a multi-segment rupture case. For the multi-segment rupture event, different seismic moments are given by applying two different source-model construction methodologies: (1) a methodology based on seismological scaling relationships and (2) a methodology in an active-fault study based on the cascade model (Working Group on California Earthquake Probabilities, 1995). The difference between these methodologies is whether or not a slip of each segment depends on total rupture length. We investigate which construction methodology is more appropriate for the construction of the source model. We use the two methodologies to construct characterized source models for strong ground-motion simulations of the 1891 Nobi earthquake, which was a multi-segment rupture event occurring in the Nobi active-fault system. We evaluate the constructed source models by comparing the seismic intensities obtained from simulated waveforms with those estimated from the questionnaire-based intensities determined by Muramatu and Kominami (1992). The characterized source model constrained by seismological scaling relationships can give a more adequate distribution of the estimated seismic intensities. We also suggest that the Gifu-Ichinomiya fault might be considered as a source fault to explain the damage distribution on the Nobi Plain.
Key words: Multi-segment rupture event, source-model construction methodology, seismological scaling rela-tionship, cascade model, 1891 Nobi earthquake.
1.
Introduction
One of the most important issues in applied seismology is the establishment of a methodology for strong ground-motion prediction. The construction of a source model that can treat a variety of earthquake scenarios is the key for achieving reliable strong ground-motion prediction. A characterized source model (Irikura and Miyake, 2001) has recently been used as a source model for strong ground-motion prediction for scenario earthquakes (e.g., Iwata and Miyake, 2004; the Headquarters for Earthquake Research Promotion, 2005). Irikura and Miyake (2001) suggested a methodology for constructing the characterized source model based on the empirical relationships of the total rup-ture area and the combined asperity area with the seismic moment.
To develop a methodology for the construction of the characterized source model, it is essential to simulate the strong ground motion of actual earthquakes using such a model and to compare the results with the observation records. For example, the Headquarters for Earthquake Research Promotion (HERP) (2002, 2008a) has been
con-Copyright cThe Society of Geomagnetism and Earth, Planetary and Space Sci-ences (SGEPSS); The Seismological Society of Japan; The Volcanological Society of Japan; The Geodetic Society of Japan; The Japanese Society for Planetary Sci-ences; TERRAPUB.
doi:10.5047/eps.2010.12.005
tinuously validating methods by comparing observed and synthetic strong ground motions and seismic intensities for, e.g., the 2000 Western Tottori Prefecture earthquake (MJ7.3) and the 2005 West Off Fukuoka Prefecture
earth-quake (MJ7.0). However, the source-fault lengths of those
events are short and a validation of a multi-segment rupture event in a long active-fault zone has not yet been carried out.
For multi-segment ruptures, researchers have discussed whether or not the repetition of the same dislocation rup-ture characterizes each of the segments of a long active-fault zone (e.g., Sieh, 1996; McGill and Rubin, 1999; Kaneda and Okada, 2008). The repetition of the same dislocation rupture for each segment is not considered in existing con-struction methodologies for the characterized source model for strong ground-motion prediction, such as the methodol-ogy developed by HERP (2008b). However, several active-fault studies have supported the concept of repetition of a similar slip along a segment (e.g., Siehet al., 1996; Kondo et al., 2005). Therefore, in the construction methodol-ogy we need to consider the behavior of each segment in-volved in a multi-segment rupture. Here, we consider be-havioral segments that are bounded by changes in the slip rates, recurrence intervals, elapsed times, sense of displace-ment, creeping versus locked behavior, and fault complexity (McCalpin, 1996).
For the 1891 Nobi earthquake (M8.0) in Japan, the re-sults of field investigations (e.g., Matsuda, 1974) and pale-oseismological studies (e.g., Awataet al., 1999; Yoshiokaet al., 2001) indicated that three behavioral segments ruptured along the Nukumi fault, the Neodani fault, and the Umehara fault. This means that the 1891 Nobi earthquake was a multi-segment rupture event. Although all the waveform records in the source region were clipped, seismic intensi-ties based on the responses to a questionnaire survey are available at more than 1000 sites for estimating the strong ground-motion distribution.
In this study, we consider alternative construction methodologies for the characterized source model based on scaling from the entire rupture length and from behavioral segment lengths. We give multiple characterized source models for the 1891 Nobi earthquake as an example of a multi-segment rupture event. We compare the estimated seismic intensities from ground motions simulated by the characterized source models and those estimated from the questionnaire-based intensities determined by Muramatu and Kominami (1992). We also discuss the preferred con-struction methodology for the characterized source model for strong ground-motion prediction in a multi-segment rupture event.
Researchers have discussed the rupture of the Gifu-Ichinomiya fault, which did not show clear evidence on sur-face faulting, in the 1891 Nobi earthquake (e.g., Muramatu, 1963; Mikumo and Ando, 1976; Aichi Prefecture, 1998, 2000; HERP, 2001; Fukuyamaet al., 2007; Nakanoet al., 2007). Based on the results of the strong ground-motion simulations, we also evaluate whether predictions using synthesis have the resolution to say whether or not the Gifu-Ichinomiya fault ruptured during the 1891 earthquake.
2.
Previous Studies of the 1891 Nobi Earthquake
The Nobi earthquake, one of the greatest inland crustal earthquakes in Japan in recent times, occurred on October 28, 1891. It generated surface earthquake faulting along the active faults known as the Nukumi fault, the Neodani fault, and the Umehara fault (Fig. 1). Matsuda (1974) compiled field investigation reports (e.g., Koto, 1893; Omori, 1894; Bessho, 1967) and investigated traces of the surface earth-quake faults and the distribution of displacements along these faults.Trench studies have been done at the Nukumi (Yoshioka et al., 2001), Neodani (Miyakoshiet al., 1988; Kumamoto et al., 1992; Sato et al., 1992; Awata et al., 1999), and Umehara (Okadaet al., 1992; Awataet al., 1999) faults to find the timings of paleofaulting and the recurrence in-terval of each fault. Awata et al. (1999) revealed that the Neodani fault has an average recurrence interval of 2,700 years whereas that of the Umehara fault is more than 11,000 years. Given the difference in the estimated aver-age recurrence intervals, they concluded that the Neodani and Umehara faults are each a single behavioral segment. Yoshiokaet al.(2001) excavated a trench in the Nukumi area and dated four recent faulting events of the Nukumi fault. By comparing the dates of faulting events on the Nukumi fault and the dates revealed by Awataet al.(1999) of faulting events on the Neodani fault, they showed that the
Fig. 1. Location of Nukumi, Neodani, Umehara, and Gifu-Ichinomiya segments assumed in this study (solid black line). Thin solid lines show location of active faults (Research Group for Active Faults of Japan, 1991). The three large stars indicate assumed rupture starting points. Epicenters (small stars) and focal mechanisms of small earthquakes are also shown.
two faults have not always ruptured simultaneously. Ac-cording to the results of these paleoseismological studies, we can regard each of the Nukumi, Neodani, and Umehara faults as single behavioral segments. Therefore, the 1891 Nobi earthquake is considered to be a multi-segment rup-ture with at least three behavioral segments.
Kaneda and Okada (2008) performed detailed tectonic geomorphological mapping along the Neodani fault to test the behavioral model for a fault involved in a multi-segment rupture. They showed that the distributions of the left-lateral and vertical slip rates based on the estimated ages of terrace abandonment and the cumulative displacements of geomorphic markers mimic in shape those of left-lateral and vertical slips during the 1891 Nobi earthquake. They also indicated that the cumulative displacement since the L1 abandonment at 17–20 ka is only three times the dis-placement of the 1891 event. This means that the recur-rence interval from their slip-rate analysis is longer than that revealed by trench study at the Neodani fault. They con-cluded that if the recurrence interval revealed by Awataet al.(1999) for the Neodani fault is correct, this fault should not be characterized by repetition of the same slip-function earthquake ruptures or the characteristic slip-function be-havior. However, they also noted that characteristic spatial slip-function behavior may still be expected if some of the identified faulting events are minor slip events caused by adjacent faults such as the Ibigawa and Mugigawa faults. In this study, via the validation of our construction methodol-ogy, we discuss whether or not the same slips were repeated on each behavioral segment.
verti-Ichinomiya fault were needed to explain the observation. Nakano et al.(2007) determined the location and geome-try of the Gifu-Ichinomiya fault by a grid-search method based on an inversion of the coseismic vertical displace-ments obtained by leveling surveys. They showed that the Gifu-Ichinomiya fault is located 5 km east of the loca-tion assumed in the model of Mikumo and Ando (1976). Fukuyama et al.(2007) evaluated the seismic moment of the 1891 earthquake by comparing calculated synthetic seismograms from a point source and finite source mod-els with the historical seismogram recorded at the Central Meteorological Observatory in Tokyo. They showed that a comparison between the observed and synthetic seismo-grams appears to favor the existence of a buried fault along the Gifu-Ichinomiya line. In contrast to these results, the Aichi Prefecture (1998, 2000) and HERP (2001) used strati-graphic and seismic reflection surveys to rule out the pos-sibility of the existence of the Gifu-Ichinomiya fault. We use the intensities estimated by Muramatu and Kominami (1992) to investigate whether the Gifu-Ichinomiya fault ruptured during the 1891 Nobi earthquake.
3.
Characterized Source Model for Strong-motion
Prediction
In the last section, we introduced the surface source fault and the distribution of the questionnaire-based seismic in-tensity of the Nobi earthquake for evaluating source mod-els. We need to see how much it is possible to constrain the source model from the seismic intensity distribution. Kanda and Takemura (2005) developed source inversion us-ing seismic intensity data. They estimated the empirical at-tenuation relation of the seismic intensity from recent earth-quake data and applied it to the seismic intensity distribu-tion of historical events by assuming that the finite source model consists of distributed point sources. They obtained spatial heterogeneity of source on the fault. Although their method gave information on the heterogeneity of the seis-mic wave radiation, our aim is to discuss the construction methodology of a seismic source model for multi-segment rupture events. Therefore, our approach is to construct a set of source models for ground-motion simulation, to estimate the ground motions according to those models, and to com-pare the observed and simulated seismic intensities in order to select the most appropriate model.
The characterized source model is one of the most reli-able approaches for broadband strong ground-motion pre-diction. This model was proposed by Irikura and Miyake (2001). They first introduced a methodology for the source model construction. HERP applied this technique to explain the observations of recent disastrous earthquake events and confirmed the applicability and limitations of the method. Irikuraet al.(2002) improved the method, and HERP sum-marized the methodology together with evaluation methods for the ground-motion simulation. This is now known as Irikura’s recipe. The procedure and parameter settings are
tions for the Nobi earthquake at the strong motion recording sites, and estimate the seismic intensities from the simula-tion results.
4.
Strong Ground-motion Simulation
4.1 Construction of characterized source models
We construct characterized source models for strong ground-motion prediction using the procedure of HERP (2008b) and Irikura and Miyake (2010). Due to uncer-tainties that will be discussed, we eventually construct 24 models, listed in Table 1. We assume a multi-segment rup-ture of the northwestern part of the Nukumi fault (Nukumi segment), the Neodani fault (Neodani segment), and the Umehara fault (Umehara segment), along which surface earthquake faults appear (Fig. 1). We also consider a multi-segment rupture including the Gifu-Ichinomiya fault (Gifu-Ichinomiya segment). These four segments are assumed to be left-lateral strike-slip faults with a rake of 0 degrees. We obtain the location and rupture length of each segment from the traces of surface earthquake faults investigated by Matsuda (1974), except for the Gifu-Ichinomiya segment. Table 2 lists the lengths assumed here for each segment.
The Research Group for Active Faults of Japan (1991) es-timated the location and length of the Gifu-Ichinomiya fault based on the boundary between tectonic uplift and subsi-dence. Sugisaki and Shibata (1961) suggested the existence of the Gifu-Ichinomiya fault from the vertical offset of a pumice bed of 5 m in the borehole records at Ichinomiya city. Fukuwaet al.(2003) estimated the locations of struc-tural boundaries of the Nobi plain using the vertical gradi-ent distribution of gravity anomaly. From their results, it seems that a structural boundary exists near the location of the Gifu-Ichinomiya fault shown by the Research Group for Active Faults of Japan (1991). Therefore, we use the loca-tion and length of the Gifu-Ichinomiya fault from the Re-search Group for Active Faults of Japan (1991). In Table 2, the length of the Gifu-Ichinomiya fault is listed.
We assume the width of each fault from the lower cut-off depth of microseismic activities, the depth of the up-per limit of the fault plane, and the dip angle assumed for each fault. We assume that the depth of the lower limit of the fault plane of each fault is same as the bottom depth of the seismogenic zone. By referring to Ito (1999), we deter-mine the bottom depth of the zone from the distribution of the hypocenters of the small earthquakes that occurred from 1926 to 2006 around the Nobi fault zone. These hypocen-ters were determined by the Japan Meteorological Agency (JMA).
mod-Table 1. 24 characterized source models.
10 segment-L model CASE1 67.7
11 Method2 CASE2 67.3
12 CASE3 66.8
13 CASE1 45.4 Fig. 10(b)
14 Method1 CASE2 44.4
15 CASE3 46.0
16 total-L model CASE1 27.2 Fig. 8, Fig. 10(a)the most proper
17 Method2 CASE2 27.7
18 4 CASE3 29.5
19 CASE1 57.8
20 Method1 CASE2 59.1
21 CASE3 62.6
22 segment-L model CASE1 67.0 Fig. 10(c)
23 Method2 CASE2 67.3
24 CASE3 71.2
Table 2. Fault parameters for each segment.
Nukumi Neodani Umehara Gifu-Ichinomiya
Strike (degree) 137 146 116 158
Dip (degree) 90 90 90 90
Rake (degree) 0 0 0 0
Rupture length (km) 16.7 29.8 27.8 31.6
Rupture width (km) 12.0 15.0 16.0 10.0
Rupture area (km2) 200 447 445 316
els give a finite source model in which the fault plane reach the ground surface, e.g., Horikawaet al.(1996) for the 1995 Hyogo-ken Nanbu earthquake along the Nojima fault, and Wald and Heaton (1994) for the 1992 Landers earthquake. Their source models show slips in the shallower part of the fault plane at the surface earthquake faults. Since during the Nobi earthquake surface earthquake faults were generated along the Nukumi, Neodani, and Umehara faults, we as-sume that the depths of the upper limits of the fault planes are 0 km. We also assume that all stations at the ground surface have a depth of 0 km. Because no surface earth-quake fault was generated along the Gifu-Ichinomiya fault, we assume that the depth of the upper limit of the Gifu-Ichinomiya segment is equal to the top depth of the seismo-genic zone. The dip angles of all segments are assumed to be 90 degrees. The width of each fault is listed in Table 2.
We obtain two types of total seismic moments using two different methods (Fig. 2). In the first method which we call the total-L model (t-L model), we obtain the total seismic moment from the total rupture area by applying the em-pirical relationship given in Eq. (A.1). The total seismic moment is divided into the seismic moment for each seg-ment under the condition that the static stress drops, which are obtained by applying the formula for a circular fault of Eshelby (1957), are the same among all segments. In this method, the average slip of each segment depends on the combination and number of segments that rupture simul-taneously because for fixed width the seismic moment in-creases faster than the fault length.
Fig. 2. Two different models used for obtaining total seismic moment. In total-L model, the average slip of each segment depends on the combination and number of ruptured segments. In segment-L model, the average slip of each segment is constant for any combination and number.
the empirical relationship in Eqs. (A.1) and (A.2). Here, we assume that this relationship between seismic moment and rupture area is satisfied for each behavioral segment. In this method, the average slip of each segment is constant for any combination and number of segments that rupture simul-taneously. The total seismic moment is obtained by sum-ming the seismic moments for each segment. This approach is based on the cascade model proposed by the Working Group on California Earthquake Probabilities (1995). The cascade model indicates that a behavioral segment ruptures independently or along with other contiguous segments and assumes that repetition of the same slip at given point char-acterizes the behavioral segment. The average slip of each segment increases as the rupture length increases when the downdip width of the fault reaches saturation because of the finite thickness of the brittle zone.
Applying the first method gives a total seismic moment of 6.64E+19 N m (Mw7.2) for a three-segment rupture
and 1.10E+20 N m (Mw7.3) for a four-segment rupture.
Applying the second method gives a total seismic moment of 2.48E+19 N m (Mw6.9) for a three-segment rupture
and 3.04E+19 N m (Mw6.9) for a four-segment rupture
(Fig. 3).
Next, we set up the combined asperity area using two dif-ferent methods. In the first method (method 1), short-period spectral level of acceleration source spectrum, which is ob-tained from a seismic moment by applying the empirical relationship in Eq. (A.3), is used to estimate the equivalent radius of asperity. We apply the short-period spectral level of the acceleration source spectrum for causative faults to estimate the equivalent asperity radius in the total-L model. In the segment-L model, we assume the short-period spec-tral level of the acceleration source spectrum for each ment to estimate the equivalent asperity radius for that seg-ment. In the other method (method 2), we use the relation-ship that for inland crustal earthquakes the combined asper-ity area is specified to be about 22% of the total rupture area (Somervilleet al., 1999).
Table 3 lists the four models obtained by combining the two methods for obtaining the total seismic moment and the two methods for estimating the combined asperity area. In the t-L and t-L 22 models, we calculate the stress drop on asperity by applying Eq. (A.5) to the equivalent radius of the combined asperity area with R being the equivalent
Fig. 3. Empirical relationship between seismic moment and total rupture area.
radius of the source fault area. In the s-L and s-L 22 models, we apply Eq. (A.5) to the equivalent radius of the asperity of each segment, withRbeing the equivalent radius of the corresponding fault area. The stress drop on asperity in each model is listed in Table 4. We also estimate the effective stress on the background area of each segment using the method of HERP (2008b).
Table 3. Four models obtained by combining two methods for finding total seismic moment and two methods for estimating combined asperity area.
The equivalent radius of asperity is obtained from the short-period level of the acceleration source spectrum by referring to Boatwright (1998) and Danet al.(2001).
total-L model (t-L model)
segment-L model (s-L model)
Combined asperity area is specified to be 22% of the total rupture area of the causative faults (Somervilleet al., 1999).
total-L & 22%
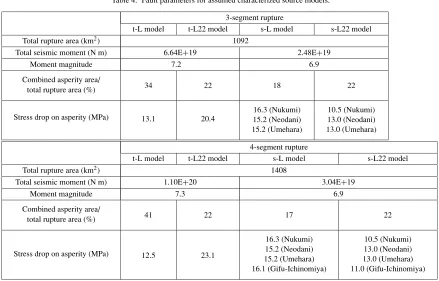
Table 4. Fault parameters for assumed characterized source models. 3-segment rupture
t-L model t-L22 model s-L model s-L22 model
Total rupture area (km2) 1092
Total seismic moment (N m) 6.64E+19 2.48E+19
Moment magnitude 7.2 6.9
Combined asperity area/
total rupture area (%) 34 22 18 22
Stress drop on asperity (MPa) 13.1 20.4
16.3 (Nukumi)
t-L model t-L22 model s-L model s-L22 model
Total rupture area (km2) 1408
Total seismic moment (N m) 1.10E+20 3.04E+19
Moment magnitude 7.3 6.9
Combined asperity area/
total rupture area (%) 41 22 17 22
Stress drop on asperity (MPa) 12.5 23.1
16.3 (Nukumi)
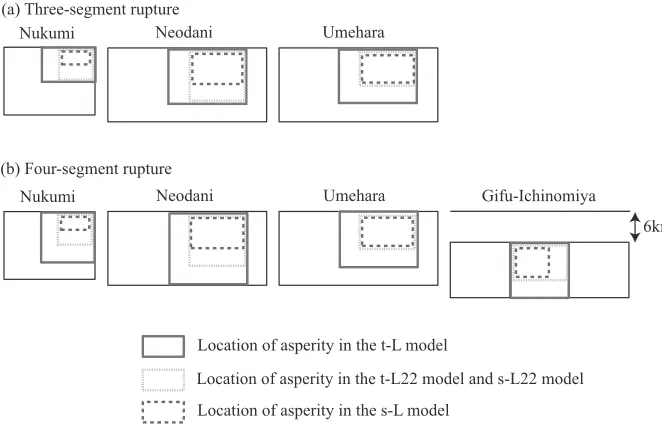
the seismic fault plane. Iwakiet al.(2006) identified the asperities on the fault plane for fourteen earthquakes and examined the spatial relationship between surface earth-quake faults and subjacent source faults. They showed that locations where the surface displacements are large corre-spond in many cases to the locations of asperities on source faults. We assume that the asperities are located where larger dislocations are observed by referring to the distri-bution (Matsuda, 1974) of the left-lateral displacements.
We assume three rupture starting points (CASEs). The starting points of CASE1, CASE2, and CASE3 are located at the northwestern end of the Nukumi segment, the south-eastern end of the Nukumi segment, and the middle section of the Neodani fault, respectively (Fig. 1). The locations for CASE1 and CASE3 are chosen by referring to Nakata et al.(1998) who gave a relation between the branching ge-ometry of active faults and the location of a rupture starting point. The location for CASE2 is determined by referring to Muramatuet al.(2002) who suggested that the rupture
as-Fig. 4. Assumed characterized source models for 1891 Nobi earthquake. (a) Assumed characterized source models when three segments rupture (excluding Gifu-Ichinomiya fault). (b) Assumed characterized source models when four segments rupture (including Gifu-Ichinomiya fault). Rectangles show the location of asperity in each characterized source model.
perity area, three types of rupture starting points, and two cases of the multi-segment ruptures that includes or omits the Gifu-Ichinomiya segment (Fig. 4).
4.2 Synthesis of strong ground motions
We simulate strong ground motion using the EGF method proposed by Irikura (1986). This method has been used to simulate strong ground motions during inland crustal earthquakes such as the 1995 Hyogo-ken Nanbu earthquake (e.g., Kamae and Irikura, 1998) and the 2000 Tottori-ken Seibu earthquake (e.g., Ikedaet al., 2002). They used the recorded waveforms of aftershocks as the EGF to simulate the strong ground motions during the mainshock. In this study, we use the recorded waveforms of two small earth-quakes that occurred around the Nobi fault zone to take into account the different propagation path from each segment to the strong motion stations (Fig. 1). We use the focal mech-anism solutions of these small earthquakes determined by F-net (Fukuyama et al., 1998). Event 1 is an earthquake of Mw4.4 (M0 = 4.86E+15 N m) in Fukui prefecture
on October 5, 2004. Event 2 is an earthquake of Mw4.2
(M0 = 2.39E+15 N m) in Gifu prefecture on February
16, 2006. One nodal plane of the small earthquakes is al-most consistent with that of the assumed fault plane. We use the recorded waveforms of Event 1 as the EGF for the Nukumi segment fault and those of Event 2 for the Neodani, Umehara, and Gifu-Ichinomiya segment faults.
We obtain log averages of the source displacement spectra with a hypocentral distance of 1 km using ob-served ground-motion records at four strong motion sta-tions (FKIH01, FKIH04, GIFH09, GIFH22) that surround the hypocenters of the small earthquakes (Fig. 5), correct-ing propagation-path effect byQvalue of Satohet al.(1994) and hypocentral distance. We determine corner frequencies of 2.0 Hz and 1.9 Hz for Event 1 and Event 2, respectively. We assume that the faults are circular cracks and estimate the radiusrcby referring to Brune (1970, 1971). The area
of the fault for each event is calculated byπr2
c. We assume
that subfaults of the large event are square-shaped so they are equivalent in area to the small-event fault. We there-fore choose a subfault size of 1.1 km by 1.1 km for the Nukumi fault segment and 1.2 km by 1.2 km for the others. We calculate static stress drops of 8.0 MPa and 3.4 MPa for Event 1 and Event 2 respectively, by referring to Brune (1970, 1971). The rise time of each event is given from the empirical relationship between seismic moment and rise time given by Somervilleet al.(1999).
In order to apply the EGF method, Eq. (1) should be satisfied for the seismic moment of the scenario earthquake (M0) and that of the small event (m0):
M0
m0
=c·NL·NW·NT (1)
On the right-hand side, cis the ratio of the average stress drops,NLis the number of subfaults along the fault length,
NWis the number of subfaults along the fault width, andNT
is the ratio of the rise times of the scenario earthquake and the small earthquake.
In our simulation, NL, NW, and NT are more than 10.
Fig. 5. (Left) Source displacement spectra with hypocentral distance of 1 km obtained from observed ground-motion records at four strong motion stations and log-averaged source displacement spectra among these stations. Source displacement spectra of Event 1 and Event 2, respectively, are shown in (a) and (b). Solid line in the left figure shows the corner frequency. (Right) Distribution map of strong motion stations around hypocenters of Event 1 and Event 2. Solid line in the right figure shows the location of assumed segments. Closed squares indicate the location of strong motion stations at which we calculate source displacement spectra.
those of Events 1 and 2, respectively. As a second step, we synthesize the waveforms of the Nobi earthquake using the simulated waveforms of the virtual middle-size earth-quakes. Equation (1) is satisfied for the seismic moment of asperity area of each segment and that of the small event. It is also satisfied in background slip area of each segment. Parameters for the EGF method are listed in Table 5.
We simulate the acceleration and velocity waveforms of the NS, EW, and UD components at 148 strong motion sta-tions of K-NET (Kinoshita, 1998) and KiK-net (Aoiet al., 2000). We use the recorded waveforms of the small earth-quakes for 30 s from 0.5 s before the directS-wave onset. The frequency band for simulating the acceleration and ve-locity waveforms is 0.5 to 10.0 Hz. A cutoff frequency fmax
of 6 Hz is chosen in this study (e.g., Satoh, 2002).
5.
Questionnaire-based Intensity Distribution of
the 1891 Nobi Earthquake
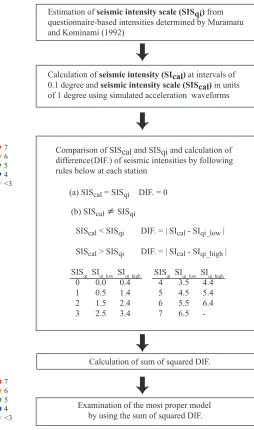
The Tokyo Imperial University conducted a nationwide questionnaire survey about one month after the 1891 Nobi earthquake. Muramatu and Kominami (1992) determined seismic intensities by relating the gathered information to the JMA intensity scales (Fig. 6(a)). They considered the change in the degree of earthquake protection of wooden houses by referring to the relationship between earthquake damage and seismic intensity for the 1923 Kanto earth-quake.
Fig. 6. (a) Distribution of questionnaire-based intensities estimated by Muramatu and Kominami (1992). (b) Distribution of estimated seis-mic intensity scales at strong motion stations from questionnaire-based intensities.
Therefore, we calculate the seismic intensities at the strong motion stations from the questionnaibased intensities re-ported within 5 km. We estimate the seismic intensities in units of 1 degree by applying the inverse distance weighted mean of the questionnaire-based intensities. If there are no questionnaire-based intensities within 5 km of a strong mo-tion stamo-tion, we estimate the seismic intensity by referring to the contour map of the distribution of the questionnaire-based intensities determined by Muramatu and Kominami (1992).
The questionnaire-based intensity is estimated from the plural reports of degree of damages in a community. On the contrary, the obtained seismic intensity at a station shows the ground motion level at that station. This implies that the seismic intensity at the station might not be
representa-Fig. 7. Flowchart of procedure to evaluate assumed characterized source model using seismic intensities obtained from simulated waveforms with those estimated from questionnaire-based intensities.
tive of intensity in the community. In this study, we use the distribution of the questionnaire-based intensities and the estimated seismic intensities in many communities (Fig. 6). We could assume that the distribution of the estimated seis-mic intensities at the strong motion stations has the charac-teristics of that of the questionnaire-based intensities of the 1891 Nobi earthquake. We compare the seismic intensities calculated from the simulated waveforms of the assumed source models with those estimated based on the question-naire. The procedure for choosing the best model is shown in detail in Fig. 7.
6.
Results
The sum of the squared differences of the seismic inten-sities obtained from simulated waveforms and those esti-mated from the questionnaire-based intensities is the small-est in the characterized source model 16.
Fig. 8. (a) Distribution of simulated seismic intensity scales (SIScal) in
best characterized source model. (b) Distribution of differences be-tween simulated seismic intensity scales (SIScal) and estimated
ques-tionnaire-based intensity scales (SISqi) in best characterized source
model. The difference is calculated by SIScal−SISqi.
this model, SIScal values above 6 are simulated at the
K-NET strong motion stations at AIC001 and GIF020 in the heavily damaged region with a wooden-house damage ra-tio from Muramatu (1983) of more than 80%. Strong mo-tion stamo-tions with SIScalvalues above 6 are distributed from
the southwestern part of Gifu prefecture to Aichi prefecture. Figure 8(b) shows the distributions of the differences of the SIScalvalues for model 16 and the estimated
questionnaire-based scale values (SISqi). The SIScal values are mostly
within 1 of the SISqivalues. At the strong motion stations in
the heavily damaged region, the SIScalvalues are consistent
with the SISqivalues.
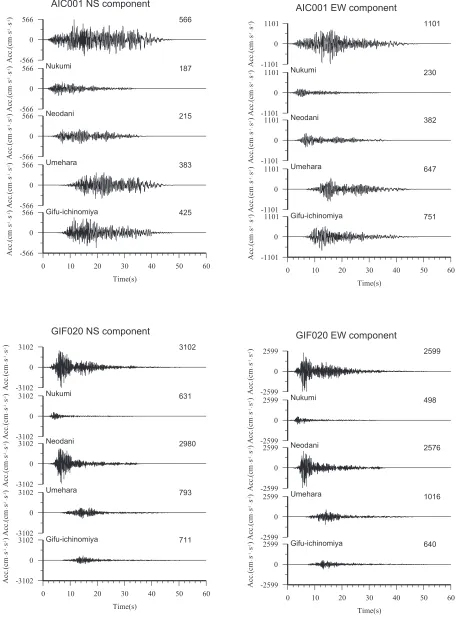
Figure 9 shows the simulated acceleration waveforms of the NS and EW components at the AIC001 and GIF020 stations located in the heavily damaged region. At GIF020,
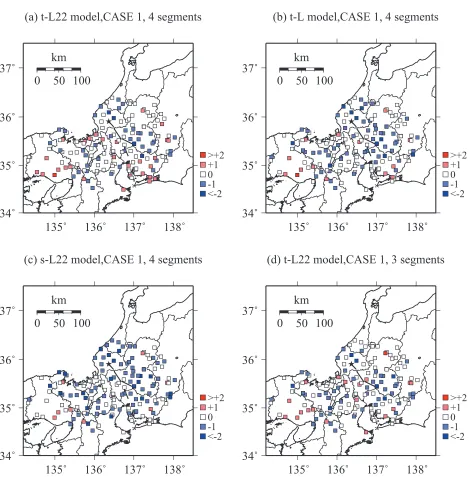
13, 22, and 4. The difference between the best model and the models assumed in Fig. 10(b), (c), and (d) is the method for estimating the combined asperity area, obtaining the to-tal seismic moment, and deciding whether or not the Gifu-Ichinomiya fault ruptured. The sums of the squared differ-ences for the models in Fig. 10(a), (b), (c), and (d) are 27.2, 45.4, 67.0, and 34.1. We observe from Fig. 10(c) that the SIScalvalues are significantly smaller than the SISqivalues
at most strong motion stations. In Fig. 10(d), the SIScal
val-ues are inconsistent with the SISqivalues at the strong
mo-tion stamo-tions in the heavily damaged region. This means that rupturing in the Gifu-Ichinomiya segment might be nec-essary to explain the distribution of the damage caused to wooden houses near the Gifu-Ichinomiya fault.
7.
Discussion
7.1 Comparison of simulated peak horizontal veloc-ities (PHVs) with empirical attenuation relation-ship
We compare the attenuation characteristics of the sim-ulated peak horizontal ground velocities (PHVs) in the source model 16 with the empirical attenuation relation of Kannoet al.(2006). In this comparison, we use the atten-uation relation of PHVs for soil withVs30 of 300 m/s. An
amplification correction toward this value is estimated by applying the Vs30 from the PS logging results of K-NET
and KiK-net to the empirical relationship of Midorikawaet al.(1994). The attenuation characteristics of the PHVs in the best characterized source model are found to approxi-mately follow the empirical attenuation relation, as shown in Fig. 11. However, the PHVs at HYG020, HYGH09, and OSKH02 are larger than expected. These stations are lo-cated in the southwestern area more than 100 km from the causative faults. At these stations, the waveforms radiating from the Neodani and Gifu-Ichinomiya segments signifi-cantly affect the results of the strong ground-motion sim-ulation. We used the recorded waveforms of Event 2 to simulate waveforms from the Neodani and Gifu-Ichinomiya segment faults. The PHVs of the recorded waveforms of Event 2 at HYG020, HYGH09, and OSKH02 are larger than the attenuation relation obtained from PHVs at other stations. It seems that a propagation-path effect causes these larger-than-expected PHVs. Here, we confirmed that the se-lection of the best model is independent of whether these stations are included or not.
7.2 Verification of the source model 16
The characterized source model constrained by the seis-mological scaling relationship is better for expressing the distribution of the estimated seismic intensities. In this model, the total seismic moment is 1.10E+20 N m. From the historical seismograms recorded at the Central Meteorological Observatory in Tokyo, Fukuyama et al. (2007) estimated the total seismic moment of the Nobi earthquake to be 1.83E+20 N m (Mw=7.5). Based on an
Fig. 9. Simulated acceleration waveforms of NS and EW components at AIC001 and GIF020. Values indicate peak accelerations of simulated waveforms.
Nakano et al.(2007) estimated the total seismic moment to be 1.38E+20 N m (Mw = 7.4). These two values are
slightly larger than the total seismic moment of the source model 16.
Fig. 10. Distributions of differences between simulated seismic intensity scales (SIScal) and estimated questionnaire-based intensity scales (SISqi). (a)
t-L22 model case1, rupturing Gifu-Ichinomiya segment, (b) t-L model case1, rupturing Gifu-Ichinomiya segment, (c) s-L22 model case1, rupturing Gifu-Ichinomiya segment, (d) t-L22 model case1, not rupturing Gifu-Ichinomiya segment.
rupture area is satisfied for each behavioral segment in a single-segment rupture, our result may mean that the slip of each segment in a multi-segment rupture is different from that in a single-segment rupture.
Kaneda and Okada (2008) observed that if the earthquake recurrence interval estimated from a previous paleoseismic trench is correct, the tectonic geomorphological observa-tions in the Neodani fault can be explained by repetition of a similarly shaped slip distribution independently of the rupture of adjacent faults, but with a variable amount of slip. Our result appears to be consistent with their result in that it has no repetition of the same dislocation rupture for the Neodani segment.
Wesnousky (2008) examined the average and maximum values of the coseismic slip as a function of the surface rupture length. Wesnousky considered the slopes of the
fitted curves describing the slip increase and found that these slopes decrease as a function of the total rupture length without apparently reaching a plateau in the strike-slip earthquake data. If the relationship between the strike-slip of a behavioral segment and the total rupture length is sim-ilar, the difference of the slip in a single-segment rupture and that in a multi-segment rupture may be small, and sim-ilar displacements may be repeated along the segment with a large rupture length. In the Nobi fault zone, the rupture length of each segment may not be enough to satisfy this relationship.
earth-Fig. 11. Attenuation characteristics of PHVs for soil withVs30 of 300 m/s in best characterized source model.
quakes caused by large strike-slip faults. The first method is based on the scaling law of Irikura and Miyake (2001) and the crack model. In the second method, the effective stress on asperity is 14.1 MPa independent of the earthquake size. Following Madariaga (1979), in the second method the ef-fective stress on asperity of 14.1 MPa is estimated from the average static stress drop (e.g., 3.1 MPa from Fujii and Matsu’ura (2000)) and the ratio of the combined asperity area to the total rupture area. Danet al.(2005) conducted strong ground-motion simulations based on characterized source models with different values for the effective stress on asperity. They compared simulated peak ground ve-locities with the attenuation relation of Si and Midorikawa (1999) and concluded that the effective stress on asperity from the second method is more proper. In this study, the attenuation characteristics of the simulated peak ground ve-locity in the source model 16 are found to approximately follow the empirical attenuation relation. This shows that the calculated stress drop on asperity of the model 16 is preferred for the Nobi earthquake.
The location of the rupture starting point in the model 16 is the northwestern end of the Nukumi segment (CASE1). However, the sum of the squared differences of seismic in-tensity is almost the same for CASE1 and CASE2 (south-eastern end of the Nukumi segment). By comparing syn-thetic seismograms with recorded seismograms at the Gifu and Nagoya stations, Mikumo and Ando (1976) estimated the location of the starting point to be the northwestern end of the Nukumi fault. Muramatuet al.(2002) also estimated the starting point to be the northwestern end of the Nukumi fault based on the time interval reported by Matsuda (1974) of about 10 s to the formation of the surface fault at Seki. Our result is consistent with these previous results.
Our results show that the Gifu-Ichinomiya fault might rupture during the Nobi earthquake. The location of the Gifu-Ichinomiya segment in this study is based on that of the Research Group for Active Faults of Japan (1991). The location is nearer Nagoya City than that used by Mikumo and Ando (1976). We also assume the dip of the
Gifu-Ichinomiya segment to be 90 degrees. Mikumo and Ando (1976) assumed a buried fault with a dip of 90 degrees. Nakanoet al.(2007) estimated a thrust fault with a dip of 60 degrees located 5 km east of the location of Mikumo and Ando (1976). They compared the distribution of seis-mic intensities calculated using their best model with the distribution from Muramatu (1983) of the damage caused to wooden houses by the Nobi earthquake. However, they did not calculate seismic intensities of 7 at Gifu city where the percentage of damaged houses is more than 80%. In the model 16, we simulate a seismic intensity of 7 at Gifu city. The distribution of the strong motion stations showing a seismic intensity above 6 near the Gifu-Ichinomiya fault might be consistent with the distribution from Muramatu (1983) of the damage caused to wooden houses.
8.
Conclusions
We examine the source-model construction methodology for the strong ground-motion prediction of scenario earth-quakes in a long active-fault zone including a multi-segment rupture case. We construct 24 characterized source models of the 1891 Nobi earthquake by combining two methods for obtaining the total seismic moment, two methods for esti-mating the combined asperity area, three types of rupture starting points, and two cases of the multi-segment ruptures that includes or omits the Gifu-Ichinomiya segment. We conduct strong ground-motion simulation for the charac-terized source models using the empirical Green’s function method.
ap-rupture during the 1891 Nobi earthquake.
The attenuation characteristics of the PHVs in the best characterized source model are found to approximately follow the empirical attenuation relation of Kanno et al. (2006). In this model, the total seismic moment is 1.10E+20 N m (Mw7.3). The seismic moments of each
behavioral segment in the best characterized source model are larger than those obtained by applying the empirical re-lationship to the rupture area of each segment. If the empir-ical relationship between seismic moment and rupture area is satisfied for each behavioral segment in a single-segment rupture, our result may imply that the slip of each segment in a multi-segment rupture is different from that in a single-segment rupture.
Acknowledgments. We are grateful to two anonymous review-ers for the critical reviews and suggestions on the original manuscripts. We sincerely thank Prof. Takashi Kumamoto for helpful comments. We used data from the K-NET and KiK-net strong motion networks. We also used the moment tensor solu-tions of two small-sized events from the F-net. We are grateful to the National Research Institute for Earth Science and Disaster Pre-vention (NIED) for providing the K-NET, KiK-net, and F-net. We used hypocentral information provided by Japan Meteorological Agency (JMA). Some figures have been drawn using GMT (Wes-sel and Smith, 1998).
Appendix A. A Procedure for Source Modeling
for Strong Ground-motion
Simula-tion: Brief Introduction of Irikura’s
Recipe
Here, we describe the procedure for source model con-struction referring to Irikura’s recipe (HERP, 2008b; Irikura and Miyake, 2010) for strong ground-motion simulation.
Irikura and Miyake (2001) have proposed a character-ized source model for strong ground-motion prediction. It is based on an asperity model. The source fault consists of the asperity and the remaining area is called the back-ground area. The total rupture area and the asperity area are given by the empirical relationships between total rup-ture area and seismic moment and between combined asper-ity area and seismic moment. Figure A.1 shows the result-ing procedure for constructresult-ing a characterized source model (modified from HERP, 2008b). This model is characterized by outer fault parameters, inner fault parameters, and extra parameters.
The outer fault parameters are the total rupture area, to-tal seismic moment, and average stress drop on the fault. The total seismic moment is found by applying the two-stage scaling relationships between seismic moment and total rupture area. The empirical scaling relationship in Eq. (A.1) is obtained from the seismic moment and the total rupture area in the earthquake catalogs of Wells and Coppersmith (1994). It can be applied when M0 ≥ 7.5×
1018 N m (Irikura and Miyake, 2001). Equation (A.2) is
obtained from the seismic moment and total rupture area of the slip models of 15 inland crustal earthquakes given
M0 = S/2.23×10 ×10 (A.2)
where S is the total rupture area in km2 and M0 is the
seismic moment in N m. In HERP (2008b), for multi-segment ruptures, the total seismic moment is divided into the seismic moment for each segment under the condition that the average static stress drops are constant among all segments. In this method, the seismic moment and the average slip of each segment depend on the combination and number of segments that rupture simultaneously.
The average stress drop on the fault is obtained by ap-plying the formula for a circular fault of Eshelby (1957) in a case ofS ∝ M01/3 and by the formula on the tectonic loading stress (e.g. Fujii and Matsu’ura, 2000) in cases of S ∝ M01/2 orS ∝ M0. HERP (2008b) also describes that
the average stress drop value obtained by the later formula is provisional and the applicability needs to be examined. Here, we apply the formula for a circular fault of Eshelby (1957) to obtain the average stress drop.
The inner fault parameters characterize heterogeneity in-side the fault. These parameters are the combined asperity area, stress drop on asperity, number of asperities, average asperity slip, effective stress on asperity and background area, and slip-velocity time function. In HERP (2008b) and Irikura and Miyake (2010), two methods are suggested to give the combined asperity area. In the first method, a short-period spectral level of the acceleration source spectrum is used to obtain the equivalent asperity radius. This level is given by the empirical relationship in Eq. (A.3) between seismic moment and short-period spectral level (Danet al., 2001).
A=2.46×10¹⁷×M0×1017
1/3
(A.3)
whereAis the short-period spectral level of the acceleration source spectrum in N·m/s2. The equivalent asperity radius
can be obtained from Eq. (A.4) under the assumption of a circular crack. Equation (A.4) is obtained by referring to Boatwright (1988) and Danet al.(2001).
r=(7π/4)·M0/(A·R)·β2 (A.4)
In Eq. (A.4),ris the equivalent asperity radius in km,R is the equivalent radius of the source faults in km, andβ is the shear wave velocity in km/s. In the second method, the combined asperity area is given by an empirical rela-tionship: for inland crustal earthquakes it is specified to be about 22% of the total rupture area (Somervilleet al., 1999). The static stress drop on asperity is estimated from Eq. (A.5) when a circular source fault can be assumed (Boatwright, 1988). Irikura’s recipe also proposes a method for estimating the stress drop on asperity for long strike-slip faults using the average static stress drop.
σa=(7/16)·M0/
r2·R=σc·(S/Sa) (A.5)
In Eq. (A.5),σais the static stress drop on asperity in
Fig. A.1. Flowchart of procedure to characterize fault parameters based on HERP recipe (modified from HERP, 2008b).
and Sa is the combined asperity area in km2. The stress
drop on asperity is treated as the effective stress on asperity. In HERP (2008b), the effective stress on the background area is estimated from the stress drop on asperity, the widths of the asperities and the total area, and the average slips of asperity and background area by following Dan et al. (2002).
HERP (2008b) describes that a number of asperity in each segment is 1 or 2 by referring to the past studies (e.g. Somervilleet al., 1999). The locations of the asperities are assumed by referring to the distribution of surface displace-ments measured along a fault. Irikura and Miyake (2010) also describes that the information on the back-slip rate found by GPS observations and the weak reflection coeffi-cients in the fault plane is useful to assume the locations of the asperities. In HERP (2008b), average slip on asperities is twice the average slip on the fault based on Somerville et al. (1999) and Ishiiet al. (2000). Meanwhile, Irikura and Miyake (2010) proposes that average slip on asperities is estimated by empirical relationship from quasi-dynamic simulation results of Dalgueret al.(2004, 2008).
The extra fault parameters are the rupture starting point, pattern of propagation of the rupture, and rupture velocity.
The candidate locations of rupture starting points can be estimated following Nakataet al.(1998) who gave a model of the relation between the branching geometry of active faults and the location of the rupture starting point.
References
Aichi Prefecture, Research Report of the Gifu-Ichinomiya and Yoro-Kuwana-Yokkaichi Fault Zones, 118 pp, 1998 (in Japanese).
Aichi Prefecture,Underground Structure in the Nobi Plain, 61–70, 2000 (in Japanese).
Aoi, S., K. Obara, S. Hori, K. Kasahara, and Y. Okada, New strong-motion observation network, KiK-net,Eos Trans. AGU,81, F863, 2000. Awata, Y., Y. Kariya, and K. Okumura, Segmentation of the surface
rup-tures associated with the 1891 Nobi earthquake, Central Honshu, Japan, based on the paleoseismic investigations,Interim Report on Active Fault and Paleoearthquake Researches in the 1998 Fiscal Year, 115–130, 1999 (in Japanese with English abstract).
Bessho, B., Unusual tectonic movements,Rep. Geol., Kanazawa Univ.,1, 1–364, 1967 (in Japanese).
Boatwright, J., The seismic radiation from composite models of faulting,
Bull. Seismol. Soc. Am.,78, 489–508, 1988.
Brune, J. N., Tectonic stress and the spectra of seismic shear waves from earthquakes,J. Geophys. Res.,75, 4997–5009, 1970.
Brune, J. N., Correction,J. Geophys. Res.,76, 5002, 1971.
faults for strong motion prediction by semi-empirical method,J. Struct. Constr. Eng., AIJ,545, 51–62, 2001 (in Japanese with English abstract). Dan, K., T. Sato, and K. Irikura, Characterizing source model for strong motion prediction based on asperity model,Proceedings of the Japan Earthquake Engineering Symposium, 555–560, 2002 (in Japanese with English abstract).
Dan, K., T. Muto, J. Miyakoshi, and M. Watanabe, Estimation of effective stress on asperities in inland earthquakes caused by large strike-slip faults and its application to strong motion simulation,J. Struct. Constr. Eng., AIJ,589, 81–88, 2005 (in Japanese with English abstract). Eshelby, J. D., The determination of the elastic field of an ellipsoidal
inclusion, and related problems,Proc. R. Soc. Lond. Ser. A,241, 376– 396, 1957.
Fujii, Y. and M. Matsu’ura, Regional difference in scaling laws for large earthquakes and its tectonic implication, Pure Appl. Geophys.,157, 2283–2302, 2000.
Fukuyama, E., M. Ishida, D. S. Dreger, and H. Kawai, Automated seismic moment tensor determination by using on-line broadband seismic wave-forms,Zisin, Second Ser.,5l, 149–156, 1998 (in Japanese with English abstract).
Fukuyama, E., I. Muramatu, and T. Mikumo, Seismic moment of the 1891 Nobi, Japan, earthquake estimated from historical seismograms,Earth Planets Space,59, 553–559, 2007.
Fukuwa, N., K. Yamaoka, M. Nakano, J. Tobita, T. Sato, and Y. Suzuki, Investigation for the mechanism of the seismic damage band on Nobi earthquake,Report of Grants-in-Aid for Scientific Research (Research Project Number F12480110), 2003 (in Japanese).
Geller, R. J., Scaling relations for earthquake source parameters and mag-nitudes,Bull. Seismol. Soc. Am.,66, 1501–1523, 1976.
Horikawa, H., K. Hirahara, Y. Umeda, M. Hashimoto, and F. Kusano, Si-multaneous inversion of geodetic and strong-motion data for the source process of the Hyogo-ken Nanbu, Japan, earthquake,J. Phys. Earth,44, 455–471, 1996.
Ikeda, T., K. Kamae, S. Miwa, and K. Irikura, Source characterization and strong ground motion simulation of the 2000 Tottori-ken Seibu earth-quake using the empirical Green’s function method,J. Struct. Cosntr. Eng., AIJ,561, 37–45, 2002 (in Japanese with English abstract). Irikura, K., Prediction of strong acceleration motions using empirical
Green’s function,Proc. 7th Japan Earthq. Eng, 151–156, 1986. Irikura, K. and K. Kamae, Estimation of strong ground motion in
broad-frequency band based on a seismic source scaling model and an empir-ical Green’s function technique,Ann. Geofis.,37, 1721–1743, 1994. Irikura, K. and H. Miyake, Prediction of strong ground motions for
sce-nario earthquakes,J. Geogr.,110(6), 849–875, 2001 (in Japanese with English abstract).
Irikura, K. and H. Miyake, Recipe for predicting strong ground motion from crustal earthquake scenarios,Pure Appl. Geophys., http://www. springerlink.com/content/424323g755p14436/fulltext.pdf, 2010. Irikura, K., H. Miyake, T. Iwata, K. Kamae, and H. Kawabe, Revised recipe
for predicting strong ground motion and its validation,11th JEEE, 567– 572, 2002 (in Japanese with English abstract).
Ishii, T., T. Sato, and P. G. Somerville, Identification of main rupture areas of heterogeneous fault models for strong ground-motion estimation,J. Struct. Constr. Eng., AIJ,527, 61–70, 2000 (in Japanese with English abstract).
Ito, K., Seismogenic layer, reflective lower crust, surface heat flow and large inland earthquakes,Tectonophysics,306, 423–433, 1999. Iwaki, H., H. Ito, N. Kitada, N. Inoue, T. Kagawa, K. Miyakoshi, K.
Takemura, and A. Okada, Compiling the catalog of surface faults due to large earthquakes and subjacent source faults,Active Fault Res.,26, 37–61, 2006 (in Japanese with English abstract).
Iwata, T. and H. Miyake, Ground motion simulation during a scenario earthquake based on the strong motion prediction recipe—In case of the northern part of the Biwako-Seigan faults as a hypothetical source fault—,J. JSNDS,23-2, 259–271, 2004 (in Japanese with English ab-stract).
Kamae, K. and K. Irikura, Source model of the 1995 Hyogo-ken Nanbu earthquake and simulation of near-source ground motion,Bull. Seismol. Soc. Am.,88, 400–412, 1998.
Kanda, K. and M. Takemura, Verification of the sequence of disastrous
Kanno, T., A. Narita, N. Morikawa, H. Fujiwara, and Y. Fukushima, A new attenuation relation for strong ground motion in Japan based on recorded data,Bull. Seismol. Soc. Am.,96, 879–897, 2006.
Kinoshita, S., Kyoshin Net (K-NET),Seismol. Res. Lett.,69, 309–332, 1998.
Kondo, H., Y. Awata, O. Emre, A. Dogan, S. Ozalp, F. Tokay, C. Yildirim, T. Yoshioka, and K. Okumura, Slip distribution, fault geometry, and fault segmentation of the 1944 Bolu-Gerede earthquake rupture, North Anatolian fault, Turkey,Bull. Seismol. Soc. Am.,95, 1234–1249, 2005. Koto, B., On the cause of the great earthquake in central Japan,J. Coll.
Sci., Imp. Univ. Tokyo,5, 295–353, 1893.
Kumamoto, T., A. Okada, S. Toda, K. Ueda, and Y. Ikeda, Trenching study of the Neodani fault of the Nobi active fault system at Kinbara, Gifu Prefecture in 1991 (1991 nen Nobi katsudansokei Neodani danso (Kinbara chiku) torenchi chousa),Active Fault Res.,10, 85–91, 1992 (in Japanese).
Madariaga, R., On the relation between seismic moment and stress drop in the presence of stress and strength heterogeneity,J. Geophys. Res., 84(B5), 2243–2250, 1979.
Matsuda, T., Surface faults associated with Nobi (Mino-Owari) earthquake of 1891, Japan,Spec. Rep. Earthq. Res. Inst.,13, 85–126, 1974 (in Japanese).
McCalpin, J. P.,Paleoseismology, 583 pp, Academic Press, 1996. McGill, S. F. and C. M. Rubin, Surficial slip distribution on the central
Emerson fault during the June 28, 1992, Landers earthquake, California,
J. Geophys. Res.,104, 4811–4833, 1999.
Midorikawa, S., M. Matsuoka, and K. Sakugawa, Site effects on strong motion records observed during the 1987 Chiba-Ken-Toho-Oki, Japan Earthquake,Proceeding of 9th Japan Earthquake Engineering Sympo-sium, E85-90, 1994.
Mikumo, T. and M. Ando, A search into the faulting mechanism of the 1891 great Nobi earthquake,J. Phys. Earth,24, 63–87, 1976. Miyakoshi, K., S. Ogata, T. Kakuda, Y. Satake, K. Tanaka, K. Kiho, Y.
Inohara, and Y. Kanaori, Activity of the Neodani fault: characteristics and analysis of fault movement at Kinbara, Gifu Prefecture,Industry Report number U88052, Central Research Institute of Electric Power Industry, 1988 (in Japanese with English abstract).
Muramatu, I., Distribution of seismic intensity and crustal deformation in the region destroyed by the great Nobi earthquake of October 28, 1891,
Res. Rep., Gifu Univ.,3, 202–224, 1963 (in Japanese).
Muramatu, I., Distribution of the percentage of collapsed houses in the Nobi plain for the Nobi earthquake of 1891,Res. Rep., Gifu Univ.,7, 867–882, 1983 (in Japanese with English abstract).
Muramatu, I. and M. Kominami, Collection of answers for a questionnaire investigation soon after the Nobi earthquake of 1891,Technical Note of the National Research Institute for Earth Science and Disaster Preven-tion,155, 1–841, 1992 (in Japanese with English abstract).
Muramatu, I., T. Matsuda, and A. Okada,The 1891 Nobi Earthquake and Neo-dani Fault Zone, 340 pp, Kokon Shoin, 2002 (in Japanese). Nakano, M., J. Miyakoshi, and K. Yamaoka, A new model for the fault
be-neath the sedimentary basin in the 1891 Nobi earthquake,Earth Planets Space,59, 13–19, 2007.
Nakata, T., K. Shimazaki, Y. Suzuki, and E. Tsukuda, Fault branching and directivity of rupture propagation,J. Geogr.,107, 512–528, 1998 (in Japanese with English abstract).
Okada, A., M. Watanabe, M. Ando, T. Tsukuda, and S. Hirano, Estimation of paleo-seismicity in the Nobi active fault system, central Japan: exca-vation study of the Umehara fault, central strand in the Nobi active fault system,J. Geogr.,101, 1–18, 1992 (in Japanese with English abstract). Omori, F.,General Report on the Nobi Earthquake, Gifu Observatory, 48–
88, 1894 (in Japanese).
Sato, H., A. Okada, T. Matsuda, and T. Kumamoto, Geology of a trench across the Midori fault scarp, from the Nobi earthquake of 1891, cen-tral Japan,J. Geogr.,101, 556–572, 1992 (in Japanese with English ab-stract).
Satoh, T., Radiation pattern and fmax of the Tottori-ken Seibu earthquake and the aftershocks inferred from KiK-net strong motion records,J. Struct. Constr. Eng., AIJ,556, 25–34, 2002 (in Japanese with English abstract).
engineering bedrock waves in which local site effects of surface geol-ogy are removed—Based on the ground motion records of small and medium earthquakes observed in the boreholes in Sendai—,J. Struct. Constr. Eng., AIJ,462, 79–89, 1994 (in Japanese with English abstract). Si, H. and S. Midorikawa, New attenuation relationships for peak ground acceleration and velocity considering effects of fault type and site con-dition,J. Struct. Constr. Eng., AIJ.,523, 63–70, 1999 (in Japanese with English abstract).
Sieh, K., The repetition of large-earthquake ruptures,Proc. Natl. Acad. Sci.,93, 3764–3771, 1996.
Somerville, P. G., K. Irikura, R. Graves, S. Sawada, D. Wald, N. Abraham-son, Y. Iwasaki, T. Kagawa, N. Smith, and A. Kowada, Characterizing crustal earthquake slip models for the prediction of strong ground mo-tion,Seismol. Res. Lett.,70, 59–80, 1999.
Sugisaki, R. and K. Shibata, Geochemical study on ground water (I): subsurface geology and aquifers in the Nobi plain,J. Geol. Soc. Jpn., 67, 335–345, 1961 (in Japanese with English abstract).
Sugiyama, Y., H. Sekiguchi, Y. Awata, Y. Fukushima, and K. Shimokawa, Correlation analysis between active fault parameters, and heterogeneous source characteristics,Report for Study on the Master Model for Strong Ground Motion Prediction Toward Earthquake Disaster Mitigation, 119–129, 2002 (in Japanese).
The Headquarters for Earthquake Research Promotion, Evaluation of Gifu-Ichinomiya fault zone, http://www.jishin.go.jp/main/chousa/ 01jan2/index.htm, 2001 (in Japanese).
The Headquarters for Earthquake Research Promotion, Examination of strong ground motion prediction method based on recorded seismograms for the 2000 Western Tottori Prefecture earthquake, http://www.jishin.go.jp/main/chousa/02oct_tottori/index.htm, 2002 (in Japanese).
The Headquarters for Earthquake Research Promotion, Evalua-tion of strong ground moEvalua-tion for scenario earthquake in the Takayama and the Ohara fault zone, http://www.jishin.go.jp/main/ kyoshindo/04sep_takayama/setsumei.pdf, 2004 (in Japanese). The Headquarters for Earthquake Research Promotion, Evaluation of
strong ground motion for scenario earthquake in the Yamasaki
fault zone, http://www.jishin.go.jp/main/kyoshindo/05jan_yamasaki/ setsumei.pdf, 2005 (in Japanese).
The Headquarters for Earthquake Research Promotion, Examination of strong ground motion prediction method based on recorded seismograms for the 2005 West Off Fukuoka Prefecture earth-quake, http://www.jishin.go.jp/main/kyoshindo/08apr_fukuoka/index. htm, 2008a (in Japanese).
The Headquarters for Earthquake Research Promotion, Strong ground mo-tion predicmo-tion method (“Recipe”) for earthquakes with specified source faults, http://www.jishin.go.jp/main/kyoshindo/08apr_kego/recipe.pdf, 2008b (in Japanese).
The Research Group for Active Faults of Japan,Active Faults in Japan, 437 pp, University of Tokyo Press, 1991.
Wald, D. and T. Heaton, Spatial and temporal distribution of slip for the 1992 Landers, California, earthquake,Bull. Seismol. Soc. Am.,84, 668– 691, 1994.
Wells, D. L. and K. J. Coppersmith, New empirical relationships among magnitude, rupture length, rupture width, rupture area, and surface dis-placement,Bull. Seismol. Soc. Am.,84, 974–1002, 1994.
Wesnousky, S. G., Displacement and geometrical characteristics of earth-quake surface ruptures: Issues and implications for seismic-hazard anal-ysis and the process of earthquake rupture,Bull. Seismol. Soc. Am.,98, 1609–1632, 2008.
Wessel, P. and W. H. F. Smith, New, improved version of the Generic Mapping Tools released,Eos Trans. AGU,79, 579, 1998.
Working Group on California Earthquake Probabilities, Seismic hazards in Southern California; Probable earthquake, 1994 to 2024,Bull. Seismol. Soc. Am.,85, 379–439, 1995.
Yoshioka, T., Y. Awata, K. Shimokawa, H. Ishimoto, M. Yoshimura, and K. Matsuura, Paleoseismological study of the Nukumi fault, the 1891 Nobi earthquake fault system, central Japan,Annual Report on Active Fault and Paleoearthquake Researches,1, 97–105, 2001 (in Japanese with English abstract).