R E S E A R C H
Open Access
Search-based routing in wireless mesh
network
Khalid Mahmood
1, Babar Nazir
2*, Iftikhar Ahmad Khan
2and Nadir Shah
3Abstract
Wireless technology is emerging as a key technology for the future networks. Wireless mesh networks (WMNs) have emerged as an indispensable technology for deployment of wireless services for various applications in personal, enterprise, and metropolitan areas. Researchers are working actively in different fields of WMNs for providing better services. Routing protocols play a vital role in WMNs to provide reliable configuration and maintenance of topology of the network. Designing a suitable cost metric for routing protocols to provide quality links for data transmission is the backbone of WMNs. Many cost metrics have been proposed for WMNs and is still an active research topic as new performance metrics need to be discovered due to the dynamics of this field. This paper considers the genetic algorithm-based routing technique for WMN.
We have studied the existing cost metrics and proposed a genetic algorithm technique for routing in WMN. To evaluate the genetic algorithm, and to determine the relative performance of the genetic algorithm in the context of routing in WMN, we carry out experiments on two test systems. We have evaluated the quality of the results produced by our algorithm with the traditional hop count metric results. Our results show that routing in WMN using genetic algorithm produces better results as compared to traditional hop count metric results. Finally, we carry out a detailed analysis of results, which help us in gaining an insight into the suitability of genetic algorithm for routing in WMN.
Keywords:Genetic algorithm, Wireless mesh network, WMN, Routing, Optimal path
1 Introduction
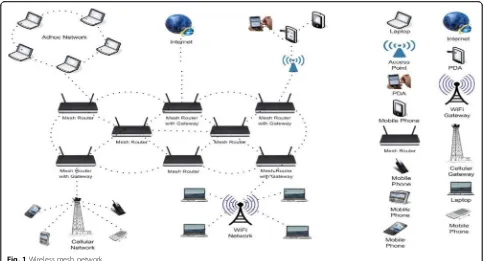
Wireless technology is emerging as new replacement of existing wired networking, but at the same time, many implementation challenges need to be addressed for the deployment of wireless technology. Wireless mesh networks (WMN) are better quality solution for high-performance and low-cost broadband Internet access in the context of enterprise networking [1]. These net-works impart spacious connectivity with lower cost, easy deployment, and reliable service coverage than their counterpart-wired networks [2, 3]. The backbone of WMNs is composed of mesh routers as shown in Fig. 1 which have limited or no mobility, and they offer network access to both mesh and conventional clients. WMN provides a quick way to select a mesh router as
the gateway [4]. Gateway routers are connected to Internet with a wired link [5].
Routing plays an important role in both wired and wireless networks. One can easily improve the perform-ance and quality of the network by introducing the better routing approach. WMNs are the preeminent broadband communication systems and require an end to end QoS to its users. To achieve best performance in WMNs, the traffic should be routed on optimal path. Theoretical studies [6, 7] show that routing in WMN is an optimization problem. It has also been observed in the literature that the traffic demand in wireless net-works [8] is dynamic and hard to estimate. Such obser-vations put a question mark on suitability of the existing optimization-based routing solutions in WMNs.
To address this challenge, this paper investigates the routing technique in WMN which takes into ac-count the dynamic behavior of traffic demands. This paper further identifies an optimization framework which finds an optimal path for routing in WMN.
* Correspondence:babarnazir@gmail.com
2Department of Computer Science, COMSATS Institute of Information
Technology, University Road, Tobe Camp, 22060 Abbottabad, Pakistan Full list of author information is available at the end of the article
We formulate optimal path routing problem as search-based problem. We have investigated evolutionary optimization techniques to solve the routing problem in WMN. These techniques can find global optimum solution to a given problem. We have used an evolu-tionary optimization technique named as genetic algo-rithm for routing in WMN. It considers the link bandwidth and packet loss ratio into account; optimal path is selected among all the available paths from source to destination on the basis of aggregated cost of all the links of the path. The aggregated cost of the path is calculated by our newly designed cost metric that is used as fitness function in genetic algorithm to evaluate the optimal path.
The rest of the paper is organized as follows: In Section 2, we have given the literature review of exist-ing routexist-ing metrics, optimization, and search-based problems. Section 3 illustrates our proposed solution. The experimental results and analysis are discussed in
Section 4. Finally, in Section 5, we present the conclu-sion of the paper.
2 Related work
2.1 Existing routing metrics
Routing protocols play an important role in finding best path and forwarding the data along the path. Cost metric is the foundation of a routing protocol. The better the cost metric of a protocol, the better will be the result of the routing protocol. In any network, the cost of forwarding packet along the link is known as the cost metric of a link. Defining a cost metric for wireless net-works is a great deal as compared to traditional wired networks because of unevenness of link characteristics between nodes. There are many factors which directly influence the communication quality within wireless networks such as background noise, channel fading, ob-stacles, and interference [9]. Researchers are working ac-tively in this area and have proposed different cost Fig. 1Wireless mesh network
Table 1Comparison of routing protocols
Type of protocol Hello message Multicasting Routing metrics Loop free Scalability Reliability Load balancing
DSR Reactive No No Shortest path Yes No Yes No
AODV Reactive Yes Yes Shortest path Yes No Yes No
LQSR Reactive Yes Yes Hop count, RTT, ETX Yes No Yes Yes
DSDV Proactive No No Shortest path Yes No Yes No
OLSR Proactive Yes No Shortest path Yes No Yes No
Node
Path
Fig. 2A simple network
Table 2Path cost calculation
Links df,dr ETX = 1/(df×dr) Bandwidth ETT = ETX × (S/B × 1024) Path
X l¼1
n
ETTl Hop count Path cost
S→1 1, 1 1 48 Mbps 0.000020345 S→1→4→D 0.000343282 3 0.001029847
1→4 0.9, 0.8 1.388888889 15 Mbps 0.000090422
4→D 0.7, 0.4 3.571428571 15 Mbps 0.000232515
S→3 0.6, 0.2 8.333333333 15 Mbps 0.000542535 S→3→D 0.001414466 2 0.002828931
3→D 0.8, 0.7 1.785714286 2 Mbps 0.000871931
S→1 1,1 1 48 Mbps 0.000020345 S→1→3→D 0.000922417 3 0.00276725
1→3 1, 0.9 1.111111111 36 Mbps 0.000030141
3→D 0.8, 0.7 1.785714286 2 Mbps 0.000871931
S→1 1, 1 1 48 Mbps 0.000020345 S→1→3→4→D 0.000934042 4 0.00373617
1→3 1, 0.9 1.111111111 36 Mbps 0.000030141
3→4 0.5, 0.2 10 15 Mbps 0.000651042
4→D 0.7, 0.4 3.571428571 15 Mbps 0.000232515
S→1 1,1 1 48 Mbps 0.000020345 S→1→3→5→D 0.000161253 4 0.000645014
1→3 1, 0.9 1.111111111 36 Mbps 0.000030141
3→5 1, 1 1 48 Mbps 0.000020345
5→D 0.9, 0.8 1.388888889 15 Mbps 0.000090422
S→3 0.6, 0.2 8.333333333 15 Mbps 0.000542535 S→3→4→D 0.001426091 3 0.004278274
3→4 0.5, 0.2 10 15 Mbps 0.000651042
4→D 0.7, 0.4 3.571428571 15 Mbps 0.000232515
S→3 0.6, 0.2 8.333333333 15 Mbps 0.000542535 S→3→5→D 0.000653302 3 0.001959907
3→5 1, 1 1 48 Mbps 0.000020345
5→D 0.9, 0.8 1.388888889 15 Mbps 0.000090422
S→2 0.9, 0.9 1.234567901 15 Mbps 0.000080376 S→2→3→D 0.004207515 3 0.012622544
2→3 0.5, 0.2 10 3 Mbps 0.003255208
3→D 0.8, 0.7 1.785714286 2 Mbps 0.000871931
S→2 0.9, 0.9 1.234567901 15 Mbps 0.000080376 S→2→5→D 0.001527135 3 0.004581404
2→5 0.6, 0.4 4.166666667 3 Mbps 0.001356337
5→D 0.9, 0.8 1.388888889 15 Mbps 0.000090422
S→2 0.9, 0.9 1.234567901 15 Mbps 0.000080376 S→2→3→5→D 0.003446351 4 0.013785405
2→3 0.5, 0.2 10 3 Mbps 0.003255208
3→5 1, 1 1 48 Mbps 0.000020345
metrics for wireless networks. These are hop count, per-hop round trip time (RTT), per-per-hop packet pair delay (PktPair), expected transmission count (ETX), modified ETX (mETX), effective number of transmission (ENT), expected transmission time (ETT), weighted cumulative expected transmission time (WCETT), and metric of interference and channel switching (MIC). These metrics are discussed in [9, 10]. The comparison of routing pro-tocols that uses these metrics is shown in Table 1.
Table 4GA model 1 parameters
Selection method Elitism Nodes Population size Generations
Roulette wheel Yes 50 500 1000
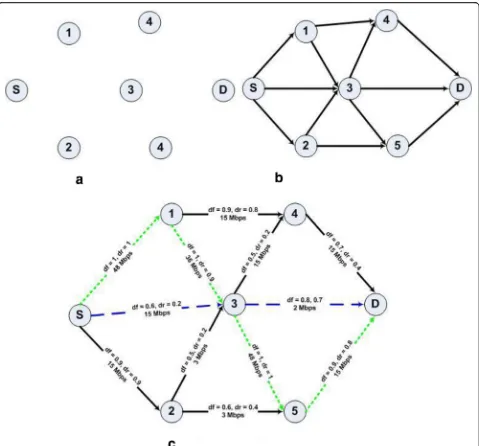
Fig. 3aSample topology.bAvailable paths from source to destination.cOptimal path and minimum hop count path
Table 3Simulation parameters
Variables Values
MAC type 802.11
Packet size 1 KB
Bandwidth of links Actual bandwidth of a link Radio type Half duplex
Crossover rate 0.1 to 0.9 Mutation rate 0.01 to 0.09
Generations 1000
Elitism True/false
Population size 500 and 1000 Network nodes 50 and 100
2.2 Optimization and search-based problems
Optimization is a method of the application of suc-ceeding iterations with application of variations on initial idea [11], i.e., optimization is fine-tuning of var-iables of system to get preferred output. The focal point of optimization techniques is an optimal point, while intervening performance is disregarded [12].
In real life, there are a large number of problems where search space (i.e., all possible solution to problems including good solutions which fulfill desired constraints and bad solutions which do not fulfill desired con-straints) is very large as compared to solution space. A solution is considered as the best solution if we check all possible options for solution. In-depth search fails if search space is too large as compared to solution space. Such types of problems are not solvable in polynomial time because best solution may be difficult to achieve, so an effort is made to find a suboptimal solution.
Routing in WMNs is an optimization problem where optimal path needs to be selected from a large number of possible paths. The main purpose of optimization is to search values for a number of parameters whose aim is to maximize or minimize the objective function [13, 14]. To formulate the routing problem in WMN as
a search-based problem, three tasks need to be carried out: first is the representation of problem which is agree-able to symbolic manipulation, second is a fitness func-tion specifying integrity of available opfunc-tions, and third is the set of manipulation operators. The authors in [15] have proposed distributed scheduling scheme for video streaming over multi-channel, multi-radio, multi-hop wireless networks and formulated the scheduling as a convex optimization problem. The schemes used in [15] mainly focus on applications having video streaming, while our work focus on link quality regardless of any application constraints.
2.3 Genetic algorithm-based solution to search-based problems
Genetic algorithms are optimization methods that make use of a search process reproduced from the mechanism of biological selection and biological genetics [12]. Gen-etic algorithms follow the natural search and selection processes as described in genetics for biological pro-cesses which lead them to find the fittest individuals [12]. Genetic algorithm (GA) belongs to the class of evo-lutionary algorithm. The aim of GA is to find accurate or approximate solution for a given problem in a mean-ingful way.GA gives much better results when exhaustive search techniques fail [11].
It is normally observed in many optimization methods that we start finding the optimal solution from search space using some transition rules by starting from a single point and moving to the next point in search space. The transition rules are normally deterministic. Genetic algorithm initiates with a set of solutions which are encoded with some suitable GA encoding scheme. Successive sets of solutions are generated depending upon previously generated sets. These sets of solutions Table 5Optimal path and minimum hop count results of GA
model 1 count cost × 1000
(0.9, 0.08) 12 11 11 40
Fig. 4Optimal path cost versus minimum hop count path cost for GA model 1
Table 6GA model 2 parameters
Selection method Elitism Nodes Population size Generations
are generated with the help of an objective function known as fitness function. The integrity of solution de-pends upon this objective function [12]. Following are the components of genetic algorithm.
2.3.1 Variable selection
Every problem normally is influenced by some factors which provide basis for the resolution of that problem. Variable selection is the process of finding all such vari-ables which effect problem resolution. For example, in the case of routing in WMN, congestion avoidance at mesh nodes, high throughput, minimum interference, minimum cost, expected transmission time, and opti-mal channel assignment; all these play a significant role in finding best routing solution.
2.3.2 Fitness function
The resolution of a problem primarily depends upon fitness function. A fitness function discriminates the good solution from bad. It is based upon those variables which affect the problem. Appropriate weights are assigned to variables through fitness function. The out-come of fitness function is normally one value which
indicates the level of goodness for solution. In our rout-ing problem, we define a mechanism to compute the path cost by using Eq. 1, which defines a criterion for optimal or non-optimal path within WMN.
2.3.3 Encoding scheme
GA is normally operated on coded variable values rather than on actual ones. The literature survey shows that there exists many encoding schemes, but two of them are commonly used. These are binary encoding and real encoding [12]. The performance of GA is highly dependent on these encoding schemes which play a vital role in determining the reliability of GA [16]. An inadequately coded GA may not deliver the results in expected time [12].
The routing problem can be encoded as a string of in-tegers generated by sequence of integer number ID’s of connected nodes. For example, in Fig. 2, we assign IDs 0, 1, 2, 3, 4, 5, 6, 7, 8, and 9 to each node in the network, and a possible path between source node 0 to destin-ation node 9 can be 0→1→3→7→9. This sequence specifies a solution as a routing path where node 0 is connected to node 1, node 1 is connected to node 3, node 3 is connected to node 7, and node 7 is connected to node 9. The solution generated in this way in which all adjacent nodes are connected is valid. The sequence 0→1→4→9 is an invalid sequence because node 4 is not directly connected to node 9; hence, this routing path from node 0 to node 9 is an invalid path.
2.3.4 Initial population
The set of solutions in GA is known as a population. Each solution in solution set is known as a chromosome, while each element in the chromosome is called a gene. Table 7Optimal path and minimum hop count results of GA
model 2 count cost × 1000
(0.9, 0.09) 14 29 11 221
Fig. 5Optimal path cost versus minimum hop count path cost for GA model 2
Table 8GA model 3 parameters
Selection method Elitism Nodes Population size Generations
Each time GA runs, give a population and all succeeding populations depend upon preceding populations. The selection of initial population in GA is normally random. Initial population having high fitness values can quickly direct to acceptable solution. Encoding depicted in pre-vious Section 2.3.3, i.e., [0→1→3→7→9], represents a chromosome, while one of the hops can be regarded as a gene. Working of GA requires a set of solutions; there-fore, more than one solution can be generated at one time. A population of four solutions (chromosomes) can be represented as [0→1→3→7→9], [0→1→4→ 8→9], [0→2→5→9] and [0→1→3→6→8→9].
2.3.5 Selection
Selection is the process for creation of new population. In this process, we select two members from a popula-tion. These members are used for crossover and muta-tion operamuta-tions to create new populamuta-tion. Commonly used selection methods in GA are roulette wheel and tournament [16]. The comprehensive discussion of dif-ferent selection methods can be seen in [12].Two solu-tions (chromosomes) are selected from a population with the application of suitable selection method for generating new solutions (chromosomes). The selection methods assure the selection of best solutions.
2.3.6 GA operators
GA operators bring into play the generation of new populations from existing ones. These operators use best features of current population and produce better population as compared to previous one. Reproduction, crossover, and mutation are the GA operators. In reproduction, new population is generated based on fitness values of current population. High fitness solu-tions are used from current population to generate new population [12]. Newly generated and previous populations are combined in crossover step to generate new population according to a predefined scheme. Normally, new population is generated with best fea-tures as compared to previous one from reproduction and crossover steps, but some time, the entire reproduction and crossover process may result in loss of some information so mutation operator is applied. The process of mutation reduces the chance of trap-ping in local optima [12]. These operators have many variations and usually depend upon encoding schemes. The design of GA operators should be as much as necessary so that only feasible solutions should be created [16]. So, if we select [0→1→3→7→9] and [0→2→3→6→8→9] chromosomes (two solutions from source 0 to destination 9) from Fig. 2, then apply-ing one-point crossover operator with crossover point being 3 result two new solutions [0→2→3→7→9] and [0→1→3→6→8→9]. Other common cross-over operators are two-point and uniform crosscross-over which can be viewed in [12].
Mutation operator randomly changes one or more genes of a selected chromosome to increase the struc-tural variability of the population. In GA, the role of mutation operator is to restore the lost or unexplored genetic material into the population to prevent the pre-mature convergence of GA to suboptimal solutions. Table 9Optimal path and minimum hop count results of GA
model 3 count cost × 1000
(0.9, 0.08) 13 18 11 48
Fig. 6Optimal path cost versus minimum hop count path cost for GA model 3
Table 10GA model 4 parameters
Selection method Elitism Nodes Population size Generations
2.3.7 Convergence
The convergence state in GA produces the desirable re-sults and inquires the algorithm to stop [11, 17]. Stop-ping criteria based upon fitness value of solutions should be defined with an acceptance factor in convergence state of GA. The processing of algorithm should be stopped after fixed number of iterations if the conver-gence is not achieved.
2.3.8 Elitism
A chromosome with highest fitness value is known as elite chromosome. Elitism in GA is used to retain the elite chromosome in next generation for achieving best solutions. In this way, we have a best solution in each population during the processing of GA.
3 Proposed solution
Routing in WMNs is an optimization problem where we have a large number of solution space. So, we need an optimization technique to find the optimal path from solution space. Genetic algorithm is the best choice for finding optimal path. We have exhibited all the steps in-volved in GA on our proposed technique, so in this way,
we have applied GA as a search-based method to find an optimal path for routing in WMN.
3.1 Application of genetic algorithm in WMN routing Application of genetic algorithm in WMN routing re-quires performing all the steps listed in Section 2.3. We will describe all those steps for the application of genetic algorithm in WMN.
3.1.1 Variable selection
In our proposed solution for routing in WMN, we have three types of variables which affect the resolution of problem. First, the expected transmission count (ETX) between each pair of nodes along the complete path from source to destination. ETX between nodes is calcu-lated based on packet delivery ratio in forward direction (df) and in reverse direction (dr). The probability of
suc-cessful data transmission and acknowledgment isdf×dr.
ETX for the complete route is the sum of ETX calcu-lated for each link in that particular route. The second variable is the expected transmission time (ETT) be-tween each pair of nodes along the complete path from source to destination. The time spent in transmission of a packet along a link l, i.e., ETTl, is obtained by
multi-plying ETXl by the link bandwidth (S/B). ETT for the
complete route is the sum of ETT calculated for each link in that particular route. The third variable is the hop count. The values for ETX, ETT, and hop count are obtained by performing simulation on our test systems in NS-2, and the results are shown in Table 2.
3.1.2 Fitness function
Fitness function is based on variables involved in the system. We have designed our own fitness function [5] Table 11Optimal path and minimum hop count results of GA
model 4 count cost × 1000
(0.9, 0.06) 12 29 11 208
Fig. 7Optimal path cost versus minimum hop count path cost for GA model 4
Table 12Experimental parameters
Nodes Population Generations
which is based on hop count and aggregated ETT along the path from source to destination.
Path Cost¼Hop Count X
n
l¼1
ETTl ð1Þ
wherelis the link between two nodes.
3.1.3 Encoding scheme
We have applied real encoding on our routing problem. The routing problem can be encoded as a string of integers generated by sequence of integer number IDs of connected nodes. For example in Fig. 2, we assigned IDs 0, 1, 2, 3, 4, 5, 6, 7, 8, and 9 to each node in the network, and a possible path between source node 0 to destin-ation node 9 can be 0→1→3→7→9. This sequence specifies a solution as a routing path where node 0 is connected to node 1, node 1 is connected to node 3, node 3 is connected to node 7, and node 7 is connected to node 9. The solution generated in this way in which all adjacent nodes are connected is valid. The sequence 0→1→4→9 is an invalid sequence because node 4 is not directly connected to node 9; hence, this routing path from node 0 to node 9 is an invalid path.
3.1.4 Initial population
Initial population plays a very important role for find-ing optimal solution as this initial population is used to generate new populations through crossover operator. Initially, we have generated a subset of large set of pos-sible paths from source to destination on “50 and 100 nodes WMN,” respectively. All these paths are evalu-ated by using Eq. 1.
3.1.5 Selection for crossover
We have applied roulette wheel and tournament tion mechanisms for selection [12]. Roulette wheel selec-tion mechanism [18] has the similar selecting principle as roulette wheel. In GA, each sector of the roulette wheel corresponds to an individual from the population. The probability of the individual to be selected into the next generation depends upon the proportion of the individual’s fitness value to the total fitness values of the whole population.
Tournament approach [11] selects individuals based on their fitness values. This method selects a subset of two or three chromosomes from the mating pool, and the parent will be the chromosomes with the lowest cost in the subset. This method is suitable for large population sizes because the population never needs to be sorted.
3.1.6 Crossover
We have applied one-point crossover [12]. A crossover point is chosen in the solution string to perform one-point crossover, and contents of solutions are exchanged before or after the crossover point.
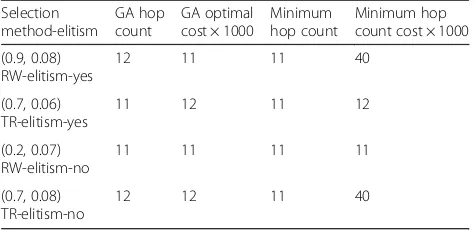
Table 13Summarized results of optimal path on 50 nodes WMN count cost × 1000
(0.9, 0.08)
RWroulette wheel,TRtournament
Fig. 8Comparative results of minimum hop count path cost versus optimal path cost on 50 nodes WMN Table 14GA model 5 parameters
Selection method Elitism Nodes Population Generations
3.1.7 Elitism
We have used elitism for preserving solutions with best fitness for next generation. Elitism is applied by retaining the best solution of current generation. After applying the crossover and mutation, new population is generated and the worst solution of new population is replaced with the preserved best solution. In this way, this mech-anism ensures that the best solution is retained in any generation.
3.1.8 Convergence
The convergence criterion is not well defined for routing in WMNs using genetic algorithm. We used to calculate path cost for each solution in population which enables us to determine the goodness of solution. Our designed fitness function, i.e., path cost, is based on hop count and aggregated ETT along the path from source to des-tination, so optimal path selection solely rely on path cost. The path with minimum transmission time will be selected as optimal path for routing; therefore, if the value of the path cost of some solution is minimum than the other set of solutions, this solution will be considered to be better. We cannot give a final verdict that some value for path cost is best and we stop the
iterations. However, we can stop our solution after some specified number of iterations, and by applying elitism, we can ensure that we have a best solution at current state of computation.
3.2 An illustrative example
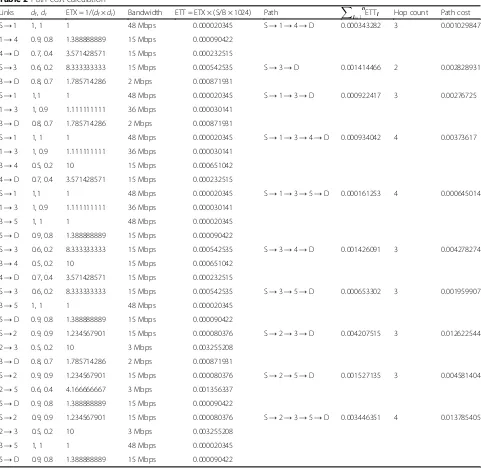
In Fig. 3, we have shown an illustration of our proposed routing scheme for finding optimal path for routing. Fig-ure 3a shows the sample topology. The available paths from source node Sto destination nodeDare shown in Fig. 3b. All available links within a complete path from source to destination, their bandwidthB, ETX, ETT, hop count, and path cost, are shown in Table 2.
Path cost for all available paths is calculated by using Eq. 1, and all the calculated results are shown in Table 2. The size of probe packetSused for calculating the path is 1 KB. Figure 3c shows optimal path and minimum hop count path. The path with small dotted lines shows the optimal path, while the path with large dotted lines shows the minimum hop count path. Although the optimal path shown in Fig. 3c has more hops than that of the minimum hop count path, the cost of optimal path is minimum than that of the mini-mum hop count path. Our proposed solution is based on path cost which depends on aggregated ETT; there-fore, the results obtained are better than traditional hop count path. The minimum hop count path selects the path on the basis of minimum hops in a particular path and does not consider the link quality, while our pro-posed solution reflects the optimal path by considering link quality.
4 Experimental results and analysis
We have evaluated the WMN routing problem using C#. Net and NS-2 and compared it with traditional hop Table 15Optimal path and minimum hop count results of GA
model 5 count cost × 1000
(0.9, 0.08) 18 45 17 144
Fig. 9Optimal path cost versus minimum hop count path cost for GA model 5
Table 16GA model 6 parameters
Selection method Elitism Nodes Population Generations
count metric. We carry out our simulation on “50 and 100 nodes WMN.” First, we have calculated the path cost using Eq. 1 and hop count for each path in the net-work, and after that, we have applied genetic algorithm for finding the optimal path. In genetic algorithm, we have used crossover rate from 0.1 to 0.9 and mutation rate from 0.01 to 0.09 with and without elitism. Table 3 depicts the simulation parameters for finding optimal path for routing in WMN.
4.1 Application of GA model 1
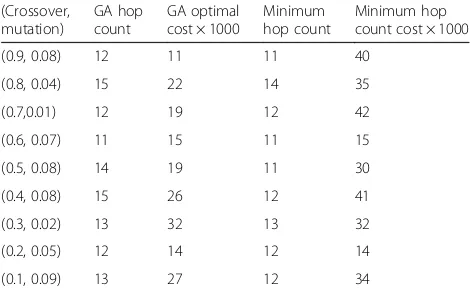
GA model 1 (depicted in Table 4) is applied on “50 nodes WMN.”The selection method roulette wheel with elitism is employed for finding the optimal path for rout-ing in WMN. In GA model 1, the population size is 500 with 1000 generations. Table 5 shows the optimal path, and minimum hop count results on different crossover and mutation rates.
Figure 4 shows that on“50 nodes WMN,”the optimal path is selected on crossover and mutation rates (0.9 and 0.08, respectively). Keeping the same crossover and mutation rates, the cost of minimum hop count path is more than that of GA cost, and thus, the path selected through minimum hop count metric is not optimal.
4.2 Application of GA model 2
The parameters for GA model 2 are shown in Table 6 that are operated on “50 nodes WMN.” To acquire an optimal path for routing, the selection method Tourna-ment with elitism is used. Genetic algorithm is exe-cuted on population size 500 with 1000 generations. The comparative results for optimal path and minimum hop count on different crossover and mutation rates are presented in Table 7.
Figure 5 shows that on“50 nodes WMN,” the optimal path is selected on crossover and mutation rates (0.7 and 0.06, respectively). Keeping the same crossover and mutation rates, the cost of minimum hop count path is same as of GA cost, and thus, the path selected through minimum hop count metric is also an optimal path.
4.3 Application of GA model 3
GA model 3 (depicted in Table 8) is applied on “50 nodes WMN.” The selection method roulette wheel without elitism is employed for finding the optimal path for routing in WMN. In GA model 3, the popula-tion size is 500 with 1000 generapopula-tions. Table 9 shows the optimal path and minimum hop count results on different crossover and mutation rates.
Figure 6 shows that on“50 nodes WMN,” the optimal path is selected on crossover and mutation rates (0.2 and 0.07, respectively). Keeping the same crossover and mutation rates, the cost of minimum hop count path is same as of GA cost, and thus, the path selected through minimum hop count metric is also an optimal path.
4.4 Application of GA model 4
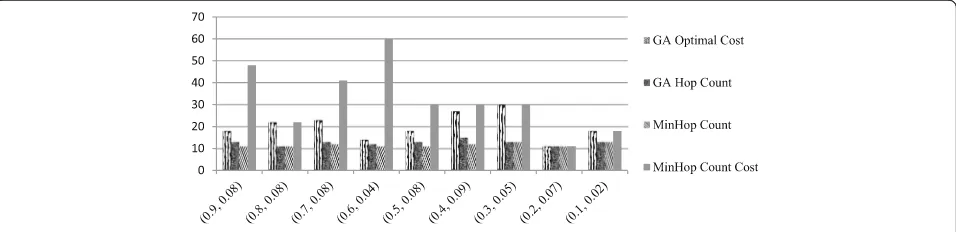
GA model 4 (depicted in Table 10) is applied on “50 nodes WMN.” The selection method Tournament with-out elitism is employed for finding the optimal path for Table 17Optimal path and minimum hop count results of GA
model 6 count cost × 1000
(0.9, 0.07) 19 37 17 44
Fig. 10Optimal path cost versus minimum hop count path cost for GA model 6
Table 18GA model 7 parameters
Selection method Elitism Nodes Population Generations
routing in WMN. In GA model 4, the population size is 500 with 1000 generations. Table 11 shows the optimal path and minimum hop count results on different cross-over and mutation rates.
Figure 7 shows that on “50 nodes WMN,” the opti-mal path is selected on crossover and mutation rates (0.7 and 0.08, respectively). Keeping the same cross-over and mutation rates, the cost of minimum hop count path is more than that of GA cost, and thus, the path selected through minimum hop count metric is not optimal (Table 12).
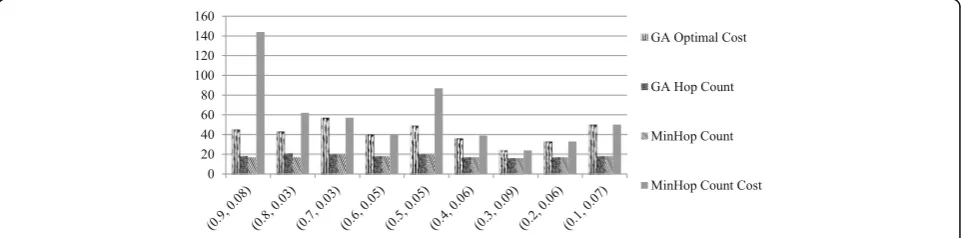
4.5 Summarized results of optimal path on 50 nodes WMN Table 13 shows the summarized results of optimal path on“50 nodes WMN.” The results are taken by applying selection methods roulette wheel and tournament with and without elitism.
Figure 8 shows that on “50 nodes WMN,” optimal path is selected on crossover and mutation rates (0.9 and 0.08, respectively) on selection method roulette wheel with elitism. Keeping the same parameters, minimum hop count path cost is more than that of GA cost, and thus, the path selected through minimum hop count metric is not optimal. The optimal path cost obtained through selection method roulette wheel
without elitism on crossover and mutation rates (0.2 and 0.07) is same for both GA and minimum hop count. The optimal path cost obtained through selec-tion method tournament with elitism on crossover and mutation rates (0.7 and 0.06) is same for both GA and minimum hop count. By applying selection method tournament without elitism, the optimal path is se-lected on crossover and mutation rates (0.7 and 0.08). Keeping the same parameters, minimum hop count path cost is more than that of GA cost, and thus, the path selected through minimum hop count metric is not optimal.
4.6 Application of GA model 5
GA model 5 (depicted in Table 14) is applied on “100 nodes WMN.”The selection method roulette wheel with elitism is employed for finding the optimal path for rout-ing in WMN. In GA model 5, the population size is 1000 with 1000 generations. Table 15 shows the optimal path and minimum hop count results on different cross-over and mutation rates.
Figure 9 shows that on “100 nodes WMN,” optimal path is selected on crossover and mutation rates (0.3 and 0.09, respectively). Keeping the same crossover and mutation rates, the cost of minimum hop count path is also same as of GA cost, and thus, the optimal path is same for GA and minimum hop count metric.
4.7 Application of GA model 6
GA model 6 (depicted in Table 16) is applied on “100 nodes WMN.” The selection method tournament with elitism is employed for finding the optimal path for routing in WMN. In GA model 6, the population size is 1000 with 1000 generations. Table 17 shows the opti-mal path and minimum hop count results on different crossover and mutation rates.
Table 19Optimal path and minimum hop count results of GA model 7 count cost × 1000
(0.9, 0.02) 20 49 20 49
Fig. 11Optimal path cost versus minimum hop count path cost for GA model 7
Table 20GA model 8 parameters
Selection method Elitism Nodes Population size Generations
Figure 10 shows that on “100 nodes WMN,” opti-mal path is selected on crossover and mutation rates (0.6 and 0.08, respectively). Keeping the same cross-over and mutation rates, the cost of minimum hop count path is more than that of GA cost, and thus, the path selected through minimum hop count metric is not optimal.
4.8 Application of GA model 7
GA model 7 (depicted in Table 18) is applied on “100 nodes WMN.” The selection method roulette wheel without elitism is employed for finding the optimal path for routing in WMN. In GA model 7, the popula-tion size is 1000 with 1000 generapopula-tions. Table 19 shows the optimal path and minimum hop count results on different crossover and mutation rates.
Figure 11 shows that on“100 nodes WMN,” optimal path is selected on crossover and mutation rates (0.7 and 0.09; 0.1 and 0.07). Keeping the same crossover and mutation rates, the cost of minimum hop count path is also same as of GA cost, and thus, the path se-lected through minimum hop count metric is also an optimal path.
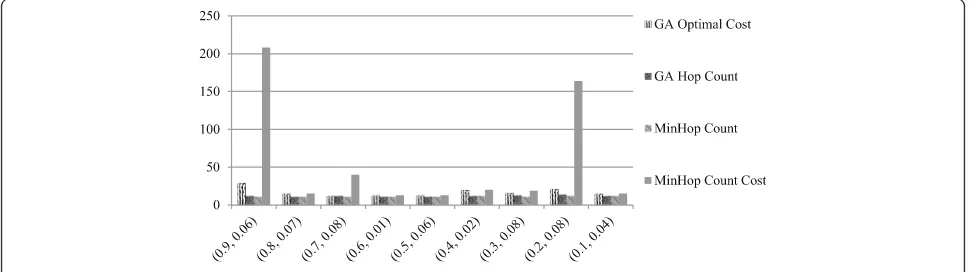
4.9 Application of GA model 8
GA model 8 (depicted in Table 20) is applied on “100 nodes WMN.” The selection method tournament with-out elitism is employed for finding the optimal path for routing in WMN. In GA model 8, the population size is 1000 with 1000 generations. Table 21 shows the optimal path and minimum hop count results on different cross-over and mutation rates.
Figure 12 shows that on“100 nodes WMN,”optimal path is selected on crossover and mutation rates (0.5 and 0.06; 0.1 and 0.05). Keeping the same crossover and mutation rates, the cost of minimum hop count path is more than that of GA cost, and thus, the path selected through mini-mum hop count metric is not an optimal path (Table 22).
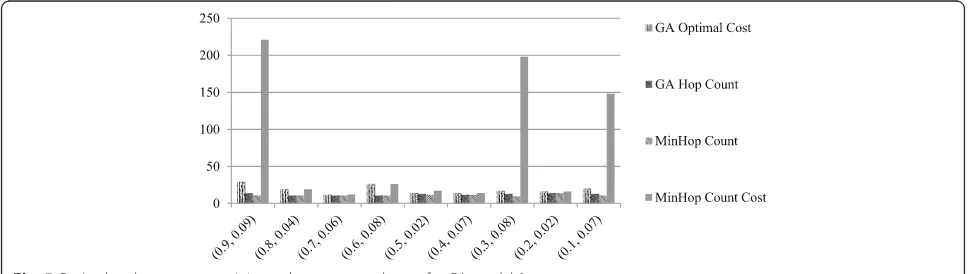
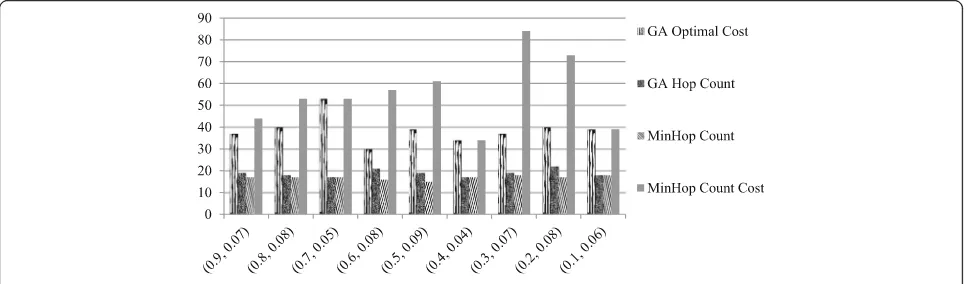
4.10 Overall optimal path results on 100 nodes WMN Table 23 shows the summarized results for optimal path on“100 nodes WMN.”The results are taken by applying selection methods roulette wheel and tournament with and without elitism.
The graph in Fig. 13 shows that on “100 nodes WMN,”optimal path is selected on crossover and muta-tion rates (0.3 and 0.09, respectively) on selecmuta-tion method roulette wheel with elitism. Keeping the same parameters, minimum hop count path cost is also same as of GA cost, and thus, the path selected through mini-mum hop count metric is also an optimal path. The optimal path cost obtained through selection method roulette wheel without elitism on crossover and muta-tion rates (0.7 and 0.09; 0.1 and 0.07) is same for both GA and minimum hop count. By applying selection method tournament with elitism, the optimal path is se-lected on crossover and mutation rates (0.6 and 0.08). Keeping the same parameters, minimum hop count path Table 21Optimal path and minimum hop count results of GA
model 8 count cost × 1000
(0.9, 0.09) 18 46 17 76
Fig. 12Optimal path cost versus minimum hop count path cost for GA model 8
Table 22Experimental parameters
Nodes Population Generations
cost is more than that of GA cost, and thus, the path se-lected through minimum hop count metric is not an optimal path. By applying selection method tournament without elitism, the optimal path is selected on crossover and mutation rates (0.1 and 0.05; 0.5 and 0.06). Keeping the same parameters, minimum hop count path cost is more than that of GA cost, and thus, the path selected through minimum hop count metric is not optimal.
The experimental results and data analysis taken on our proposed technique show that GA returns high throughput path with minimum transmission delay. It is also observed that the path selected by our proposed technique although have more hop count as compared to minimum hop count path, the transmission time is less and the throughput is high.
5 Conclusions
The study and analysis of routing in WMN using genetic algorithm guide us to conclude that using GA technique instead of traditional hop count for finding optimal path gives better results. The experimental results taken on“50
nodes WMN” and“100 nodes WMN”test systems show that the cost of optimal paths obtained through GA is minimum than the cost of traditional hop count metric in most of the cases. Although GA takes more time than hop count metric for finding the optimal path, GA returns high throughput path for routing. We have applied two selection methods, roulette wheel and tournament, on our two test systems. We have also investigated the role of crossover rate and mutation rate by taking different values. The range of crossover rate is 0.1 to 0.9, while the range of mutation rate is 0.01 to 0.09. We collected best results from these combinations and used them in analysis. The best result for roulette wheel method on“50 nodes WMN”test system is on 0.9 and 0.08 for crossover and mutation, respectively, while the best result for tour-nament method is on 0.7 and 0.06 for crossover and mutation, respectively. Similarly, on “100 nodes WMN” test system, the best result for roulette wheel method is on 0.3 and 0.09 for crossover and mutation, respectively, while the best result for tournament method is on 0.6 and 0.08 for crossover and mutation, respectively.
Table 23Summarized results for optimal path on 100 nodes WMN
Selection method-elitism GA hop
count
GA optimal cost × 1000
Minimum hop count
Minimum hop count cost × 1000
(0.3, 0.09) RW-elitism-yes
16 24 16 24
(0.6, 0.08) TR-elitism-yes
21 30 16 57
(0.7, 0.09) RW-elitism-no
18 36 18 36
(0.1, 0.07) RW-elitism-no
19 36 19 36
(0.1, 0.05) TR-elitism-no
20 33 17 163
(0.5, 0.06) TR-elitism-no
22 33 17 124
RWroulette wheel,TRtournament
Acknowledgements
Competing interests
The authors declare that they have no competing interests.
Author details
1Department of Information Systems, King Khalid University, College of
Science and Arts, Mahayel Aseer Saudi Arabia, Guraiger, Saudi Arabia.
2Department of Computer Science, COMSATS Institute of Information
Technology, University Road, Tobe Camp, 22060 Abbottabad, Pakistan.
3Department of Computer Science, COMSATS Institute of Information
Technology, Wah, Pakistan.
Received: 2 July 2015 Accepted: 30 January 2017
References
1. V Gabale, B Raman, P Dutta, S Kalyanraman, A classification framework for scheduling algorithms in wireless mesh networks. IEEE Commun. Surv. Tutorials15(1), First Quarter (2013)
2. F Akyildiz, XD Wang, WL Wang, Wireless mesh networks: a survey. Comput. Netw. ISDN Syst.47(4), 445–487 (2005)
3. F Akyildiz, X Wang, A survey on wireless mesh networks. IEEE Commun. Mag.43(9), S23–S30 (2005)
4. W Liu, H Nishiyama, N Kato, Y Shimizu, T Kumagai,A novel gateway selection method to maximize the system throughput of wireless mesh network deployed in disaster areas. IEEE 23rd International Symposium on Personal, Indoor and Mobile Radio Communications - (PIMRC, 2012
5. M Ajmal, K Mahmood, SA Madani, Efficient Routing in wireless mesh networks by enhanced AODV, inProceedings of International conference on information and emerging technologies (ICIET), 2010
6. J Tang, G Xue, W Zhang, Maximum throughput and fair bandwidth allocation in multi-channel wireless mesh networks, inProc. of IEEE INFOCOM, 2006
7. M Alicherry, R Bhatia, L Li, Joint channel assignment and routing for throughput optimization in multi-radio wireless mesh networks, inProc. of ACM MobiCom, 2005
8. XG Meng, SHY Wong, Y Yuan, S Lu, Characterizing flows in large wireless data networks, inProc. Of ACM MobiCom, 2004
9. CE Koksal, Quality-aware routing metrics in wireless mesh networks. In
Wireless Mesh Networks, Hossain E, Leung K (eds). (Springer, US, 2007), p. 227–243
10. MEM Campista, DG Passos, PM Esposito, IM Moraes, CVN de Albuquerque, DCM Saade, MG Rubinstein, LHMK Costa, OCMB Duarte, Routing metrics and protocols for wireless mesh networks. IEEE Netw.22(1), 6–12 (2008) 11. RL Haupt, SE Haupt,Practical genetic algorithms, 2nd edn. (John Wiley & Sons,
New Jersey, 2004)
12. DE Goldberg,Genetic algorithms in search, optimization and machine learning. Pearson Education Asia, 2002
13. Z Michalewicz,Genetic algorithm + data structure = evolution programs, thirdth edn. (Springer-Verlag, Berlin, 1996)
14. F Van den Bergh, AP Engelbrecht, A new locally convergent particle swarm optimizer, inProceeding of the IEEE conference on systems, man, and cybernetics, hammamet, 2002. Tunisia
15. L Zhou, X Wang, W Tu, G-M Muntean, B Geller, Distributed scheduling scheme for video streaming over multi-channel multi-radio multi-hop wireless networks. IEEE J. Selected Areas Commun. Inst. Electr. Electron. Eng. 28(3), 409–419 (2010)
16. K Mahdavi, A clustering genetic algorithm for software modularization with a multiple hill climbing approach”, inPhD thesis, Brunel University West London, 2006
17. S Parsa, O Bushehrian, A New Encoding Scheme and a Framwork to investigate Genetic Clustering Algorithms. J. Res. Pract. Inform. Technol. 37(1), 127-143 (2005)
18. AA Pirzada, R Wishart, M Portmann, J Indulska, ALARM: an adaptive load-aware routing metric for hybrid wireless mesh networks, in
Proceeding of the thirty-second australasian conference on computer science ACSC '09, vol. 91 (Australian Computer Society, Inc, Darlinghurst, Australia, 2009). Australia ©
Submit your manuscript to a
journal and benefi t from:
7Convenient online submission
7Rigorous peer review
7Immediate publication on acceptance
7Open access: articles freely available online
7High visibility within the fi eld
7Retaining the copyright to your article