© 2015, IRJET.NET- All Rights Reserved
Page 860
Interpretation of Roughness in Compound Channel Using MATLAB
k.priyadarshinee
1, L.mohanty
2M.Tech student, Civil engineering, VSSUT, Burla, Odisha, INDIA
1Asst. Prof., Civil engineering, VSSUT, Burla, Odisha, INDIA
2---***---Abstract
: “Hydraulic Resistance” is the resultant of themain channel and overbank flows, which brings in to existence by pressure drag and viscous force. Prediction of water level and flow distribution is arbitrated by it in a channel. Such resistance is ubiquitously characterized by certain parameters like Manning’s roughness coefficient (n), Chezy’s resistance factor (c) and the Darcy- Weisbach friction factor (f). Reliable results of inundation simulation rely on an accurate estimation of resistance coefficient. Test result reveals that with increasing the depth of flow roughness coefficient reduces. The manning’s n is widely used in the computation of open channel flow. The hydraulic calculation of flow in main channel and flood plain areas demand an estimation of roughness coefficients. Despite substantial research on the experimental data, computational results are also analyzed to study the variation of roughness coefficients for both straight and meandering channel. This paper investigates a consistent trend of variation of roughness manifested by MATLAB. The study is to provide intended address of discharge properly so that it can predict the flood felicitously.
Key Words: Hydraulic Resistance, roughness coefficients, manning’s n coefficient n, Chezy’s C coefficient c, Darcy-Weisbach Friction factor f.
1. INTRODUCTION
In the scientific-technical area the use of MATLAB has become an important aspect because it allows a great advantage by processing the data facilely. The instructions are interpreted by using the appropriate command. The researchers commonly employed MATLAB in their project because the functions of MATLAB are written in MATLAB language so that the source file can be accessed only by user and most important the instructions are executed without exiting the programme of an operating system. In engineering its operation can be employed intuitively to perform the graphics of curves and surfaces by coding. During the occurrence of high rainfall both natural streams and manmade drainage surface channels often overtop their banks, thereby resulting in loss of life and extensive damage in many parts of world. So the prediction of flood forecasting in both straight and curved channel is the single most important factor by determining the discharge.
Procedures outlined that the user enables evaluate systematically the factors affecting the in bank and
overbank roughness characteristics. Roughness
coefficients can be determined in cases as low to high flow condition where the flow behavior remains fairly stable in the channel, in debris flow the sediment concentration are not so great and where the stream slopes less than 0.05.As rivers flow under various complex conditions, these coefficients are influenced by many factors. Hydraulic calculation of the characteristics and magnitude of the flow in main channel and overbank areas require an evaluation of roughness characteristics. But this calculation is needful to evaluate the depth and discharge of flow. Due to the significance consequence of these parameters, it is immensely effective in the precision of hydraulic calculation and its delicate determination defines the actual channel bed condition. The determination of hydraulic factors such as depth and velocity of the flows are significant for the calculation of these coefficients. Usually in an open channel flow the manning’s, Chezy’s and Darcy-Weisbach equations are used to calculate the velocity of flow. From many analysis reveals that Darcy’s and manning’s coefficient will vary with the flood plain width and main channel width and the parameters also play a vital role in conveyance facility, lateral distribution of depth mean velocity and cross-sectional mean velocity etc. Study of this paper investigates how the different factors include the flow depth/main channel width ratios, relative depth with respect to all the roughness
coefficients. The roughness coefficients are
represented as n, c and f for manning’s, chezy’s and Darcy-weisbach equation respectively. But manning’s equation is mostly adopted by the field engineer because of its popularity. Generally the coefficients vary with the effect of channel geometry, bed material, vegetation type and density etc.
2. Theoretical background
© 2015, IRJET.NET- All Rights Reserved
Page 861
conditions, we use the equations proposed by, orManning (1891),Chezy’s, Darcy-Weisbach (1857) to compute the section mean velocity carried by a channel section proposed as
1.
2.
3.
Respectively are used in this paper study to evaluate the parameters. The general approach for the selection of a base roughness and estimating the n values for a straight, uniform and smooth channel (Chow, 1959; Cowan, 1956).
The general equation for the calculation of n value having a particular flow depth is
n = (n0+n1+n2+n3+n4) m
Where, n0 is the base value for straight uniform channels;
n1 is the additive value due to the effect of cross- section irregularity;
n2is the additive value due to variations of the channel;
n3 is the additive value due to the relative effect of obstructions;
n4 is the additive value due to the type and density of vegetation; and m represents a value for the degree of meandering used to multiply the sum of the previous values.
3. Experimental Details
The experiments are supervised by taking the help of experimental data acquired from channel facility of Hydraulics lab of civil engineering department at NIT Rourkela.The channel is fabricated usingusing 6mm thick Perspex sheet inside a tilting flume. The tilting flume is 12m long and 0.6m wide. The meandering channel model thus fabricated having wavelength L = 40cm, double amplitude 2A’= 32.3cm,12cm×12 cm main channel and flood plain width B = 45.7cm.The meandering channel is having sinuosity = 1.44.The 2nd set up constitutes a straight compound channel with all surfaces made up of Perspex sheets (same material as the meandering compound channel). The model for straight symmetrical compound channel thus fabricated has 12cm×12cm main channel and the flood plain width of 32
cm. The overalldimension of the iron flamed flume is 12
m long and 0.50 m wide and 0.5 m depth. By the time rise
method the discharge is measured using piezometer connected with rectangular volumetric tank having dimension 198.5 cm long and 190 cm wide for meandering compound channel and 169 cm long and 103
cm wide for straight compound channel.
4. Presentation and Discussion of Results
Analysis is all done by taking the two depth i.e.(i)the ratio α between main channel depth(h) and main channel width(b)(ii)Relative depth(β)=
Relative depth (β) =
4.1. Meandering channel
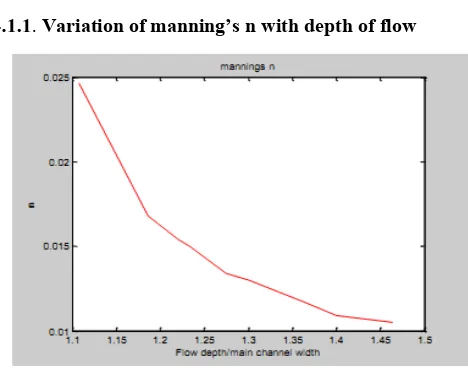
4.1.1. Variation of manning’s n with depth of flow
Figure
.1
. Variation of manning’s n with depth of flow© 2015, IRJET.NET- All Rights Reserved
Page 862
4.1.2. Variation of manning’s n with relative depth
.
Figure. 2. Variation of n with relative depth
In order to see the relation between the manning’s n with the relative depth fig.2 was plotted by the help of coding. Here it can be adhere from the figure that the variation of manning’s n is steadily decreasing and learn to be constant at higher depth of flow in the meandering channel.
4.1.3. Variation of chezy’s c with depth of flow
Figure. 3.Variation of chezy’s c with depth of flow
The experimental results for chezy’s c with depth of flow of meandering channel are plotted in fig.3.The general trend of curves are steady increase in the value of c with increase depth of flow. It can be suggested that chezy’s formula can be applicable more correctly compared with the other formulas
4.1.4. Variation of chezy’s c with relative depth
Figure.4. Variation of chezy’s c with relative depth
The variation of chezy’s c with relative depth of flow for present meandering channel exhibits a continous increase in the value of c with depth of flow.The value of c increases and tries to attain a steady state when increasing the depth.
4.1.5. Variation of friction factor f with depth of flow
Figure.5. Variation of friction factor f with depth of flow
© 2015, IRJET.NET- All Rights Reserved
Page 863
4.1.6. Variation of friction factor f with relative depth.
Figure .6 .Variation of friction factor f with depth of flow.
The behavioral trend of weisbach factor f is decreasing gradually with the increasing relative depth.The variation of roughness coefficient f with relative depth are shown in the above figure.
4.2. STRAIGHT CHANNEL
4.2.1
. Variation of manning’s n with depth of flow.
Figure.7. Variation of manning’s n with depth of flow.
It is quite similar when compared with the straight channel. It shows constant value increasing the depth in meandering but here in straight channel it is not constant.
4.2.2. Variation of manning’s n with relative depth
Figure.8. Variation of manning’s n with relative depth
The experimental results for manning’s n are plotted against the depth of flow. It is not quite similar when it compare with the meandering channel. Here it is not showing the constant variation when the depth increases but in meandering channel it shows a constant plotting.
4.2.3. Variation of chezy’s c with depth of flow
Figure.9. Variation of chezy’s c with depth of flow
© 2015, IRJET.NET- All Rights Reserved
Page 864
4.2.4. Variation of chezy’s c with relative depth.
Figure.10. Variation of chezy’s c with relative depth.
The variation of chezy’s c is not similar with the meandering channel. The behavior trend is quite complicated in meandering channel than straight channel. Chezy’s c if found increasing with increase in flow depth.
4.2.5. Variation of friction factor f with depth of flow.
Figure.11 .Variation of friction factor f with depth of flow.
Darcy- weisbach formulae can also be applicable correctly for stage-Discharge relationship with compared to manning’s formula. The variation of f gradually decreases with increase the value of depth. It is clearly seen that f is inversely proportional to depth of flow.
4.2.6
.
Variation of friction factor f with relative depthFigure.12.Variation of friction factor f with relative depth.
The variation of friction factor in terms of f is plotted with
the variation of depth of flow the above figure. It is also quite similar with the friction factor with depth of flow. The value of depth is decreasing gradually with the increasing of relative depth of flow of straight channel. It is somewhat similar with the meandering channel
ACKNOWLEDGEMENT
The authors convey their sincere gratitude to the Department of Science and Technology, Government of India, for enabling them financial support and creating the research facilities in Fluid Mechanics and Hydraulics Laboratory at National Institute of Technology, Rourkela, India.
REFERENCES
[1] Chang, H. H. (1984). ‘‘Variation of flow resistance
through curved channels’’,Journal of Hydr. Engrg.,
ASCE, 110(12), 1772–1782.
[2] Khatua, K. K. (2008) “Interaction of flow and estimation of discharge in two stage meandering compound channels”. Thesis Presented to the National Institute of Technology, Rourkela, in partial fulfillments of the requirements for the Degree of Doctor of philosophy
[3] Chow V.T., Open-Channel Hydraulic, McGraw- Hill, New York (1959)
[4] Khatua K.K., Patra K.C., Nayak P. ( 2012), “Meandering effect for evaluation of roughness
coefficients in open channel flow” Sixth
international conf. on river basin Management, WIT Transactions on Ecology and the Environment (ISSN 1743-3541),CMEM,WIT Press. 146(6):213-227 [5] Limerions, J.T. (1970). “Determination of the
Manning coefficient from measured bed roughness in natural channels”. Water-Supply Paper 1898-B,
U.S. Geological Survey, Washington, D.C.
[6] “Guide for selecting roughness coefficient"n" values for channels”. (1963). Soil Conservation Service, U.S. Dept. of Agric., Washington
BIOGRAPHIES
K.Priyadarshinee M.Tech
Research,Vssut,Burla,Odisha ,India
L.Mohanty