R E S E A R C H
Open Access
Influence of node mobility on virus
spreading behaviors in multi-hop network
Peng Li
*, Siyu Liu, Jiyu Jin and Zhisen Wang
Abstract
Multi-hop network has received growing attention recently with the widely use of wireless network communication technology. At the same time, the security of multi-hop network is facing more serve challenges. Unfortunately, classic techniques for computer virus spreading model cannot be applied to multi-hop network because of ignoring dynamic topology of network. In this paper, classic susceptible-infected (SI) model, susceptible-infected-susceptible (SIS) model and susceptible-infected-susceptible-infected-removed (SIR) model are applied to multi-hop network based on random way-point (RWP) model, and contact duration of virus is introduced. Virus spreading behaviors are examined through contact duration of virus, communication radius of node, distribution density of node, and the number of initial infected nodes. Simulation results show that node mobility has significant effect on virus
spreading behaviors. In particular, a special node speed that can lead network to appear the fastest-spreading virus phenomenon is found. The special speed is approximately equal to the ratio of communication radius of node to contact duration of virus. Distribution density of node and the number of initial infected nodes almost do not affect the special speed.
Keywords:Multi-hop network, Node mobility, Virus spreading, Contact duration of virus
1 Introduction
The widely use of mobile computing and communica-tion devices (e.g., cell phones, laptops, handheld digital devices, personal digital assistants) is driving a revolu-tionary change in our information society. Now alterna-tive ways to deliver the services are focused around wireless network [1, 2], which can make terminals con-nect to each other in the transmission range through automatic configuration. The wireless arena has been ex-periencing exponential growth in the current. Users can use their mobile phone to check e-mail and browse internet; travelers with portable computers can surf the internet in public locations; researchers can exchange in-formation by portable computers via wireless network while attending conferences. These examples of spontan-eous, wireless communication between devices might be loosely defined as multi-hop network, which allows de-vices to establish communication, anytime and anywhere, without the aid of a central infrastructure. Actually,
multi-hop network as such is not new, but the setting, usage, and players are. In the past, the notion of multi-hop net-work was often associated with communication on com-bat fields and at the site of a disaster area; now, as novel technologies such as Bluetooth materialize, the scenario of multi-hop network is likely to change, as is its importance. As wireless network continues to evolve, multi-hop net-work is expected to become more important and popular technology solution. Multi-hop network enables two or more mobile nodes to communicate using standard net-work protocols. Nodes are free to move randomly and organize themselves arbitrarily. Each node is equal, which operates not only as an end-system but also as a router. Since they can forward packets on behalf of other nodes and run user applications, they are connected via wireless links without using the existing network infrastructure or centralized administration. Each node can only communi-cate directly with other nodes, which is in the transmis-sion range. Nodes can communicate with other nodes that are not in direct transmission range by multi-hop fashion. Multi-hop network has broad application pros-pects in many fields [3] such as industry, agriculture, transportation, and military. In addition, multi-hop
* Correspondence:[email protected]
School of Information Science and Engineering, Dalian Polytechnic University, No.1 QinggongYuan, GanjingziDist, Dalian, Liaoning, People’s Republic of China
network has some concrete application in wireless Inter-net access, wireless sensor Inter-networks, and disaster relief operations. Especially, the growing popularity of multi-hop network makes it increasingly attractive to 5G. Multi-hop network will maybe become an important form of 5G in the future.
Short-range, point-to-point communications for mo-bile users enjoy increasing popularity, particularly with the rise in Bluetooth-equipped mobile devices. However, the growth of mobile networks is leading to new security challenges. Virus writers have begun exploiting lax se-curity in many mobile devices and subsequently
devel-oped virus exploiting proximity-based propagation
mechanisms. Viruses are self-replication malicious code which can propagate through network terminals without any human intervention. The multi-hop network has no centralized administration and fixed network infrastruc-ture. And nodes in multi-hop network are resource-restrained devices with low defense capabilities. At the same time, the hardware conditions of virus spreading are satisfied with the configuration improvement of in-telligent terminal. Therefore, multi-hop network be-comes attractive targets for viruses and is facing some
serious challenges [4–6]. Now, viruses are active not
only in the wired network but also in the wireless net-work. They are rapidly occupying global mobile devices. In 2000, the first mobile phone virus“VBS. TimoFonica” appeared in Spain, which sent abusive messages to users via the carrier’s internal system. The “torrent” virus was found in China in 2002 that can make the phone auto-matically shut down when user was reading message. Cabir Cell Phone Worm which was found in 2004 is really a mobile phone virus. Cabir Cell Phone Worm in-fects phones which run the Symbian operating system. It continually scans for other Bluetooth-enabled devices and tries to infect device which enters the scanning range. Cabir Cell Phone Worm is found in some coun-tries and has more than 20 variants in the current. After the emergence of Cabir Cell Phone Worm, the number of mobile phone virus appears to speed up significantly. About 1.75 Cell Phone Virus appears within a week lasted for 18 months. In 2005, MMS (Multimedia Mes-saging Service) viruses appeared which are transmitted through MMS, or other ways. MMS is a messaging protocol that allows sharing of media and programs be-tween mobile phones within minutes and across the world. Thus, an MMS virus can send a copy of itself in a short time frame to all the phone numbers found in a phone’s address book, resulting in a long-range spread-ing pattern. In 2006, the number of mobile phone vi-ruses increased by 45 % compared with its number in 2005, and the number of growth was 180. In 2010, more than one million cell phones in China were infected by
the “Zombie” virus, which can automatically send text
messages. Juniper Networks Mobile Threat Center re-leased its 2011 Mobile Threats Report in February 2012, which showed that mobile malware increased by 155 % compared with the number from the previous year. With the widely use of mobile applications, about 7.521 mil-lion mobile terminals were attacked by Trojan within a week in 2014. Virus chain of intelligent terminal has caused the loss of 1 billion yuan to users each year. At present, the diversity of virus species and the complexity of transmission ways make the frequency of security in-cidents increase in wireless mobile network.
With the increasing attention to multi-hop network, it may become one of the main targets of viruses attack in the future. Faced with attack from viruses, it is import-ant to master virus spreading behaviors in multi-hop network. It can help us to take measures to reduce the loss caused by viruses attack. Therefore, devising virus spreading models for multi-hop network is an important research area. In this paper, classic susceptible-infected (SI) model, susceptible-infected-susceptible (SIS) model, and susceptible-infected-removed (SIR) model are ap-plied to multi-hop network based on random way-point (RWP) model [7–9] to analyze virus spreading behaviors. Simulation results show a special node speed that can lead network to appear the fastest-spreading virus phenomenon is approximately equal to the ratio of communication radius of node to contact duration of virus. Distribution density of node and the number of ini-tial infected nodes almost do not affect the special speed. Simulation results of this paper are of practical value for the analysis of virus spreading and give a deeper under-standing of virus spreading behaviors in multi-hop network.
The remainder of the paper is organized as follows. Section 2 introduces the related work. Section 3 provides an introduction to mobile model and virus spreading model. Section 4 illustrates the marked difference of virus spreading behaviors that generated by our model. Especially, a special node speed that can lead network to appear the fastest-spreading virus phenomenon is found. Influence factors of virus spreading are analyzed in Section 5. Using the background discussed above, In section 6, SIS model and SIR model are applied to multi-hop network based on RWP model. Section 7 concludes this paper.
2 Related work
Multi-hop network has the characteristic of dynamic topology. Viruses can spread through short-range radio (i.e., Blue-tooth and WiFi) in multi-hop network. However, trad-itional computer virus spreading models cannot be applied in multi-hop network. Nodes move with variable velocity in [16] are provided to demonstrate the failure of computer virus spreading model in mobile environ-ments. The failure of computer virus spreading model is largely due to its strict reliance on the average connect-ivity statistic and has no conception of node speed. Computer network is homogeneous network. Node mo-bility introduces non-homogeneous connectivity distri-butions that cannot be described using a simple average. It is inappropriate for modeling virus spreading in non-homogeneous mobile networks. Spreading models for mobile networks must treat the movement of devices as a first-class concern. Recently, scholars begin to explore the modified models which are applied to model virus spreading in mobile environments. Robert G firstly used the SIS model to study worm spreading behaviors in ad hoc network [17]. He considered the impact of worm propagation delay and bandwidth constraint on its spread but ignored the impact of human actions. A SIR/ WS model [18] is proposed to describe virus spreading in wireless sensor networks. The relationship with the infection rate and immunization rate is proposed. The author in [19] focused on smart phone malware spread-ing model, in order to understand the spreadspread-ing behav-ior of smart phone malware. This paper extensively surveyed the smart phone malware spreading models based on generic epidemic models. A modified SIS epi-demic model is proposed to study the dynamics of virus spread in wireless sensor networks in [20]. And the model can be applied to different types of networks such as wireless networks, computer networks, and social net-works. Dynamics of worm spreading in the Bluetooth environment is studied in [21], and it also shows the possibility of large-scale worm outbreaks by experi-ment. Xia Wei built SIS model of smart phone virus and discussed the influence of node mobility to virus spreading [22]; unfortunately, specific mobile model was not pointed out. Node mobility is considered in [23, 24], but mobile devices are attacked by virus from fleeting in-contact wireless devices with short-distance communication range. However, some existent re-searches do not go far enough. Most models depend
al-most entirely on the technology of differential
equations and fail to take into account the conditions of virus spreading (e.g., ignoring dynamic topology of nodes or contact duration of virus). Virus spreading be-haviors in multi-hop network have to be carefully consid-ered through reliable models, although it is complex and challenging to establish practical and appropriate models on virus spreading dynamics. Xu et al. [25–27] proposed a
framework processing mobile social media data based on crowdsensing method.
3 Mobile model and virus spreading model
Virus spreading can be regarded as certain actions that obey some spreading rules of networks. A reasonable mobile model can provide us with a more clear recogni-tion to virus spreading behaviors. Mobile models are characterized by the movement of their constituents.
The nature of movement—its speed, direction, and rate
of change—can have a dramatic effect on protocols and
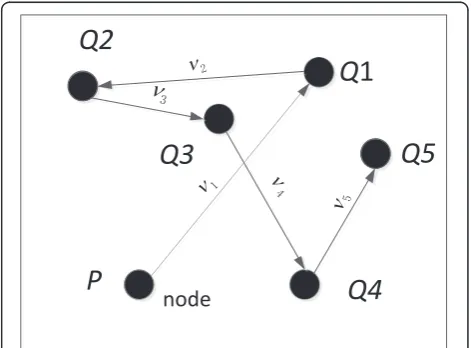
systems designed to support mobility. Mobile models in simulation-based studies are important building blocks. It is designed to describe how their velocity and location change over time. These models that model multi-hop network are categorized as Random Mobility Model and Group Mobility Model. At present, the most widely used mobile model is the RWP model, which was originally proposed for studying the performance of ad hoc routing protocols by Johnson and Maltz [28]. This mobile model is a simple and straightforward stochastic model of multi-hop network. It can describe the movement be-havior of node in multi-hop network. Every node in RWP model is described by three parameters: current location, speed, and pause time. The RWP model oper-ates in this paper as follows: In the model, nodes travel
within a square area. The total number of nodes isNin
the area. Each node independently picks up a random destination. Node travels the destination on a straight
line at the chosen speed v. The node may also remain
stationary for a random pause time before starting its movement towards the next destination. And then node picks another random destination and move speed. Each node will repeat the process until the end of simulation. The diagram of RWP mobility model is shown in Fig. 1. A paper by Perkins, Hughes, and Owen [29] shows that
node speed, pause time, network size, and the number of sources can affect the performance of routing proto-cols. Node speed is shown to be a significant factor, while pause time is not. Thus, it can be set to 0 s in order to study smoothly. As simulated time progressed, more nodes move across the center of simulation region [30, 31]. And RWP model does not have a steady state with different node speed; thus, the mobility scenario poses different connectivity properties.
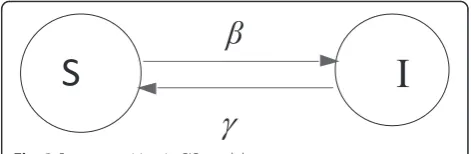
For the virus spreading models, we focus on the most popular models, the SI model, SIS model, and SIS model. In this paper, the main research object is SI model, which is the basis of SIS model and SIR model. In SI model, nodes are divided into two statuses: susceptible (S) and in-fected (I). The susceptible nodes are attacked by viruses, and initially, only a small number of nodes are infected. The virus spreads itself to its neighbor nodes by continu-ously communicating during a given stretch of time. Then susceptible node will become infected node with infection rateβ. The infected neighbor nodes repeat the process to their respective neighbor nodes, until all nodes become in-fected nodes. Inin-fected node cannot be recovered from virus. It is only capable of spreading virus to susceptible nodes. The status transition of SI model can be seen from Fig. 2. The SIS epidemic model resembles a flu-like virus, where nodes have no immunity. In SIS model, nodes are also divided into two statuses: susceptible (S) and infected (I). Two parameters in SIS model are also referred to as the birth rate (β) and death rate (γ) of the virus. Different from SIS model, the infected node can recover from virus to become a susceptible node with a recovery probability
γ, and this susceptible node will probably be infected
again. Status of every node will repeat the process until the end of simulation. The status transition of SIS model can be seen from Fig. 3. In SIR model, nodes are divided into three statuses: susceptible (S), infected (I), and re-moved (R). Susceptible node can become rere-moved node
with an immune probability δ; infected node can be
be-come removed node with an immune probability μ, too.
Once a node becomes a removed node, it will not be in-fected again. The status transition of SIR model can be seen from Fig. 4. In addition, the Table 1 shows the defini-tions of various symbols in this paper.
In this paper, MATLAB software is used to study virus spreading characteristics in multi-hop network. Where
the unit time of node moving is 1 s (i.e., dt = 1 s), total simulation time is 400 s (i.e.,T= 400 s). Each node can automatically communicate with adjacent nodes though wireless networks. In this paper, all simulation experi-ments are carried out on the basis of the above condi-tions. Note that every simulation result represents the average of 100 times.
4 Different virus spreading behaviors
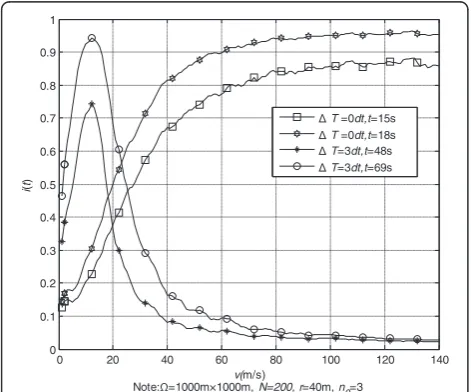
The dynamic topology of multi-hop network is its im-portant feature. It is of great significance to explore the relationship between virus spreading behaviors and node speed, which can help us to master virus control strat-egies. The value of node speed determines the fluctu-ation degree of multi-hop network topology and also influences virus spreading behaviors. Figure 5 explores virus spreading behaviors in the multi-hop network
based on RWP model by using the SI model. IfΔT= 0 s,
virus spreading is from fleeting in-contact wireless de-vices with short-distance communication range. Suscep-tible node will become infected node with infection rate
β, when susceptible node is in communication range of
infected node. The i(t) increases to a steady value with the increasing v. This is because nodes in netfast
(net-work in which nodes move quickly) are “better mixed”
than nodes in netslow (network in which nodes move
slowly). The faster node velocity speeds up the changes of neighbor nodes. Infected nodes will have more oppor-tunities to communicate with susceptible nodes, and then virus transmission is speeded up. When node speed increases to a certain value, frequent change of neighbor nodes cannot speed up virus spreading. By then, the spatial distribution of infected nodes and susceptible nodes determines virus spread behaviors. In a word, node mobility plays an important role in virus spreading. In fact, virus spreading needs a period of time. There-fore, instantaneous state transitions cannot model virus
Fig. 2Status transition in SI model
Fig. 3Status transition in SIS model
spreading perfectly. Simulation result in Fig. 5 shows that
i(t)-v curve has a peak point for the influence of ΔT. It demonstrates contact duration of virus which plays an im-portant role to virus spreading in multi-hop networks. An intuitive explanation for this phenomenon is as follow. Connectivity between nodes is enhanced with the increase of node speed, so viral spreading speed increases. And as node speed continues to increase, the time that suscep-tible node stays in coverage area of infected node is too short, so that virus cannot finish propagation. Figure 6 shows that three differential curves are almost coincident. It suggests that the variation trend of curve does not change with time. The peak is also same at different time. It corresponds to a special node speed. This speed can lead network to appear the fastest-spreading virus phenomenon. It is calledvfsin this paper.
Consider that infection probability β, recovery prob-ability γ, and immune probability μor δ can only affect the value of s(t),i(t), and r(t) at any moment, while the
value of vfs cannot be changed according to the change
of these probability. Therefore, we assume they are con-stant with appropriate generality. In addition, the MAC (Medium Access Control) protocol used by WiFi-based wireless devices follows the IEEE 802.11 standard, which specifies a set of rules that enable nearby devices to co-ordinate their transmissions in a distributed manner. The MAC is a highly complex protocol. It can control nodes to enter the channel in sequence; thus, MAC can affect the value ofi(t) at any moment, and not the value ofvfs.
5 Analysis of influence factors
In order to analyze influence factors to vfs, several im-portant parameters are investigated. They are contact duration of virus, communication radius of node, the number of initial infected nodes, and the distribution density of node. Then analyzing different properties of this model with change of parameters; discussing the
re-lation between vfs and these parameters. These studies
have greatly contributed to our understanding of the
Table 1Symbol definition
Symbol Instructions Symbol Instructions
Ω Moving space of node (square area) ρ Distribution density of node
v Node speed r(t) The rate of removed nodes at timet
r Communication radius of node T Total simulation time
dt The unit time of node moving n0 The number of initial infected nodes
N The total number of nodes ΔT Contact duration of virus
I(t) The number of infected nodes at timet i(t) The rate of infected nodes at timet S(t) The number of susceptible nodes at timet s(t) The rate of susceptible nodes at timet
γ Recovery probability (I→S) β Infection probability (S→I)
μ Immune probability (I→R) δ Immune probability (S→R)
0 20 40 60 80 100 120 140
0 0.1 0.2 0.3 0.4 0.5 0.6 0.7 0.8 0.9 1
v(m/s)
Note: =1000m×1000m,N=200, r=40m, n0=3
i(
t)
T =0dt,t=15s T =0dt,t=18s T=3dt,t=48s T=3dt,t=69s
Fig. 5Different virus spreading behaviors
0 20 40 60 80 100 120 140
-0.2 0 0.2 0.4 0.6 0.8
v
Note =1000m×1000m,N=200, r=40m, n0=3, T=3dt
i(
t)
t=30s t=48s t=69s
influence of every factor on virus spreading behaviors. What is more, there is a very important research value to analyze the influence factors, which can help to take corresponding strategies to control virus spreading and improve the security of multi-hop network.
5.1 Contact duration of virus
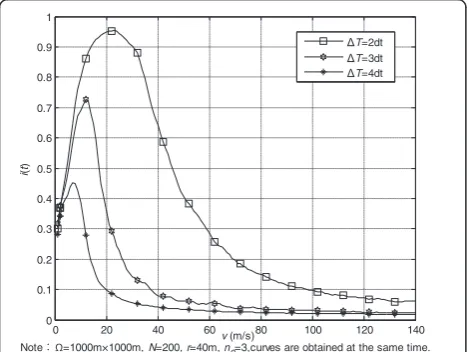
In general, contact duration of virus is often ignored in order to simplify the virus spreading model. However, contact duration of virus has important impact to virus spreading. Figure 7 shows the relation betweenvandi(t) with different ΔT. It can be seen from Fig. 7, i(t)
de-creases with the increasing ΔT. Reasons for this
phenomenon are as follows: the increase ofΔT extends
the time of finishing virus transmission; on the other hand, enough contact time between nodes cannot be guaranteed with the increasingΔT. Therefore, the prob-ability of finishing virus transmission is reduced and
then leads to the decrease of i(t). At the same time,
simulation result shows as follows: (1)vfsdecreases with the increasing ΔT, (2) when v<vfs, i(t)-v curve rises slowly if ΔTis greater, and when v>vfs, i(t)-vcurve
de-cays rapidly if ΔT is greater. Virus spreading needs to
meet the requirements of connectivity and ΔT. The
in-crease of v can improve connectivity but increase the
difficulty of meetingΔT. Therefore, when other parame-ters are constant, there is the phenomenon: the greater ΔT, the lower vfs. Whenv<vfs(i.e., enough contact time between nodes can be guaranteed.), connectivity of multi-hop network can be effectively improved with the
increasing v. Improvement of connectivity makes virus
spread rapidly. And the improvement is more obvious if ΔT is smaller, so i(t)-v curve rises rapidly. Whenv>vfs (i.e., enough contact time between nodes cannot be guaranteed.), contact time between nodes becomes short. Reduction of contact time makes virus spread
slowly. Especially for the greater ΔT, this influence is more obvious, and theni(t)-vcurve decays rapidly. 5.2 Communication radius of node
Communication radius of node is a very important fac-tor whether in the network connectivity or virus spread-ing. Figure 8 shows the relation betweenvand i(t) with differentr.It can be seen from Fig. 8,i(t) increases with
the increasing r. Reasons for this phenomenon are as
follows: on the one hand, the increase ofrexpands
com-munication range; on the other hand, more contact time
between nodes can be provided with the increasing rin
multi-hop network. Therefore, the probability of finish-ing virus transmission is improved and then leads to the
increase of i(t). At the same time, simulation result
shows as follows:(1) vfs increases with the increasing r; (2) when v<vfs, i(t)-v curve rises rapidly if ris greater; whenv>vfs,i(t)-vcurve decays slowly ifris greater. Ac-cording to theoretical analysis,r has the opposite effect
on virus spreading compared with ΔT. The increase of
ΔT increases the difficulty of finishing virus
transmis-sion. On the contrary, the increase ofrcan expand
com-munication range of node and increase contact time. Therefore, when other parameters are constant, there is the phenomenon: the greater r, the higher vfs; i(t)-v curve rises rapidly and decays slowly with the increase ofr.
5.3 The number of initial infected nodes
Figure 9 shows the relation betweenvand i(t) with dif-ferent n0. It can be seen from Fig. 9, i(t) increases with
the increasing n0. The reason for this phenomenon is
that infected nodes have more chances to communicate with susceptible nodes with the increasingn0. Therefore, the probability of finishing virus transmission is im-proved and then leads to the increase ofi(t). At the same
Note =1000m×1000m,N=200, r=40m, n0=3,curves are obtained at the same time.
i(
Note: =1000m×1000m, N=200, n0=3, T=3dt, curves are obtained at the same time.
i(
t)
r=30m r=40m r=50m
time, it is shown that (1) n0almost does not affect vfs; (2) whenv<vfs, i(t)-vcurve rises rapidly ifn0is greater; and when v>vfs, i(t)-v curve decays slowly if n0 is
greater. This is because n0 cannot affect connectivity
and ΔT. In fact, n0can be seen as a part of I(t) (i(t) =
I(t)/N). Therefore, n0 affects only the value of i(t), and not the value of vfs. The increase of n0can significantly boost virus transmission. And this improvement is more obvious with the increase ofn0, soi(t)-vcurve rises rap-idly and decays slowly.
5.4 Distribution density of node
Figures 10 and 11 show the relation between vandi(t) with same or differentρ. It can be seen from Fig. 10,i(t) is different although the same ρ. This is because almost the same number of susceptible nodes is infected during
a unit time in different scenarios with the same ρ.
Therefore, the total number of infected nodes is the
same at every moment in different scenarios. WhenNis
greater, i(t) (i(t) =S(t)/N) is smaller. It can also be seen from Fig. 11, i(t) increases with the increasingρ. Reason for this phenomenon is that connectivity is enhanced
due to the increase of ρ, so that there are more
oppor-tunities to communication between susceptible nodes and infected nodes. Therefore, the probability of finish-ing virus transmission is improved. At the same time,
Figs. 10 and 11 show that with or without change of ρ
almost does not affectvfs. Virus spreading needs to meet the requirements of connectivity and ΔT. Although
dif-ferent ρ changes connectivity, such the change on
con-nectivity is for network under all speeds. In fact, ρ can
indirectly represent the total number of nodesNbecause
of i(t) =I(t)/N and ρ≈(N/Ω). Therefore, ρ affects only the value ofi(t), and not the value ofvfs.
5.5 Relation betweenvfsand two parameters:
communication radius of node and contact duration of virus
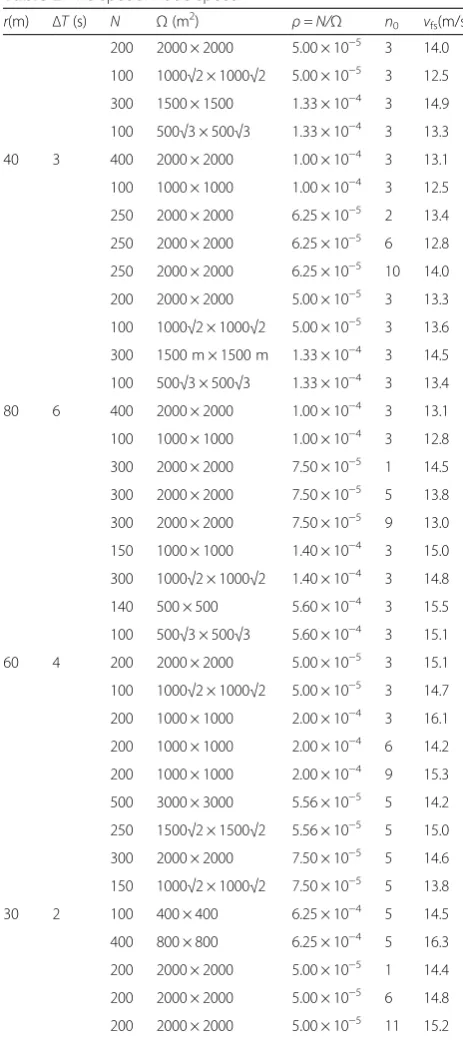
Fundamentally,vfsvaries mainly depending onrand ΔT. Where σ2 is the variance, it represents the fluctuations on the value of vfs around r/ΔT. According to Table 2, when (r, ΔT) is (40 m, 3 s), (80 m, 6 s), (60 m, 4 s), and (30 m, 2 s), the values of variance are as follows: σ21= 0.56, σ22= 0.34, σ23= 0.25, σ24= 0.45. If rand ΔTare con-stant, the conclusion can be obtained that vfs is almost
the same although ρand n0in constant change. In fact,
the value of vfsalmost does not change as long as r/ΔT
is a constant value (as shown in Table 2, (r, ΔT) is
(40 m, 3 s) or (80 m, 6 s); (r,ΔT) is (60 m, 4 s) or (30 m, 2 s)). Such as,r/ΔT= 40 m/3 s or 80 m/6 s, the variance
is 0.46; r/ΔT= 60 m/4 s or 30 m/2 s, the variance is
0.38. It is noted that the value of vfs is strongly
0 20 40 60 80 100 120 140
Note =1000m×1000m, N=200, T=3dt, r=40m, curves are obtained at the same time.
i(
Note r=40m, T=3dt, n0=3, curves are obtained at the same time.
i(
Note r=40m, T=3dt, n0=3, curves are obtained at the same time.
i(
t)
N=100, =1000m*1000m N=200, =1500m*1500m N=400, =1000sqrt(2)m*1000sqrt(2)m
dependent on the value ofr/ΔTaccording to the analysis of above conclusions. Besides, according to the above simulations, the phenomenon can be found as follows: if
v≤vfs, i(t) increases as v→r/ΔT; if v≥vfs,i(t) decreases to zero as v→∞. Therefore, a series of prevention-cure strategies of virus are drawn: (1) whenv<vfs, considering decreasing node speed to control virus spreading; (2) the
number of mobile nodes with the velocity vfs should be
reduced as much as possible, and (3) whenv≥vfs, consid-ering increasing node speed to control virus spreading.
6 Virus spreading behaviors in sis model and sir model
In the above sections, classic SI model is applied to multi-hop network based on RWP model to analyze virus spreading behaviors. It is demonstrated thatvfsis approxi-mately equal to the ratio of communication radius of the node to contact duration of virus. Distribution density of node and the number of initial infected nodes almost does not affect vfs. Is there this phenomenon in SIS model or SIR model? Using the background discussed above, this section simply discusses SIS model, and SIR model is ap-plied to multi-hop network based on RWP model. Table 3 shows the values of various symbols which are in SIS model and SIR model.
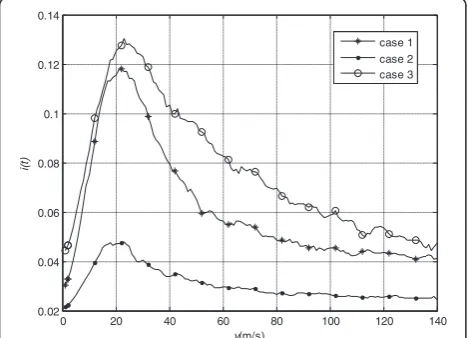
In Fig. 12, virus spreading behaviors are also examined through parameters contact duration of virus, communi-cation radius of node, distribution density of node, and the number of initial infected nodes. According to the simulation result in Fig. 12, SIS model has also this phenomenon:i(t) increases to a steady value with the in-creasing v, and theni(t) decreases to zero with the
con-tinuously increasing v. Note that cures are obtained at
the same time. According to cases 1, 2, and 3, simulation results show thatvfsis also approximately equal tor/ΔT, although there are changes in contact duration of virus, communication radius of node, distribution density of node, and the number of initial infected nodes. In addition,i(t) increases with the increasingraccording to the comparison between case 3 and case 4;i(t) decreases
with the increasingΔTaccording to the comparison
be-tween case 3 and case 5. In a word, SIS model and SI model show similar virus spreading behavior in multi-hop network. Compared with SI model and SIS model, status transition of node in SIR model is relatively com-plicated. Actually, there is basically the same virus spreading behaviors according to Fig. 13.
Table 2The special node speed
r(m) ΔT(s) N Ω(m2) ρ= N/Ω n0 vfs(m/s) 200 2000 × 2000 5.00 × 10⁻⁵ 3 14.0
100 1000√2 × 1000√2 5.00 × 10⁻⁵ 3 12.5 300 1500 × 1500 1.33 × 10⁻⁴ 3 14.9
100 500√3 × 500√3 1.33 × 10⁻⁴ 3 13.3 40 3 400 2000 × 2000 1.00 × 10⁻⁴ 3 13.1
100 1000 × 1000 1.00 × 10⁻⁴ 3 12.5
250 2000 × 2000 6.25 × 10⁻⁵ 2 13.4
250 2000 × 2000 6.25 × 10⁻⁵ 6 12.8
250 2000 × 2000 6.25 × 10⁻⁵ 10 14.0
200 2000 × 2000 5.00 × 10⁻⁵ 3 13.3
100 1000√2 × 1000√2 5.00 × 10⁻⁵ 3 13.6 300 1500 m × 1500 m 1.33 × 10⁻⁴ 3 14.5
100 500√3 × 500√3 1.33 × 10⁻⁴ 3 13.4 80 6 400 2000 × 2000 1.00 × 10⁻⁴ 3 13.1
100 1000 × 1000 1.00 × 10⁻⁴ 3 12.8
300 2000 × 2000 7.50 × 10⁻⁵ 1 14.5
300 2000 × 2000 7.50 × 10⁻⁵ 5 13.8
300 2000 × 2000 7.50 × 10⁻⁵ 9 13.0
150 1000 × 1000 1.40 × 10⁻⁴ 3 15.0
300 1000√2 × 1000√2 1.40 × 10⁻⁴ 3 14.8 140 500 × 500 5.60 × 10⁻⁴ 3 15.5
100 500√3 × 500√3 5.60 × 10⁻⁴ 3 15.1 60 4 200 2000 × 2000 5.00 × 10⁻⁵ 3 15.1
100 1000√2 × 1000√2 5.00 × 10⁻⁵ 3 14.7 200 1000 × 1000 2.00 × 10⁻⁴ 3 16.1
200 1000 × 1000 2.00 × 10⁻⁴ 6 14.2
200 1000 × 1000 2.00 × 10⁻⁴ 9 15.3
500 3000 × 3000 5.56 × 10⁻⁵ 5 14.2
250 1500√2 × 1500√2 5.56 × 10⁻⁵ 5 15.0 300 2000 × 2000 7.50 × 10⁻⁵ 5 14.6
150 1000√2 × 1000√2 7.50 × 10⁻⁵ 5 13.8 30 2 100 400 × 400 6.25 × 10⁻⁴ 5 14.5
400 800 × 800 6.25 × 10⁻⁴ 5 16.3
200 2000 × 2000 5.00 × 10⁻⁵ 1 14.4
200 2000 × 2000 5.00 × 10⁻⁵ 6 14.8
200 2000 × 2000 5.00 × 10⁻⁵ 11 15.2
Table 3Simulation parameters
Model Case Ω/m2 N n
0 r/m ΔT
1 1000 × 1000 200 6 40 2dt
2 1500 × 1500 300 10 60 3dt
SIS 3 1000 × 1000 200 3 80 4dt
4 1000 × 1000 200 3 60 4dt
5 1000 × 1000 200 3 80 3dt
1 1000 × 1000 200 3 80 4dt
SIR 2 2000 × 2000 300 6 60 3dt
7 Conclusions
Traditional epidemiological models fail to capture the unique topological properties of mobile networks. Node mobility introduces non-homogeneous connectivity dis-tributions that cannot be represented using a simple average. Virus spreading model that ignores contact dur-ation of virus fails to capture the unique virus spread properties of multi-hop network. Virus spreading behav-iors here is obviously different compared with virus spreading behaviors with instantaneous state transitions. An important result from the model in this paper is that virus spreading speed increases first and then decreases with the increase of node speed. The special node speed, which can lead the network appear the fastest-spreading virus phenomenon, is approximately equal to the ratio of communication radius of node to contact duration of virus. The special speed almost has no relation with dis-tribution density of node and the number of initial in-fected nodes. An understanding of virus spreading
characteristics on multi-hop network is of great
importance for the design of effective detection and pre-vention strategies for similar networks. So that people can minimize or prevent the risk of virus spreading. It will be the focus of future research to explore the dy-namic expression of virus spreading in multi-hop net-work based on RWP model. Besides, there are several important areas for future work, such as finding analyt-ical derivations for the mixing rate and the connectivity fluctuation parameter. However, the research of this paper already offers useful and interesting insights into virus spreading in multi-hop network. It will have great significance for the future research.
Acknowledgements
This paper is supported by Natural Science Foundation of Liaoning, China (2015020031), Science and Technology Project of Dalian, China
(2015A11GX011), and Science Public-funded Project of Liaoning Science and Technology Department of China (2015003012).
Authors’information
Peng Li received his PhD degree in Information and Communication Engineering from the Harbin Institute of Technology, China, in 2009. He is currently an associate professor at the School of Information Science and Engineering, Dalian Polytechnic University, China. His research interests include multi-hop networks and optical communication systems. Siyu Liu received her B.S. degree from Dalian Polytechnic University in 2015. She is currently a M.S. candidate in Dalian Polytechnic University. Her main research interests include multi-hop networks.
Jiyu Jin received his PhD degree in Information and Communication Engineering from Yeungnam University, Gyeongsan, Republic of Korea, in 2007. From 2007 to 2008, he was a post-doctoral researcher at the School of Electrical Engineering and Computer Science, Seoul National University, Republic of Korea. From 2008 to 2009, he was an assistant professor of Information and Communication Engineering at Yeungnam University. He joined the Hilandwe Communication Technology Co., Ltd., Dalian, Liaoning Province, China, as a technical director in 2010. He is currently an associate professor at the School of Information Science and Engineering, Dalian Polytechnic University, China. His research interests include wireless/mobile communication systems and Internet of things.
Zhisen Wang received his PhD degree in Electrical and Communication Engineering from Tohoku University, Japan, in 2007. He is currently a professor at the School of Information Science and Engineering, Dalian Polytechnic University, China. His research interests include wireless communication systems and Internet of things.
Received: 13 March 2016 Accepted: 5 July 2016
References
1. D Agrawal, QA Zeng, D Agrawal, QA Zeng,Introduction to wireless and mobile systems. Cengage learning, 2015
2. Ad hoc wireless networking. Springer Science & Business Media, 2013. 3. SA Hamid, HS Hassanein, G Takahara, Introduction to wireless multi-hop
networks, inRouting for wireless multi-hop networks(Springer, New York, 2013), pp. 1–9
4. OK Sahingoz, Networking models in flying Ad-hoc networks (FANETs): concepts and challenges. Intell Rob Syst74(1–2), 513–527 (2014) 5. Lundberg J, Routing security in ad hoc networks. IEEE Commun Mag
2,329-354 (2000)
6. I Chlamtac, M Conti, JJN Liu, Mobile ad hoc networking: imperatives and challenges. Ad Hoc Netw1(1), 13–64 (2003)
7. C Bettstetter, H Hartenstein, X Pérez-Costa, Stochastic properties of the random waypoint mobility model. Wirel Netw10(5), 555–567 (2004) 8. D Mitsche, G Resta, P Santi, The random waypoint mobility model with
uniform node spatial distribution. Wirel Netw20(5), 1053–1066 (2014) 9. P Garg, CK Nagpal, S Bansal, Impact of random waypoint mobility model on
hybrid routing protocols of scalable mobile Ad Hoc network. Int J Innov Res Dev2(10), 121–125 (2013)
Fig. 12Relation betweenvandi(t) with different conditions in SIS model
0 20 40 60 80 100 120 140
10. V Karyotis, A Kakalis, S Papavassiliou, Malware—propagative mobile ad hoc networks: asymptotic behavior analysis. J Comput Sci Technol 23(3), 389–399 (2008)
11. JW Mickens, BD Noble, Analytical models for epidemics in mobile networks, inWireless and mobile computing, networking and
communications, 2007. WiMOB 2007(Third IEEE International Conference on. IEEE, New York, 2007), p. 77
12. NC Valler, BA Prakash, H Tong et al., Epidemic spread in mobile ad hoc networks: determining the tipping point, inNetworking(Springer, Berlin Heidelberg, 2011)
13. N Perra, B Gonçalves, Modeling and predicting human infectious diseases, inSocial phenomena, 2015, pp. 59–83
14. J Ren, X Yang, LX Yang et al., A delayed computer virus propagation model and its dynamics. Chaos, Solitons Fractals45(1), 74–79 (2012)
15. Q Zhu, X Yang, J Ren, Modeling and analysis of the spread of computer virus. Commun Nonlinear Sci Numer Simul17(12), 5117–5124 (2012) 16. JW Mickens, BD Noble, Modeling epidemic spreading in mobile
environments, inProceedings of the 4th ACM workshop on Wireless security. ACM, 2005, pp. 77–86
17. JO Kephart, DM Chess, SR White, Computers and epidemiology. IEEE Spectr 30(5), 20–26 (1993)
18. S Fu, CG Wang, JF Ma, Malware propagation model in wireless sensor network. Comput Eng37(3), 129–131 (2011)
19. S Peng, S Yu, A Yang, Smartphone malware and its propagation modeling: a survey. IEEE Commun Surv Tutorials16(2), 925–941 (2014)
20. S Tang, D Myers, J Yuan, Modified SIS epidemic model for analysis of virus spread in wireless sensor networks. Int J Wirel Mob Comput6(2), 99–108 (2013)
21. J Su, KKW Chan, AG Miklas et al., A preliminary investigation of worm infections in a bluetooth environment, inProceedings of the 4th ACM workshop on recurring malcode(ACM, Alexandria, 2006), pp. 9–16 22. X Wei, L Zhao-Hui, C Zeng-Qiang et al., The influence of smart phone’s
mobility on bluetooth worm propagation, in2007 International Conference on Wireless Communications, Networking and Mobile Computing, 2007, pp. 2218–2221
23. P Li, Z Wang, X Tan, Characteristic analysis of virus spreading in ad hoc networks, inComputational intelligence and security workshops, 2007. CISW 2007. International Conference on. IEEE, 2007, pp. 538–541
24. CJ Rhodes, M Nekovee, The opportunistic transmission of wireless worms between mobile devices. Physica A: Stat Mechanic App387(27), 6837–6844 (2008)
25. Z Xu et al., Crowdsourcing based description of urban emergency events using social media big data. IEEE Trans Cloud Comp (2016). doi:10.1109/ TCC.2016.2517638
26. Z Xu et al., Crowdsourcing based social media data analysis of urban emergency events. Multimed Tools Appl (2015). doi:10.1007/s11042-015-2731-1
27. Z Xu et al., Participatory sensing based semantic and spatial analysis of urban emergency events using mobile social media. EURASIP J Wirel Commun Netw44, 2016 (2016)
28. DB Johnson, DA Maltz, Dynamic source routing in ad hoc wireless networks, inMobile computing(Springer, New York, 1996), pp. 153–181
29. DD Perkins, HD Hughes, CB Owen, Factors affecting the performance of ad hoc networks. IEEE Int Conf Comm4, 2048–2052 (2002)
30. C Bettstetter, G Resta, P Santi, The node distribution of the random waypoint mobility model for wireless ad hoc networks. IEEE Trans Mob Comput2(3), 257–269 (2003)
31. T Chu, I Nikolaidis, On the artifacts of random waypoint simulations, in
Proceedings of the 1st International Workshop on Wired/Wireless Internet Communications (WWIC2002), in conjunctions with the International Conference On Internet Computing (IC’02), 2002, pp. 69–76
Submit your manuscript to a
journal and benefi t from:
7 Convenient online submission
7 Rigorous peer review
7 Immediate publication on acceptance
7 Open access: articles freely available online
7 High visibility within the fi eld
7 Retaining the copyright to your article