IN VITRO IN VIVO CORRELATION OF DEXTROMETHORPHAN HYDROBROMIDE MODIFIED
RELEASE TABLETS: AN INTERNAL VALIDATION EVALUATION
RAMESH N
1*, SOCORRINA COLACO
2, RAMAKRISHNA SHABARAYA
1, SEKAR RAJAN
3*,
SUBRAMANIA NAINAR MEYYANATHAN
31Department of Pharmaceutics, Srinivas College of Pharmacy, Mangalore - 574 143, Karnataka, India. 2Department of Pharmacology, Srinivas Institute of Medical Sciences & Research Centre, Mangalore - 575021, Karnataka, India. 3Department of Pharmaceutical Analysis,
J.S.S. College of Pharmacy, Rocklands, Ooty - 643 001, Tamil Nadu, India. Email: [email protected]
Received: 09 March 2015, Revised and Accepted: 30 March 2015
ABSTRACT
Objectives: The purpose of this study was to develop and validate in vitro and in vivo correlation (IVIVC) for newly developed dextromethorphan hydrobromide sustained-release (SR).
Methods: During the development of a once-daily SR tablet of dextromethorphan hydrobromide, an extrapolative in vitro drug release method was designed and statistically evaluated using three formulations with varying release rates. The similarity factor (f2) was used to analyze the dissolution
data. Three-way crossover study design was conducted in six healthy human subjects under fasting condition.
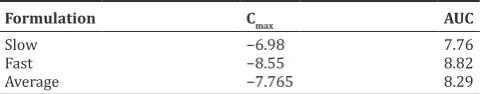
Result: The formulations were evaluated by using area under the plasma concentration-time curve, (AUC0-∞), time to reach peak plasma concentration, Tmax, and peak plasma concentration Cmax, while correlation was determined between in-vitro release and in-vivo absorption. A linear correlation was observed between the absorption and dissolution profiles of the drug. The prediction error (%) was determined to check how well a given model can accurately predict a pharmacokinetic parameter of the drug. The predicted Cmax and AUC found to be −6.98 and −8.55 and for AUC was 7.76 and 8.82% respectively.
Conclusion: In conclusion, a Level A IVIVC explaining the complete time-course of plasma concentrations was developed and validated, internally for developed dextromethorphan hydrobromide SR formulations.
Keywords: Dextromethorphan hydrobromide, Dissolution, Bioavailability, Sustained-release, In vitro and in vivo correlation.
INTRODUCTION
The United States Food and Drug Administration (FDA) recommended that formulations with three or more release rates shall be essential to develop in vitro and in vivo correlation (IVIVC). Estimation of the model’s capability to illustrate data is referred to as internal validation. The model should be competent to predict the area under the plasma concentration curve (AUC) and the peak plasma concentration (Cmax) to within limits as set by the FDA [1].
IVIVC, particularly for solid oral dosage forms, has be en developed to presume drug bioavailability from in vitro dissolution. IVIVC can be used to set dissolution specifications; and as a surrogate for bioequivalence in case of any modification with respect to formulation, process, or manufacturing site.
Dextromethorphan hydrobromide is a synthetic antitussive compound used with an antihistamine in the treatment of cough. Dextromethorphan suppresses cough by central action on the cough center in the medulla. The drug usually administered 3-4 times a day due its short half-life [2]. A sustained-release (SR) formulation can guide to the decline in number of doses administered, less probability of an overdose, and especially good to treat asthma patient’s night time cough [3]. No IVIVC work was carried out for dextromethorphan hydrobromide. Numerous literature were utilized as guidance for developing and validating IVIVC for the selected drugs [4-18].
The objective in this study was to develop and validate an IVIVC for newly developed dextromethorphan SR tablet. Further SR dosage units from each formulation are administered in healthy human subjects under the fasting condition, as crossover design pattern, and plasma
drug concentrations are measured by using the validated analytical method. In vitro and in vivo studies were performed and data were used for IVIVC.
METHODS Dissolution studies
The dissolution characteristics were test and reference formulations of dextromethorphan hydrobromide studied using a Type II paddle apparatus based on a method described in the USP (XXIII dissolution apparatus). The dissolution medium was 900 ml in volume and experiments were performed at different pH 1.2, 4.5, 5.5, 6.8 and 7.2 buffers maintained at 37.0±0.5°C at 50 and 75 rpm. 5 ml of samples were withdrawn were withdrawn at 0.5, 1.0, 1.5, 2.0, 2.5, 3.0, 4.0, 6.0, 8.0, 12.0, 18.0 and 24.0 hrs. Samples were filtered through a 0.45 mm membrane filter and analyzed by using high-performance liquid chromatography (HPLC) at a wavelength of 280 nm. All the experiments were carried out using six tablets for dextromethorphan SR newly developed formulation i.e. slow, fast release (test) and immediate release tablet (reference).
Human pharmacokinetic study
Asian J Pharm Clin Res, Vol 8, Issue 4, 2015, 79-86 Ramesh et al.
release and the immediate release formulation (reference) product were administered as per the randomization schedule. Blood samples were collected at 0, 0.5, 1.0, 1.5, 2.0, 2.5, 3.0, 4.0, 6.0, 8.0, 12.0, 18.0 and 24.0 hrs. Blood samples were centrifuged at 3500 rpm and stored at 30°C until assay. The calibration curve was 110.00-3000.00 ng/mL. Acceptable intra-day and inter-day precision (<15%) and accuracy (<10% difference) were observed. The percentage recovery of the analyte was 97.43%. The samples were analyzed by using validated HPLC method.
RESULTS AND DISCUSSION In vitro dissolution data analysis
The dissolution profiles were estimated by plotting the cumulative percent drug dissolved at various time points. The dissolution were compared using the similarity factor (f2) presented in the equation,
f log n Rt Tt reference product and the test product, respectively. Using the f2 values, dissolution profiles were determined the dissimilarity.
Dissolution tests were performed at pH 1.2 buffer, pH 4.5, pH 5.5, buffer and pH 6.8 at 50 and 75 rpm, the release was identical for the slow and fast formulations. The f2 value for pH 1.2 buffer, pH 4.5, pH 5.5, buffer and pH 6.8 at 50 rpm was 60.61,42.06, 60.72 and 48.79,
respectively, but at 75 rpm, the f2 value was 61.49, 59.62, 43.64 and 52.02, respectively. The higher f2 values (more than 50) authenticate that the two dissolution profiles are indistinguishable and therefore not considered further for the study. At pH 7.4 buffer and 50 rpm as well as 75 rpm dissimilarities between the formulations were more apparent. The f2 value for pH 7.4 buffer at 50 rpm was 34.44 whereas, at 75 rpm, the f2 value was 41.49. The computed similarity factors (f2)
confirmed the conclusion refer Table 1, that pH 7.4 buffer at 75 rpm was more discriminating dissolution mediums and hence selected for IVIVC model development. The percentage drug releases calculated at various times are presented in Tables 2 and 3 and in Figs. 1 and 2. The similarity factor (f2) was presented in Table 1.
Pharmacokinetics analysis
The pharmacokinetic parameters Cmax, AUC0-t, AUC0-¥, Tmax, t½ and elimination rate constant for dextromethorphan were calculated by using non-compartmental model by using Winnonlin® Software
(Version 5.1) with the data obtained from six subjects who completed the study. All the formulations were well tolerated, with no major side effects and no relevant differences in safety profile observed between the preparations. The mean pharmacokinetic profile for the dextromethorphan represented at Table 4 and the mean plasma concentration profile as presented in Fig. 3.
Statistical analyses
The statistical parameters for Ln-transformed values of Cmax, AUC0-t and AUC0-¥ like the sum of square, degree of freedom, mean square, F,
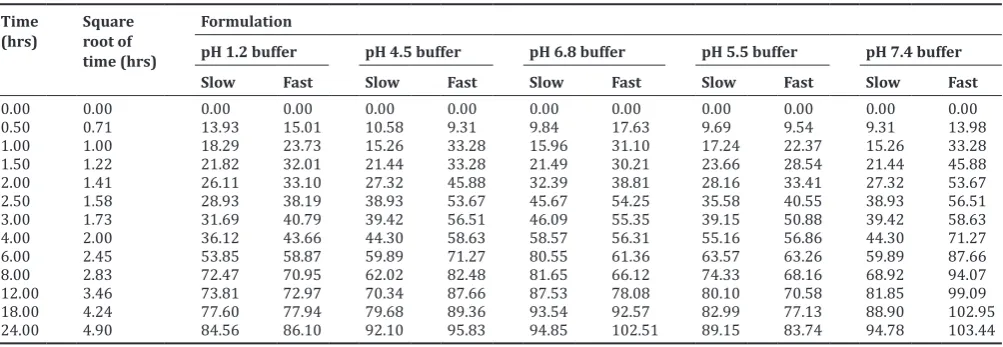
Table 1: Cumulative percentage dissolved at 50 rpm for the dextromethorphan hydrobromide test formulations Time
pH 1.2 buffer pH 4.5 buffer pH 6.8 buffer pH 5.5 buffer pH 7.4 buffer
Slow Fast Slow Fast Slow Fast Slow Fast Slow Fast
0.00 0.00 0.00 0.00 0.00 0.00 0.00 0.00 0.00 0.00 0.00 0.00 0.50 0.71 13.93 15.01 10.58 9.31 9.84 17.63 9.69 9.54 9.31 13.98 1.00 1.00 18.29 23.73 15.26 33.28 15.96 31.10 17.24 22.37 15.26 33.28 1.50 1.22 21.82 32.01 21.44 33.28 21.49 30.21 23.66 28.54 21.44 45.88 2.00 1.41 26.11 33.10 27.32 45.88 32.39 38.81 28.16 33.41 27.32 53.67 2.50 1.58 28.93 38.19 38.93 53.67 45.67 54.25 35.58 40.55 38.93 56.51 3.00 1.73 31.69 40.79 39.42 56.51 46.09 55.35 39.15 50.88 39.42 58.63 4.00 2.00 36.12 43.66 44.30 58.63 58.57 56.31 55.16 56.86 44.30 71.27 6.00 2.45 53.85 58.87 59.89 71.27 80.55 61.36 63.57 63.26 59.89 87.66 8.00 2.83 72.47 70.95 62.02 82.48 81.65 66.12 74.33 68.16 68.92 94.07 12.00 3.46 73.81 72.97 70.34 87.66 87.53 78.08 80.10 70.58 81.85 99.09 18.00 4.24 77.60 77.94 79.68 89.36 93.54 92.57 82.99 77.13 88.90 102.95 24.00 4.90 84.56 86.10 92.10 95.83 94.85 102.51 89.15 83.74 94.78 103.44
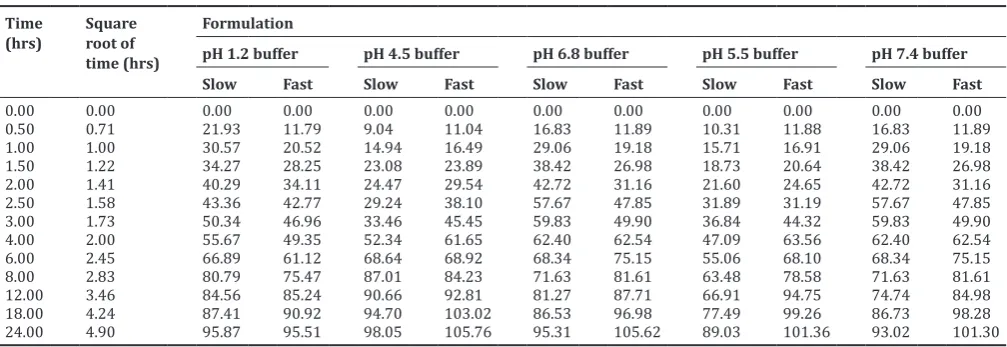
Table 2: Cumulative percentage dissolved at 75 rpm for the dextromethorphan hydrobromide test formulations Time
(hrs)
Square root of time (hrs)
Formulation
pH 1.2 buffer pH 4.5 buffer pH 6.8 buffer pH 5.5 buffer pH 7.4 buffer
Slow Fast Slow Fast Slow Fast Slow Fast Slow Fast
0.00 0.00 0.00 0.00 0.00 0.00 0.00 0.00 0.00 0.00 0.00 0.00 0.50 0.71 21.93 11.79 9.04 11.04 16.83 11.89 10.31 11.88 16.83 11.89 1.00 1.00 30.57 20.52 14.94 16.49 29.06 19.18 15.71 16.91 29.06 19.18 1.50 1.22 34.27 28.25 23.08 23.89 38.42 26.98 18.73 20.64 38.42 26.98 2.00 1.41 40.29 34.11 24.47 29.54 42.72 31.16 21.60 24.65 42.72 31.16 2.50 1.58 43.36 42.77 29.24 38.10 57.67 47.85 31.89 31.19 57.67 47.85 3.00 1.73 50.34 46.96 33.46 45.45 59.83 49.90 36.84 44.32 59.83 49.90 4.00 2.00 55.67 49.35 52.34 61.65 62.40 62.54 47.09 63.56 62.40 62.54 6.00 2.45 66.89 61.12 68.64 68.92 68.34 75.15 55.06 68.10 68.34 75.15 8.00 2.83 80.79 75.47 87.01 84.23 71.63 81.61 63.48 78.58 71.63 81.61 12.00 3.46 84.56 85.24 90.66 92.81 81.27 87.71 66.91 94.75 74.74 84.98 18.00 4.24 87.41 90.92 94.70 103.02 86.53 96.98 77.49 99.26 86.73 98.28 24.00 4.90 95.87 95.51 98.05 105.76 95.31 105.62 89.03 101.36 93.02 101.30
Fig. 2: Percentage of dextromethorphan hydrobromide release versus time profile for slow and fast modified release tablets using 75 rpm
Fig. 3: Mean plasma concentration-time profile of dextromethorphan hydrobromide from developed sustained release tablets (test) and marketed immediate release tablet (reference)
significance values for slow, fast release test formulations and reference formulation of dextromethorphan hydrobromide between subject effects, period, sequence and treatment effects are non-significant. The 95% confidence interval for slow, fast test formulations and reference
formulation i.e. Cmax ranges from 0.46175 to 0.59158 and from 0.51723
Asian J Pharm Clin Res, Vol 8, Issue 4, 2015, 79-86 Ramesh et al.
differences for Cmax were 0.52667 and 0.57500, for AUC0-t were 1.8633 and 1.9700 and AUC0-¥ were 1.5650 and 1.7150, respectively. The mean percentage ratio for Cmax was 169.32 and 177.71, for AUC0-t were 478.26 and 555.66, for AUC0-¥ was 644.51 and 717.06 respectively. The percentage confidence interval for Cmax ranges from 93.71 to 106.70 and
Table 3: Similarity factors for dextromethorphan hydrobromide modified release dosage forms in various dissolution conditions S. no pH Conditions Formulation Similarity factor (f2)
1 pH 1.2 buffer 50 rpm Fast versus slow 60.61 2 pH 1.2 buffer 75 rpm Fast versus slow 61.49 3 pH 4.5 buffer 50 rpm Fast versus slow 42.06 4 pH 4.5 buffer 75 rpm Fast versus slow 59.62 5 pH 6.8 buffer 50 rpm Fast versus slow 48.79 6 pH 6.8 buffer 75 rpm Fast versus slow 52.02 7 pH 5.5 buffer 50 rpm Fast versus slow 60.72 8 pH 5.5 buffer 75 rpm Fast versus slow 43.64 9 pH 7.4 buffer 50 rpm Fast versus slow 34.44 10 pH 7.4 buffer 75 rpm Fast versus slow 41.49
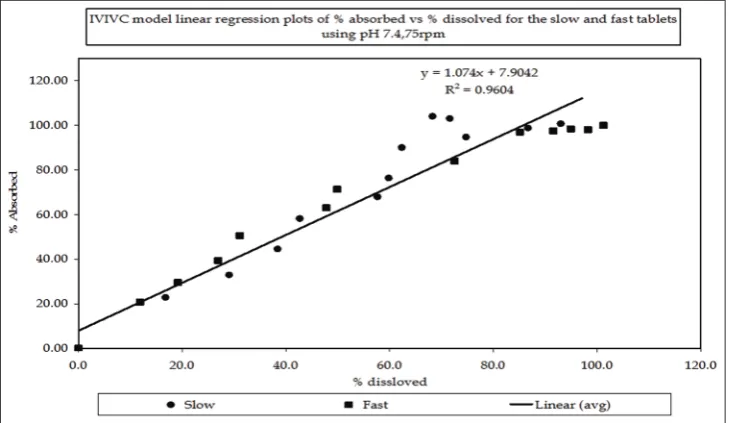
Fig. 5: In vitro and in vivo correlation model regression plots of % absorbed versus dissolved for the slow and fast tablets using pH 7.4, 50 rpm Fig. 4: In vitro and in vivo correlation model regression plots of % absorbed versus dissolved for the slow and fast tablets using pH 7.4, 50 rpm
from 94.38 to 105.56, for AUC0-t ranges from 90.77 to 110.16 and from 85.28 to 117.24 and for AUC0-¥ ranges from 88.40 to 113.11 and from 87.25 to 114.60 respectively. All statistical analyses were performed on using SAS® 9.1 version software.
Establishment of the IVIVC
Level A IVIVC is the most informative and very useful from a regulatory point of view because it involves a point-to-point comparison between in vitro dissolution and the in vivo input rate. An IVIVC plot was constructed using a percentage of the drug dissolved at pH 7.4 buffer dissolution media at 50 rpm and 75 rpm versus the percentage of drug absorbed. The slope of the best-fit line was examined using linear regression analysis and the coefficient of determination (r2), slope and intercept
values calculated are presented in Tables 5 and 6 and in Figs. 4 and 5.
The correlation coefficient (r2) value for pH 7.4 buffer at 50 rpm and
75 rpm was 0.9177 and 0.9604, respectively. A good linear regression relationship was thus observed at pH 7.4 buffer and 75 rpm. Linear regression analysis was applied to the IVIVC plots and the coefficient of correlation (r2), slope and intercept values calculated are presented in
Internal validation
IVIVC predictive performance was carried out by using the mean in vitro dissolution data and mean in vivo pharmacokinetics of the selected modified release formulations. To calculate median observed and predicted plasma concentration-time curves for respective formulations were compared. Calculation was done based on percentage prediction error (PE) for AUC and Cmax for both the formulation.
%PE= Observed Predicted Observed
−
×100 (2)
Percentage PEs for Cmax and AUC were calculated and are presented in
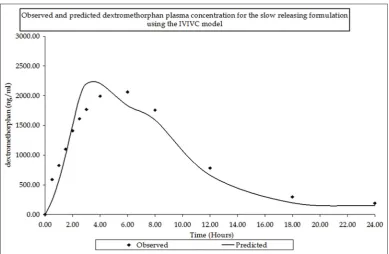
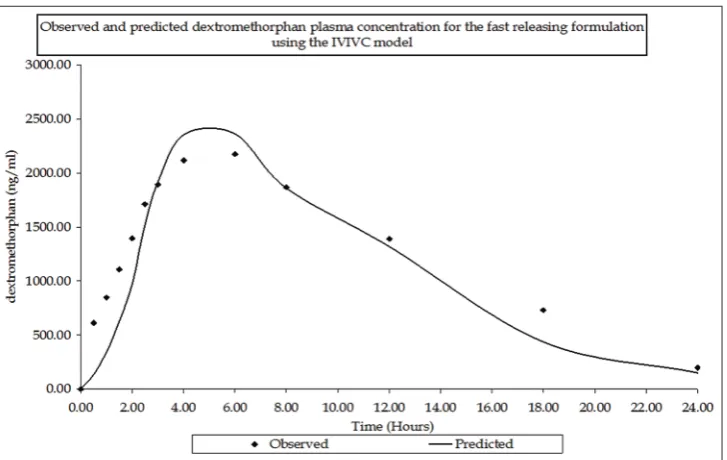
Tables 7 and 8 and in Figs. 9 and 10. The Cmax PEs for both the slow and
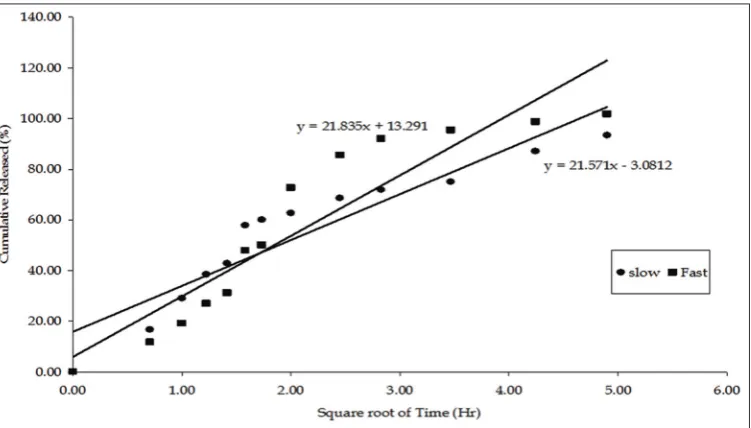
fast formulations found to be −6.98 and −8.55 and for AUC was 7.76 and 8.82%, respectively. The PE for Cmax and AUC were within acceptance Fig. 6: Cumulative dextromethorphan hydrobromide release versus square root of time profile for slow and fast modified release tablets
using pH 7.4, 50 rpm
Fig. 7: Cumulative dextromethorphan hydrobromide release versus square root of time profile for slow and fast modified release tablets using pH 7.4, 75 rpm
Table 4: Mean pharmacokinetic profile (n=6) Dextromethorphan
hydrobromide
Cmax Tmax AUC0-t t1/2 kel AUC0‑∞
Immediate release 1229.608 (59.694) 1.667 (0.258) 5281.061 (518.573) 2.519 (0.207) 0.277 (0.025) 6239.811 (443.451) Slow release 2086.819 (152.939) 6.333 (0.816) 25132.049 (778.166) 5.507 (0.539) 0.127 (0.012) 40168.688 (3147.203) Fast release 2191.666 (108.581) 5.333 (1.033) 29329.740 (3183.219) 5.381 (0.495) 0.130 (0.013) 44849.886 (4394.895)
Asian J Pharm Clin Res, Vol 8, Issue 4, 2015, 79-86 Ramesh et al.
Fig. 8: Plot of in vitro dissolution rate constants versus in vivo absorption rate constants
Fig. 9: Observed and predicted dextromethorphan plasma concentration for the slow release formulation using in vitro and in vivo correlation model
criteria and therefore, established IVIVC was successfully validated and in turn confirm the similarity of in vitro and in vivo conditions.
CONCLUSION
The validity of the correlation was assessed and determined how well the IVIVC model could predict the rate and extent of absorption as characterized by Cmax and AUC. The percent PE of £10% for Cmax and AUC
was obtained, which establish the predictability of the developed IVIVC model. IVIVC can be used in the development of new pharmaceuticals
product to decrease the number of human studies conducted during formulation development. It supports and/or validates the use of dissolution methods and specification settings. It can be concluded that the developed dissolution methods can surrogate for human bioequivalence studies.
ACKNOWLEDGMENT
Table 5: IVIVC model linear regression of % absorbed versus % dissolved for dextromethorphan hydrobromide tablets using pH 7.4 at 50 rpm
Time Percentage dissolved (pH 7.4) Percentage absorbed
Slow Fast Slow Fast
0.0 0.0 0.0 0.00 0.00
0.5 9.31 13.98 22.90 20.74
1 15.21 33.21 32.91 29.44
1.5 21.35 45.70 44.63 39.36
2 27.20 53.42 58.17 50.48
2.5 38.77 56.22 67.97 62.99
3 39.20 58.32 76.36 71.29
4 44.08 70.94 90.13 84.00
6 59.64 87.26 104.06 97.03
8 68.59 93.58 103.10 97.38
12 81.47 98.56 94.73 98.38
18 88.44 102.39 98.82 98.12
24 94.29 102.87 100.76 99.92
IVIVC: In vitro and in vivo correlation
Fig. 10: Observed and predicted dextromethorphan plasma concentration for the fast release formulation using in vitro and in vivo correlation model
Table 6: IVIVC model linear regression of % absorbed versus % dissolved for dextromethorphan hydrobromide tablets using pH 7.4 at 75 rpm
Time Percentage dissolved (pH 7.4) Percentage absorbed
Slow Fast Slow Fast
0.0 0.0 0.0 0.00 0.00
0.5 16.83 11.89 22.90 20.74
1 29.06 19.18 32.91 29.44
1.5 38.42 26.98 44.63 39.36
2 42.72 31.16 58.17 50.48
2.5 57.67 47.85 67.97 62.99
3 59.83 49.90 76.36 71.29
4 62.40 72.54 90.13 84.00
6 68.34 85.15 104.06 97.03
8 71.63 91.61 103.10 97.38
12 74.74 94.98 94.73 98.38
18 86.73 98.28 98.82 98.12
24 93.02 101.30 100.76 99.92
Asian J Pharm Clin Res, Vol 8, Issue 4, 2015, 79-86 Ramesh et al.
Table 7: Observed and IVIVC model predicted Cmax and AUC values for dextromethorphan hydrobromide dextromethorphan hydrobromide
Time (hrs) Slow formulation Fast formulation
Fraction observed Fraction predicted Fraction observed Fraction predicted
0.00 0.00 0.00 0.00 0.00
Cmax 2062.12 2206.11 2175.32 2361.35
IVIVC: In vitro and in vivo correlation, AUC: Area under the plasma concentration
REFERENCES
1. Food and Drug Administration. Guidance for industry: Extended release oral dosage forms: Development, evaluation, and application of
in vitro/in vivo correlations. Rockville: FDA; 1997.
2. Silvasti M, Karttunen P, Tukiainen H, Kokkonen P, Hänninen U, Nykänen S. Pharmacokinetics of dextromethorphan and dextrorphan: a single dose comparison of three preparations in human volunteers. Int J Clin Pharmacol Ther Toxicol 1987;25(9):493-7.
3. Meyyanathan SN, Rajan S, Muralidaharan S, Siddaiah MK, Krishnaraj K, Suresh B. Formulation and evaluation of dextromethorphan hydrobromide sustained release tablets. Drug Deliv 2008;15(7):429-35.
4. Takka S, Sakr A, Goldberg A. Development and validation of an
in vitro-in vivo correlation for buspirone hydrochloride extended release tablets. J Control Release 2003;88(1):147-57.
5. Eddington ND, Marroum P, Uppoor R, Hussain A, Augsburger L. Development and internal validation of an in vitro-in vivo correlation for a hydrophilic metoprolol tartrate extended release tablet formulation. Pharm Res 1998;15(3):466-73.
6. Mirza T, Bykadi SA, Ellison CD, Yang Y, Davit BM, Khan MA. Use of in vitro-in vivo correlation to predict the pharmacokinetics of several products containing a BCS class 1 drug in extended release matrices. Pharm Res 2013;30(1):179-90.
7. Galia E, Nicolaides E, Hörter D, Löbenberg R, Reppas C, Dressman JB. Evaluation of various dissolution media for predicting in vivo
performance of class I and II drugs. Pharm Res 1998;15(5):698-705. 8. Hayes S, Dunne A, Smart T, Davis J. Interpretation and optimization
of the dissolution specifications for a modified release product with an
in vivo-in vitro correlation (IVIVC). J Pharm Sci 2004;93(3):571-81. 9. Fujisaki Y, Tsukune T, Funyû M, Okumura M, Ukigaya T,
Sugibayashi K. Development of sustained-release tablets containing sodium valproate: in vitro and in vivo correlation. Drug Dev Ind Pharm 2006;32(2):207-17.
10. Balan G, Timmins P, Greene DS, Marathe PH. In vitro-in vivo
correlation (IVIVC) models for metformin after administration of modified-release (MR) oral dosage forms to healthy human volunteers. J Pharm Sci 2001;90(8):1176-85.
11. Sorasucharti W, Ayres JW. Preliminary bioequivalence testing of two nicardipine hcl sustained-release formulations with in vitro/in vivo
correlations. European J Drug Metab Pharmacokinet 2001;26(1-2):I-7. 12. Meyer MC, Straughn AB, Mhatre RM, Shah VP, Williams RL, Lesko LJ.
The relative bioavailability and in vivo-in vitro correlations for four marketed carbamazepine tablets. Pharm Res 1998;15(11):1787-91. 13. Szakács T, Veres Z, Vereczkey L. In vitro-in vivo correlation of the
pharmacokinetics of vinpocetine. Pol J Pharmacol 2001;53(6):623-8. 14. Qiu Y, Garren J, Samara E, Cao G, Abraham C, Cheskin HS, et al.
Once-a-day controlled-release dosage form of divalproex sodium II: development of a predictive in vitro drug release method. J Pharm Sci 2003;92(11):2317-25.
15. Sirisuth N. Systematic method for the development and validation of an IVIVC metoprolol and naproxen drug examples. Int J Gen Drug 2002;3:250-8.
16. Eddington ND. In vitro in vivo correlation with metoprolol extended release tablets using two different releasing formulations: An internal validation evaluation. Int J Gen Drug: 417-29.
17. Lootvoet G, Beyssac E, Shiu, G.K, Aiache JM, Ritschel WA. Study on the release of indomethacin from suppositories: In vitro-in vivo
correlation. Int J Pharm 1992;85(1-3):113-20. Available from: http:// www.dx.doi.org/10.1016/0378-5173(92)90140-W.
18. Dressman JB, Reppas C. In vitro-in vivo correlations for lipophilic, poorly water-soluble drugs. Eur J Pharm Sci 2000;11 Suppl 2:S73-80.
Table 8: PEs (%) associated with Cmax and AUC for