Generation and propagation of static displacement
estimated using KiK-net recordings
Shigeo Kinoshita and Makiko Takagishi
Yokohama City University, Seto 22-2, Kanazawa-ku, Yokohama 236-0027, Japan
(Received April 7, 2011; Revised April 25, 2011; Accepted May 1, 2011; Online published September 27, 2011)
Using KiK-net strong-motion data recorded at eleven stations during the 2011 off the Pacific coast of Tohoku Earthquake (the 2011 Tohoku Earthquake), we investigate the generation and propagation of static displacements, i.e. coseismic permanent near-field displacements. The static displacements are calculated by double numerical integration after removing acceleration steps from the acceleration signals. The estimated static displacements are totally in agreement with the land deformation measured by GEONET, the GPS network established by the Geographical Survey Institute, despite the fact that our estimation method is extremely simple. It is hoped that scientific studies of this disastrous earthquake will one day lead to a real-time evaluation system for static displacement using strong-motion data. This would be expected to greatly improve the effectiveness of tsunami alert systems, since tsunamis are caused by sea-floor movements during earthquakes.
Key words:Static displacement, strong-motion, KiK-net.
1.
Introduction
This short article reports a preliminary evaluation of dis-placement signals estimated using borehole data provided by the KiK-net (Okadaet al., 2004) of the NIED (National Research Institute for Earth Science and Disaster Preven-tion) for the 2011 Tohoku Earthquake. Given the magnitude of this event (Mw=9.0), the strong-motion records may be
quite different from previous records. The generation and propagation of static displacement are evaluated based on near-field recordings.
GEONET, the Global Positioning System (GPS) estab-lished by the Geographical Survey Institute (GSI), recorded land deformation up to approximately 5 meters at the Pa-cific coast of eastern Honshu; in addition, an east-southeast deformation of 5.3 meters and a downward deformation of 1.2 meters were measured at the Ojika GPS site. Such co-seismic permanent displacement, i.e. near-field static dis-placement, and its spatial distribution, can lead to a tilt step in near-field acceleration signals as shown by Pillet and Virieux (2007). Furthermore, local tilt motions due to soil deformation may be induced by strong shaking (Kinoshita, 2008). The simplest method of modeling such tilt mo-tion in the acceleramo-tion signals is based on a step increase in acceleration approximated by a Heaviside step function (Zahradnik and Plesinger, 2005; Pillet and Virieux, 2007). This model produces a linearly increasing velocity signal by numerically integrating the acceleration signal. An acceler-ation step with a finite rise time, of course, causes a tradeoff between the tilt and static displacement signals (Kinoshita et al., 2009). Thus, we evaluated the static displacement
Copyright cThe Society of Geomagnetism and Earth, Planetary and Space Sci-ences (SGEPSS); The Seismological Society of Japan; The Volcanological Society of Japan; The Geodetic Society of Japan; The Japanese Society for Planetary Sci-ences; TERRAPUB.
doi:10.5047/eps.2011.05.003
by removing the influence of a Heaviside-type acceleration step.
The estimated displacement signals at eleven KiK-net stations indicate the generation of static displacements, which is totally in agreement with the land deforma-tion measured by GEONET and published on the Internet (http://www.gsi.go.jp/).
2.
Data and Method
To evaluate near-field displacement signals for this earth-quake, we selected strong-motion data recorded at eleven relatively equispaced KiK-net stations in the region be-tween the northern boundary of Iwate Prefecture and the southern boundary of Ibaraki Prefecture, as shown in Fig. 1 and Table 1; the data are provided on the Web site of KiK-net (http://www.bosai.go.jp/). The data for each station cor-respond to an accelerogram recorded at the top and bottom of a borehole. With the exception of the IBRH20 site, the borehole bottom recordings are used to estimate static dis-placements. For the IBRH20 site, the surface signal is used since the borehole depth at this site is rather large.
In this study, a conventional method is used for calcu-lating the displacement signal from the acceleration signal (Zahradnik and Plesinger, 2005; Pillet and Virieux, 2007), assuming an acceleration step of the forma H(t−to)in the
accelerogram, where a, H andto represent the amplitude
of the acceleration step, the Heaviside step function and the onset time of the step, respectively. The parametersa and to are determined from a linearly-increasing velocity
sig-nal calculated by numerical integration of the acceleration signal. For example, Fig. 2(b) shows the velocity signal de-termined from the east-west acceleration signal shown in Fig. 2(a), which was recorded at the MYGH12 site. The dotted line in Fig. 2(b) is a linear fit to the velocity data window between 200 and 300 s, and a and to are
780 S. KINOSHITA AND M. TAKAGISHI: GENERATION AND PROPAGATION OF STATIC DISPLACEMENT
Table 1. Station data used in this study and mean static displacements estimated. Acceleration signals recorded at borehole bottoms at each site are used, with the exception of the IBRH20 site, for which surface signals are used.
Site code Site name Lat. (N) Long. (E) Height (m) Depth of Static Disp. Static Disp. Static Disp. borehole (m) Eest (cm) North (cm) Up (cm)
1 FKSH12 HIRATA 37.2139 140.5736 470 105 164 −48 −25
2 FKSH19 MIYAKOJI 37.4672 140.7261 510 100 188 −39 −45
3 IBRH14 JYUUOH 36.689 140.5518 330 100 110 −2 −29
4 IBRH20 HASAKI2 35.8252 140.7356 6 0 12 13 unstable
5 IWTH08 KUJI-N 40.2658 141.7867 175 100 43 −40 −17
6 IWTH14 TAROU 39.7407 141.9123 200 100 121 −95 −16
7 IWTH21 YAMADA 39.4705 141.9372 13 100 166 −170 −38
8 MYGH03 KARAKUWA 38.9178 141.6412 80 117 368 −201 −72
9 MYGH06 TAJIRI 38.5878 141.0744 20 100 365 −92 −60
10 MYGH10 YAMAMOTO 37.9381 140.8958 18 205 280 −23 −58
11 MYGH12 SHIZUGAWA 38.6386 141.4463 18 102 428 −161 −83
(a)
(b)
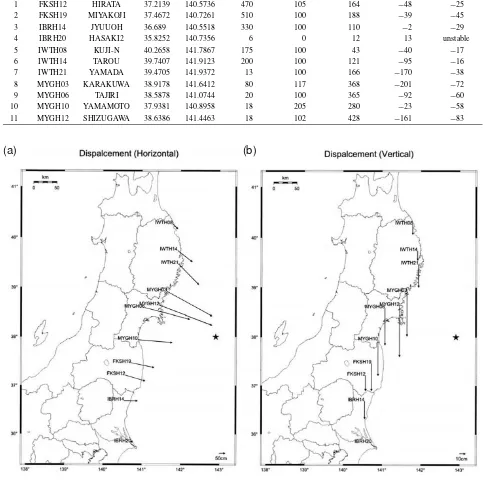
Fig. 1. Locations of KiK-net stations used in this study and estimated static displacements: (a) horizontal direction and (b) vertical direction. These static displacements are mean values calculated from displacement data in the data window from 200 to 300 s.
mined from the gradient of this straight line and its intercept on the time axis, respectively. From acceleration signals compensated for the offseta for t ≥ to, tilt-compensated
velocity and displacement signals are calculated as shown in Figs. 2(c) and (d), respectively. As can be seen from Fig. 2(d), a static displacement of about 4 meters occurs in the eastward direction.
3.
Results
Figures 3(a), (b) and (c) show the north-south, east-west and up-down components, respectively, of the displacement
Fig. 2. Example of static displacement estimation: (a) east-west acceleration signal recorded at the MYGH12 site, (b) velocity signals (solid line) calculated by numerical integration of acceleration signal, and regression line (dotted) determined by fitting to the velocity signal in the data window from 200 to 300 s (indicated by arrows), (c) calculated tilt-compensated velocity signal, and (d) displacement signal calculated from velocity signal shown in (c). Coseismic permanent displacement, i.e., static displacement, of approximately 4 m in eastward direction is estimated.
(a)
782 S. KINOSHITA AND M. TAKAGISHI: GENERATION AND PROPAGATION OF STATIC DISPLACEMENT
(b)
(c)
Fig. 3. (continued).
(b) are in full agreement with the GEONET measurements for land deformation just after the earthquake on the whole.
4.
Concluding Remarks
As pointed out by Pillet and Virieux (2007), determin-ing the gradient of the velocity signal cannot always be car-ried out accurately since a data length of 3 min is
obtained for this earthquake are probably more widely ap-plicable than previous strong-motion records. For exam-ple, obtaining the static displacement from strong-motion data before the arrival of a tsunami would improve the reli-ability of tsunami alert systems, since tsunamis are caused by sea-floor movements during earthquakes. In addition, a knowledge of the downward static displacement may allow the length of the inundation period after the tsunami to be predicted. The possibility of mitigating tsunami disasters provides strong motivation to develop a real-time system for estimating static displacement.
Acknowledgments. The authors are grateful to Dr. Yusaku Ohta and an anonymous reviewer for carefully reviewing the manuscript. We thank Dr. Toshihiko Hayakawa for his help in preparing our manuscript. We would also like to thank the NIED for providing the KiK-net strong-motion data.
References
Kinoshita, S., Tilt measurement using broadband velocity seismograms, Bull. Seismol. Soc. Am.,98, 1887–1897, 2008.
Kinoshita, S., H. Ishikawa, and T. Satoh, Tilt motions recorded at two WISE sites for the 2003 Tokachi-Oki earthquake (M 8.3),Bull. Seismol. Soc. Am.,99(2B), 1251–1260, 2009.
Okada, Y., K. Kasahara, S. Hori, K. Obara, S. Sekiguchi, H. Fujiwara, and A. Yamamoto, Recent progress of seismic observation networks in Japan—Hi-net, F-net, K-NET and KiK-net—,Earth Planets Space,56, xv–xxviii, 2004.
Pillet, R. and J. Virieux, The effects of seismic rotations on inertial sensors, Geophys. J. Int.,171(3), 1314–1323, 2007.
Zahradnik, J. and A. Plesinger, Long-period pulses in broadband records of near earthquakes,Bull. Seismol. Soc. Am.,95, 1928–939, 2005.