Available Online at www.ijcsmc.com
International Journal of Computer Science and Mobile Computing
A Monthly Journal of Computer Science and Information Technology
ISSN 2320–088X
IMPACT FACTOR: 6.199
IJCSMC, Vol. 8, Issue. 8, August 2019, pg.50 – 62
Creating a Stable and Fixed Features
Array for Digital Color Image
Naseem Asad1; Ismail Shayeb1; Qazem Jaber2; Belal Ayyoub3; Ziad Alqadi3; Ahmad Sharadqh3
1
Princess Alia University College; Al-Balqa Applied University Amman-Jordan
2Department of Mechatronics Engineering, Al Balqa’a Applied University, Amman, Jordan 3
Department of Computer Engineering, Al Balqa Applied University, Amman, Jordan
Abstract: Color image features extraction is an important and vital process, which is used in many computer applications such as human fingerprint identification, therefore, shortening the effort in dealing with digital images features extraction is a very important research task.
In this research paper we will investigate some methods widely used to extract color image features to be used as a signature to identify digital color image, here we will focus on a recommended method of color image features extraction which will create a unique features array for the original color image and for all its versions resulted in image reshaping and rotating.
Keywords: Features array, K_mean, LBP, CSLBP, RLBP, EPM, Reshaping, and Rotating.
1- Introduction
1-1 color image background
Digital color images is a 3D matrix [1], [2], the first channel is reserved for the red color, the second for the green, while the third one is reserved for the blue color [3], [4].
Digital color images is now one of the most famous and widely used data type, and they are used in various important applications[5], and to deal with data type we have to deal with a large size of data, making the process of image implementation very difficult.
Figure 1: color image and histograms
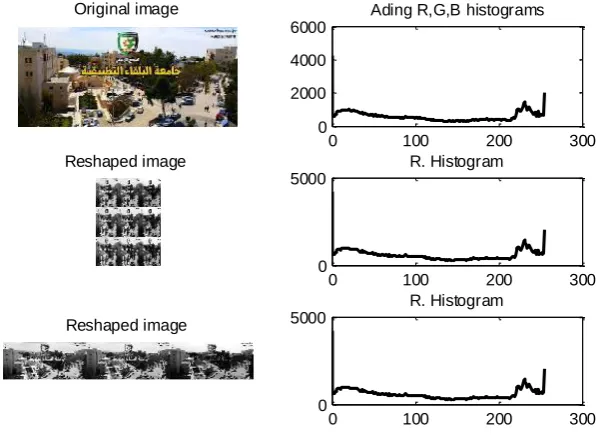
The digital image may take different positions resulting from rotating the image at different angles, this will produce different images, here we can process the histogram, because the histogram will not change and will remain the same for various positions of the image, figure 2 show the histogram for a color image reshaped row wise and column wise, from this figure we can see that the histograms are identical.
Figure 2: One histogram for various image positions
1-2 Color image features extraction
In Digital image processing , machine learning and pattern recognition, features extraction starts from an initial set of measured data and builds derived values (features) intended to be informative
Original image 1
0 100 200
0 200 400
Red histogram
0 100 200
0 200 400
Green histogram
0 100 200
0 200 400 600
Blue histogram
Original image
0 100 200 300
0 2000 4000 6000
Ading R,G,B histograms
Reshaped image
0 100 200 300
0 5000
R. Histogram
Reshaped image
0 100 200 300
0 5000
and non-redundant, facilitating the subsequent learning and generalization steps, and in some cases leading to better human[10], these features can be used to identify the image and they can be used in various important applications such as human fingerprints identification, face recognition, solving classification problem and many more other applications [11], [12], [13].
Feature extraction is an attribute reduction process [14], [15]. Unlike feature selection, which ranks the existing attributes according to their predictive significance, feature extraction actually transforms the attributes. ... Feature extraction can also be used to enhance the speed and effectiveness of supervised learning.
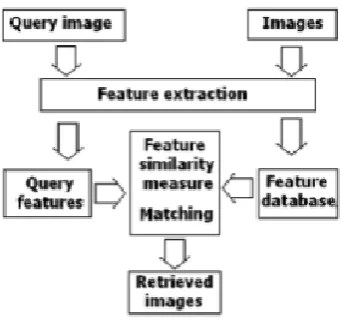
In simple words features are nothing but the unique signatures of the given image or unique properties that defines an image. Features are extracted in order to differentiate between the images. Features extraction is used in almost all machine vision algorithms [16] as shown in figure 3.
The purpose of feature extraction algorithms is to identify features that can best represent the image and contain fewer parameters. With the specified features, the image can be expressed meaningfully using fewer parameters. A faster and successful classification can be made with fewer computational loads by eliminating unimportant parameters [17]. Low-level features and high-level features are usually removed from the images. Low-level features are simpler features in the image and computational load is less. However, the classification success is low for complex images. High-level features are more complex and have more computational load. The choice of which features to use varies depending on the problem. For this reason, there are many feature extraction algorithms with different approaches in the literature.
Figure 3: Image matching process
1-3 Local binary pattern for image features extraction
Many methods of color image features extraction were developed based on Local Binary pattern (LBP) operator's calculation [18],[19],[20], such as center symmetric LBP (CSLBP), and reduced LBP (RLPB), extreme points method(EPM)[21], [22] .
All LBP methods are suffering from the following disadvantages:
- All the methods are pixel oriented and the LBP operator must be calculated for each pixel, which adds an extra time to the features extraction time.
- LBP based methods do not deal with the colors distribution, so they are not dependent on the image histogram, so any rotation of the image will lead to create a new image with a new features, which will adds an extra efforts of features processing.
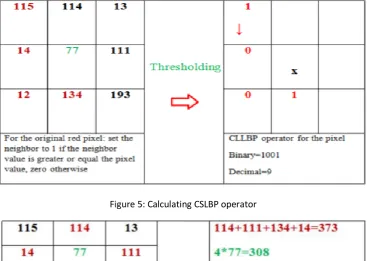
Figure 4: Calculating LBP operator
Figure 5: Calculating CSLBP operator
1-4 K-mean clustering method of features extraction
Data clustering means grouping data set items into groups, this method can be used to extract color image features by dividing the gray values into groups (clusters) resulting an array of clusters[23], each element of which points to the number of pixels that belongs to the cluster as shown in figures 7 and 8.
K-mean clustering method can be used as a histogram oriented method by using the image histogram as a method input data set.
The first step of color image clustering is to get a histogram for a 2D matrix; this can be done by selecting one of the following steps:
- Adding the histograms of the red, green and blue colors to get a total histogram array. - Reshaping the 3D matrix into 2D matrix row wise, the calculating the histogram for the 2D
matrix.
- Reshaping the 3D matrix into 2D matrix column wise, the calculating the histogram for the 2D matrix.
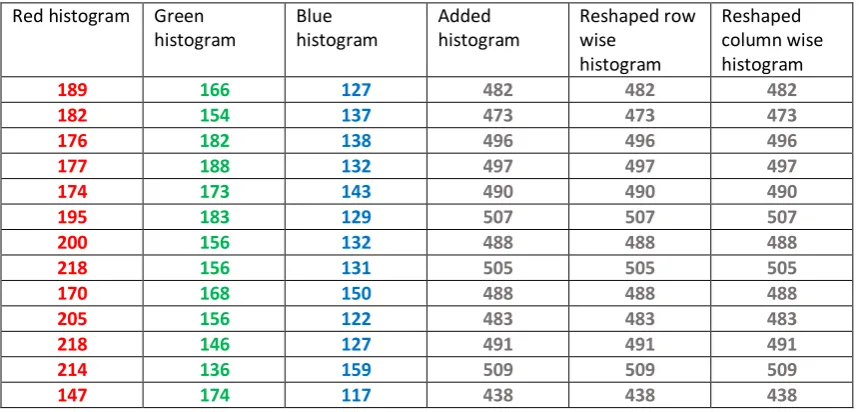
Here we have to notice that the resulting histogram will be the same and remains without any change for all the previous steps, and by this reason the clusters will also remain the same and without any changes, which means that the features will be stable and fixed.
Table 1 shows a part of the image histogram for the color image shown in figure 2:
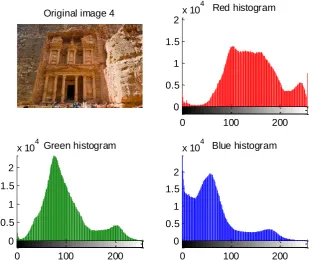
Figure 7: Original Petra city image Original image 4
0 100 200
0 0.5 1 1.5 2
x 104 Red histogram
0 100 200
0 0.5 1 1.5 2
x 104 Green histogram
0 100 200
0 0.5 1 1.5 2
Figure 8: Clusterized image (clusters = 4)
Table 1: Image histogram (Gray values from 100 to 112) Red histogram Green
histogram
Blue histogram
Added histogram
Reshaped row wise
histogram
Reshaped column wise histogram
989 966 927 482 482 482
982 954 937 473 473 473
976 982 938 496 496 496
977 988 932 497 497 497
974 973 943 494 494 494
995 983 929 547 547 547
244 956 932 488 488 488
298 956 939 545 545 545
974 968 954 488 488 488
245 956 922 483 483 483
298 946 927 499 499 499
294 936 959 549 549 549
947 974 997 438 438 438
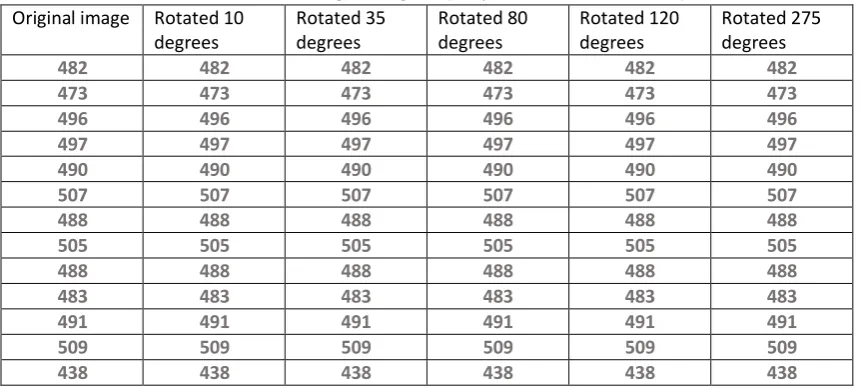
The image histogram will remain the same even if we rotate the image with any degree, this will keep the image features stable and fixed for any image position, this fact is an important issue for some kind of applications such as human fingerprints identification, table 2 shows a part of image histogram for the image shown in figure 2 with various positions:
Clusterized image 4
0 100 200
0 5 10 15
x 104 Red histogram
0 100 200
0 5 10 15
x 104 Green histogram
0 100 200
0 5 10 15
Table 2: Rotated image histogram (Gray values from 100 to 112) Original image Rotated 10
degrees
Rotated 35 degrees
Rotated 80 degrees
Rotated 120 degrees
Rotated 275 degrees
482 482 482 482 482 482
473 473 473 473 473 473
496 496 496 496 496 496
497 497 497 497 497 497
494 494 494 494 494 494
547 547 547 547 547 547
488 488 488 488 488 488
545 545 545 545 545 545
488 488 488 488 488 488
483 483 483 483 483 483
499 499 499 499 499 499
549 549 549 549 549 549
438 438 438 438 438 438
2- Features extraction using K-mean clustering method implementation K-mean method clustering can be implemented applying the following phases:
i. Initialization
This step can be implemented applying the following steps: A. Get the original color image.
B. Reshape the 3D color image to 2D image.
C. Calculate the image histogram to be used as an input data set. D. Select the number of clusters.
E. For each cluster select a starting centroide. ii. While no changes in the centroids values do the following:
1) For each cluster find the cluster distant which is equal the absolute value of the data set item subtracted from the cluster centroide.
2) For the data item select the cluster to which the item is belong by choosing the nearest cluster.
3) For each cluster find the average of its data items to be a new centroide for this cluster.
4) Stop if there are no changes in any new calculated centroid.
Here is an example of how to implement this method: - Initialization
Data set = 15, 15, 16, 19, 19, 20, 20, 21, 22, 28, 35, 40, 41, 42, 43, 44, 60, 61, 65
Number of clusters =2 Centroids c1=16; c2=2;
First pass: calculating the new centroids
xi c1 c2 Distance 1 | x
i - c1 |
Distance 2 | xi - c2|
Nearest
Cluster New Centroid
15 16 22 1 7 1
15.33
15 16 22 1 7 1
16 16 22 0 6 1
19 16 22 9 3 2
36.25
20 16 22 4 2 2
20 16 22 4 2 2
21 16 22 5 1 2
22 16 22 6 0 2
28 16 22 12 6 2
35 16 22 19 13 2
40 16 22 24 18 2
41 16 22 25 19 2
42 16 22 26 20 2
43 16 22 27 21 2
44 16 22 28 22 2
60 16 22 44 38 2
61 16 22 45 39 2
65 16 22 49 43 2
The new centroids are:
C1=15.33
C2=36.25
The centroids were changed so proceed to pass 2:
Second pass
xi c1 c2 Distance 1 | x
i - c1 |
Distance 2 | xi - c2|
Nearest Cluster
New Centroid
15 15.33 36.25 0.33 21.25 1
18.56
15 15.33 36.25 0.33 21.25 1
16 15.33 36.25 0.67 20.25 1
19 15.33 36.25 3.67 17.25 1
19 15.33 36.25 3.67 17.25 1
20 15.33 36.25 4.67 16.25 1
20 15.33 36.25 4.67 16.25 1
21 15.33 36.25 5.67 15.25 1
22 15.33 36.25 6.67 14.25 1
28 15.33 36.25 12.67 8.25 2
45.9
35 15.33 36.25 19.67 1.25 2
40 15.33 36.25 24.67 3.75 2
41 15.33 36.25 25.67 4.75 2
42 15.33 36.25 26.67 5.75 2
43 15.33 36.25 27.67 6.75 2
44 15.33 36.25 28.67 7.75 2
60 15.33 36.25 44.67 23.75 2
61 15.33 36.25 45.67 24.75 2
The new centroids are:
C1=18.56
C2=45.9
The centroids were changed so proceed to pass 3:
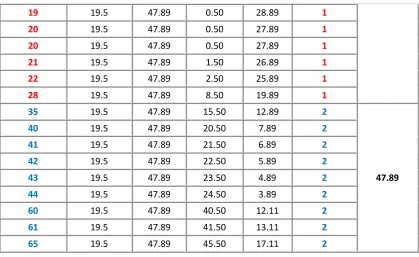
Third pass
xi c1 c2
Distance 1 | xi - c1 |
Distance 2 | xi - c2|
Nearest Cluster New Centroid
15 18.56 45.9 3.56 30.9 1
19.50
15 18.56 45.9 3.56 30.9 1
16 18.56 45.9 2.56 29.9 1
19 18.56 45.9 0.44 26.9 1
19 18.56 45.9 0.44 26.9 1
20 18.56 45.9 1.44 25.9 1
20 18.56 45.9 1.44 25.9 1
21 18.56 45.9 2.44 24.9 1
22 18.56 45.9 3.44 23.9 1
28 18.56 45.9 9.44 17.9 1
35 18.56 45.9 16.44 10.9 2
47.89
40 18.56 45.9 21.44 5.9 2
41 18.56 45.9 22.44 4.9 2
42 18.56 45.9 23.44 3.9 2
43 18.56 45.9 24.44 2.9 2
44 18.56 45.9 25.44 1.9 2
60 18.56 45.9 41.44 14.1 2
61 18.56 45.9 42.44 15.1 2
65 18.56 45.9 46.44 19.1 2
The new centroids are:
C1=19.50
C2=47.89
The centroids were changed so proceed to pass 4:
Forth pass
xi c1 c2
Distance 1 | xi - c1 |
Distance 2
| xi - c2| Nearest Cluster New Centroid
15 19.5 47.89 4.50 32.89 1
19.50
15 19.5 47.89 4.50 32.89 1
16 19.5 47.89 3.50 31.89 1
19 19.5 47.89 0.50 28.89 1
20 19.5 47.89 0.50 27.89 1
20 19.5 47.89 0.50 27.89 1
21 19.5 47.89 1.50 26.89 1
22 19.5 47.89 2.50 25.89 1
28 19.5 47.89 8.50 19.89 1
35 19.5 47.89 15.50 12.89 2
47.89
40 19.5 47.89 20.50 7.89 2
41 19.5 47.89 21.50 6.89 2
42 19.5 47.89 22.50 5.89 2
43 19.5 47.89 23.50 4.89 2
44 19.5 47.89 24.50 3.89 2
60 19.5 47.89 40.50 12.11 2
61 19.5 47.89 41.50 13.11 2
65 19.5 47.89 45.50 17.11 2
The centroids remain the same, so the data items were clustered into 2 clusters, the first cluster contains 10 data items, while the second cluster contains 9 data items.
3- Experimental results 3-1 LBP based method Results
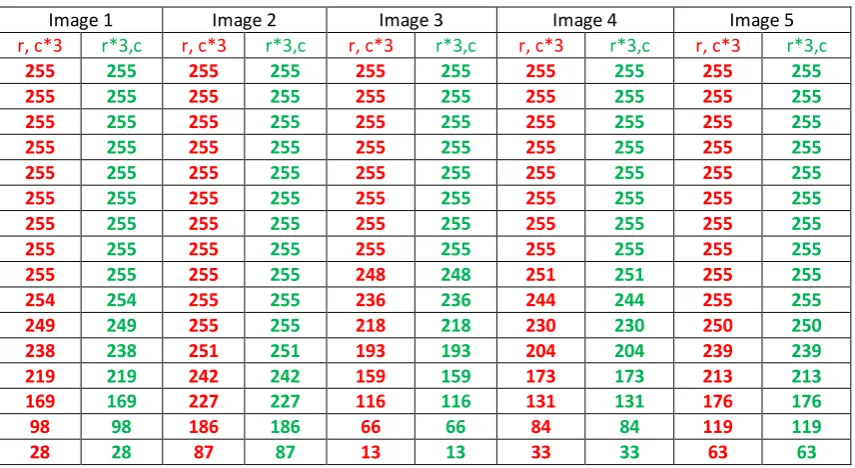
LBP based methods of image features extraction used similar scenarios of features extraction with varying features array. CSLBP method was selected and implemented using various color images with various reshaping method, table 3 shows the results of implemented CSLBP method:
Table 3: CSLBP results
Image 1 Image 2 Image 3 Image 4 Image 5
r, c*3 r*3,c r, c*3 r*3,c r, c*3 r*3,c r, c*3 r*3,c r, c*3 r*3,c
3864 96768 93892 8889 929969 84982 834797 478342 996752 698794
3377 93256 7388 5948 64942 32978 699798 379669 454484 394948
9587 3632 2236 2266 6264 5532 85895 82354 44558 52493
32274 29233 6994 9257 47494 75746 463945 668997 449486 645574
2857 4854 2434 2774 4797 94544 58593 948649 44799 942575
2644 4374 9785 2399 3828 9499 53398 935346 29377 88949
9277 3494 2999 9875 5646 4264 74762 73496 44628 59577
23942 95394 5988 7535 42943 68349 463424 653855 345456 488448
36932 24439 7379 94455 53828 86447 595646 754724 426798 639495
9693 3939 9774 9689 4978 3789 69353 65449 25999 28949
3844 4478 9893 2894 4394 9844 57748 942758 35359 94593
3743 4294 9579 2969 3598 8364 44736 929762 26995 79748
25432 94939 5963 7452 43374 63843 454938 659526 373998 595739
9323 2643 9782 9747 4443 3565 67493 65628 23942 25698
2826 9498 8389 5324 54379 25734 667878 379495 672544 394483
2634 7794 7959 5945 53767 26784 645342 346584 365429 237353
From the obtained experimental results we can raise the following facts:
- For the same image with various methods of reshaping, different features array were extracted, this will cause difficulties in a recognition system, each image shape will be considered here as a new image.
- Rotating the image will lead to a new features array, also here the rotated image will be considered as a new image.
3-2 K-mean clustering method results
The previous mentioned facts can be considered as disadvantages of LBP based methods of features extraction, to overcome these disadvantages we can use k_mean method of clustering to extract color image features.
K-mean method of clustering was implemented using various images with various methods of reshaping; table 4 shows the obtained experimental results:
Table 4:
Table 4: K_mean method results
Image 1 Image 2 Image 3 Image 4 Image 5
r, c*3 r*3,c r, c*3 r*3,c r, c*3 r*3,c r, c*3 r*3,c r, c*3 r*3,c
255 255 255 255 255 255 255 255 255 255
255 255 255 255 255 255 255 255 255 255
255 255 255 255 255 255 255 255 255 255
255 255 255 255 255 255 255 255 255 255
255 255 255 255 255 255 255 255 255 255
255 255 255 255 255 255 255 255 255 255
255 255 255 255 255 255 255 255 255 255
255 255 255 255 255 255 255 255 255 255
255 255 255 255 248 248 259 259 255 255
254 254 255 255 236 236 244 244 255 255
249 249 255 255 298 298 234 234 254 254
238 238 259 259 993 993 244 244 239 239
299 299 242 242 959 959 973 973 293 293
969 969 227 227 996 996 939 939 976 976
98 98 986 986 66 66 84 84 999 999
28 28 87 87 93 93 33 33 63 63
The previous images were rotated with different degrees; table 5 shows the features of the rotated images:
Table 5: Features for rotated images using K-mean method
Image Rotation degree
Features(clusters)
1
0 233 172 97 27
45 233 172 97 27
90 233 172 97 27
135 233 172 97 27
2
0 240 211 156 63
45 240 211 156 63
90 240 211 156 63
135 240 211 156 63
3
0 196 132 71 14
45 196 132 71 14
90 196 132 71 14
135 196 132 71 14
4
0 209 149 90 36
90 209 149 90 36
135 209 149 90 36
5
0 235 178 116 61
45 235 178 116 61
90 235 178 116 61
135 235 178 116 61
From the obtained results shown in tables 4 and 5 we can conclude the following:
- Number of elements in the features array can be varied and it is equal to the number of selected clusters in the initialization phase.
- A features array is a unique for a certain color image and it can be used as a signature to identify the image.
- K-mean method is an effective method of features extraction especially for some applications such as fingerprints identification.
- The color image features are histogram oriented, the same features array can be extracted for various reshaped image, and for various rotated color image, thus minimizing the efforts of building identification systems.
Conclusion
Various methods of color image features extraction were investigated, tested and implemented. From the obtained experimental results we can recommend K_mean clustering method for color image features extractions especially for those applications which are dealing with different rotated forms of the same image such as fingerprint identification application, here we can extract a unique features array for all color image forms, minimizing the efforts, required memory and processing time of color image identification.
References
[1] Ziad A. Alqadi, Majed O. Al-Dwairi, Amjad A. Abu Jazar and Rushdi Abu Zneit, Optimized True-RGB color Image Processing, World Applied Sciences Journal 8 (10): 1175-1182, ISSN 1818-4952, 2010.
[2] A. A. Moustafa, Z. A. Alqadi, Color Image Reconstruction Using A New R'G'I Model, journal of Computer Science, Vol.5, No. 4, pp. 250-254, 2009.
[3] Jamil Al Azzeh, Hussein Alhatamleh, Ziad A. Alqadi, Mohammad Khalil Abuzalata, Creating a Color Map to be used to Convert a Gray Image to Color Image; International Journal of Computer Applications , November 2016,Volume 153,Issue 2.
[4] Jamil Al-Azzeh, Ziad Alqadi, Mohammed Abuzalata, Performance Analysis of Artificial Neural Networks used for Color Image Recognition and Retrieving, International Journal of Computer Science and Mobile Computing,2019,Volume 8 Issue 2.
[5] Jamil AL-Azzeh, Bilal Zahran, Ziad Alqadi, Belal Ayyoub and Mazen Abu-Zaher: A Novel Zero-Error Method to Create a Secret Tag for an Image; Journal of Theoretical and Applied Information Technology 15th July 2018.
[6] Jamil AL-Azzeh, Bilal Zahran and Ziad Alqadi: Salt and Pepper Noise: Effects and Removal, International Journal on Informatics Visualization July 2018, Volume 2 Issue 4.
[7] Musbah J. Aqel , Ziad A. Alqadi, Ibraheim M. El Emary ,Analysis of Stream Cipher Security Algorithm, Journal of Information and Computing Science Vol. 2, No. 4, 2007, pp. 288-298.
[8] Belal Ayyoub, Ashraf Abu-Ein, Ziad Alqadi, Suggested Method to Create Color Image Features Victor, Journal of Engineering and Applied Sciences, 2019, Volume14, Issue7.
[9] K Matrouk, A Al-Hasanat, H Alasha'ary, Z. Al-Qadi,H Al-Shalabi, Speech fingerprint to identify isolated word person, World Applied Sciences Journal, Vol. 31, No. 10, pp. 1767-1771, 2014.
[10] Mohammed Abuzalata, Ziad Alqadi; Jamil Al-Azzeh; Qazem Jaber, Modified Inverse LSB
[11] Mutaz Rasmi Abu Sara Rashad J. Rasras, Ziad A. AlQadi, Engineering, A Methodology Based on Steganography and Cryptography to Protect Highly Secure Messages Technology & Applied Science Research, Vol.9 Issue 1, Pages 3681-3684, 2019.
[12] Ziad Alqadi, Bilal Zahran, Qazem Jaber, Belal Ayyoub, Jamil Al-Azzeh, Ahmad Sharadqh, proposed Implementation Method to Improve LSB Efficiency, International Journal of Computer Science and Mobile Computing, Vol.8 Issue.3, March-2019, pg. 306-319.
[13] Deepak Garg, Gourav Sharma, Applications of Steganography in Information Hiding, international Journal of Advanced Research in Education & Technology (IJARET) 12 Vol. 3, Issue 1 (Jan. - Mar. 2016).
[14] J. Al-Azzeh, B. Zahran, Z. Alqadi, B. Ayyoub, M. Abu-Zaher, “A Novel zero-error method to create a secret tag for an image”, Journal of Theoretical and Applied Information Technology, Vol . 96. No. 13, pp. 4081-4091, 2018.
[15] Prof. Ziad A.A. Alqadi, Prof. Mohammed K. Abu Zalata, Ghazi M. Qaryouti, Comparative Analysis of Color Image Steganography, JCSMC, Vol.5, Issue. 11, November 2016, pg.37–43.
[16] M. Jose, “Hiding Image in Image Using LSB Insertion Method with Improved Security and Quality”, International Journal of Science and Research, Vol. 3, No. 9, pp. 2281-2284, 2014.
[17] Ziad Alqadi; Bilal Zahran; Qazem Jaber; Belal Ayyoub; Jamil Al-Azzeh, Enhancing the Capacity of LSB Method by Introducing LSB2Z Method; International Journal of Computer Science and Mobile Computing,2019,Volume 8 Issue 3.
[18] Naseem Asad, Ismail Shayeb, “A Modification of Least Significant Digit (LSD) Digital Watermark Technique”, International Journal of Computer Applications
Volume 179 No.32, April 2018
[19] Jamil Al Azzeh, Ziad Alqadi Qazem, M Jabber;”Statistical Analysis of Methods Used to
Enhanced Color Image”; XX International Scientific and Technical Conference;2016.
[20] Mazen Abuzaher Jamil Al-Azzeh, :JPEG Based Compression Algorithm”; ternational Journal of
Engineering and Applied Sciences, 2017,Volume 4 Issue 4.
[21] Jamil Al-Azzeh, Ziad Alqadi, Qazem Jaber; “A Simple, Accurate and Highly Secure Method to