Clinical Epidemiology 2018:10 581–591
Clinical Epidemiology
Dove
press
submit your manuscript | www.dovepress.com 581
O R I G I N A L R E S E A R C H
open access to scientific and medical research
Open Access Full Text Article
Lifetime risks, loss of life expectancy, and
health care expenditures for 19 types of
cancer in Taiwan
Tzu-Yi Wu1
Chia-Hua Chung2
Chia-Ni Lin3
Jing-Shiang Hwang2
Jung-Der Wang3,4
1Institute of Economics, Academia Sinica, Taipei, Taiwan; 2Institute of Statistical Science, Academia Sinica, Taipei, Taiwan; 3Department of Public Health, College of Medicine, National Cheng Kung University, Tainan, Taiwan; 4Department of Occupational and Environmental Medicine, National Cheng Kung University Hospital, College of Medicine, National Cheng Kung University, Tainan, Taiwan
Background: The mortality rates for different cancers are no longer an efficient tool for making national policy. The purpose of this study were to quantify the lifetime risks, life expectancies (LEs) after diagnosis, expected years of life lost (EYLL), and lifetime health care expenditures for 19 major cancers in Taiwan.
Methods: A total of 831,314 patients with 19 pathologically proven cancers were abstracted
from the Taiwan Cancer Registry from 1998 to 2012. They were linked to the National Mortality Registry (1998–2014) and National Health Insurance reimbursement database (1998–2013) for survival and health care costs. We estimated the cumulative incidence rate for ages 0–79 years and the lifetime survival function for patients with different cancer sites. The EYLL was calcu-lated by subtracting the LE of each cancer cohort from that of the age- and sex-matched referents simulated from national life tables. The estimated lifetime cost was calculated by adding up the product of survival probability and mean cost at the corresponding duration-to-date after adjustment for the inflation to the year of 2013.
Results: There were 5 cancers with a lifetime risk exceeding 4%: colorectal, liver, lung, and prostate in males, and breast and colorectal in females. Cancers with EYLL of >10 years were: esophageal, intrahepatic bile ducts, liver, pancreas, oral, nasopharyngeal, leukemia, lung, and gallbladder, extrahepatic bile ducts and biliary tract in males, and intrahepatic bile ducts, pan-creas, nasopharyngeal, lung, esophageal, leukemia, liver, gallbladder, extrahepatic bile ducts and biliary tract, ovary, and stomach in females. Cancers with lifetime health care expenditures exceeding US$50,000 to the National Health Insurance were as follows: leukemia, kidney, testis, renal pelvis and ureter in males, and renal pelvis and ureter, leukemia, breast, urinary bladder, kidney, ovary, and nasopharyngeal in females. All these impacts should be considered in health policy decisions.
Conclusion: The impacts of cancer in Taiwan are very large. Future studies must consider both quality of life and the entire impact from societal perspectives.
Keywords: health impacts, incidence rate, expected years of life lost, cancer prevention
Introduction
Cancer is one of the leading causes of death in the world1 although the momentum of this disease has slowed down slightly in some developed countries due to cancer prevention strategies and action programs, early diagnosis, and treatment.2 In many developing countries, however, the trends of a growing cancer burden continue and are projected to increase in the coming decades due to population growth and aging.3 In the USA, it is estimated that there were 15,500,000 cancer survivors in 2016, a number, which is expected to increase to over 20,000,000 by 2026.4 In Taiwan, there were 431,401 cancer survivors who were registered as having a catastrophic illness Correspondence: Jung-Der Wang
Department of Public Health, College of Medicine, National Cheng Kung University, No. 1, University Road, East District, Tainan 701, Taiwan
Tel +886 6 235 3535 ext 5600 Fax +886 6 235 9033 Email jdwang121@gmail.com
Journal name: Clinical Epidemiology Article Designation: ORIGINAL RESEARCH Year: 2018
Volume: 10
Running head verso: Wu et al
Running head recto: Lifetime risks, loss of life expectancy, and health care expenditures DOI: http://dx.doi.org/10.2147/CLEP.S155601
Video abstract
Point your SmartPhone at the code above. If you have a QR code reader the video abstract will appear. Or use:
http://youtu.be/sWAG0Jx7Pq4
Clinical Epidemiology downloaded from https://www.dovepress.com/ by 118.70.13.36 on 20-Aug-2020
For personal use only.
Dovepress Wu et al
and required health care in 2017, which is >1.5 times the number in 2003.5,6 The societal costs of cancer, including at least losses of life-years, functional disability, and health care expenditures, deserve quantification for a national cancer control plan.7
The current trend of quantification for the burden of cancer usually focuses on estimation of disability-adjusted life years, which is composed of years of life lost (YLL) and the years lost due to disability.8 The related studies have been quite useful to obtain a quick, ballpark view of the global burden, especially when cancer registries in many countries are still at their initial or developing stages. In countries where big data regarding long-term follow-up are accessible, direct estimation of the difference in life expectancy (LE) between patients with a specific disease or cancer and those of age- and sex-matched referents simulated from national life tables, or, expected years of life lost are feasible.9,10 Moreover, inter-linkages of these data files can provide opportunities for estimation of lifetime health care expenditures and the demand for long-term care.11–13 The development of these novel methods and big data linkages would make possible a more comprehensive estimation of the societal impact of a specific illness,7 including cancer.
In this study, we aim to inter-link 4 population-based data files of the Taiwan Cancer Registry, the Taiwan National Vital Statistics, the National Health Insurance (NHI), and the Taiwan Mortality Registry, to quantify lifetime risk (or, cumulative incidence rate from ages 0–79 [CIR0–79]), LE after diagnosis, expected years of life lost (EYLL), and lifetime health care expenditures reimbursed by NHI for 19 major cancers followed for 17 years. As a corollary product, we also estimate the cost-per-life-year for cancer care, a generalized cost-effectiveness assessment. The analysis would be useful for resource allocation of cancer control for health policy makers and/or to help in making a direct comparison between the prevention and treatment of different cancers.
Methods
The study was approved by the Institutional Review Board of National Cheng Kung University Hospital (IRB number: A-ER-103-203) before commencement.
Study population and datasets
A total of 831,314 patients with a pathologically validated cancer diagnosis when aged between 0 and 79 years old were abstracted and interlinked from 4 datasets, as summarized in Figure 1: the Taiwan Cancer Registry for 1998–2012, the Taiwan National Vital Statistics for 1998–2012, the
reimbursement database of the NHI system (1998–2013), and the Taiwan Mortality Registry (1998–2014). These datasets contain data on the patients’ demographics, date of diagnosis, cancer site, histology, national life tables, survival status, and health care expenditure covered by the NHI. Because cancer is a catastrophic illness, the Taiwan NHI covers all costs of outpatient clinic visits and hospitalization, including laboratory and imaging studies and prescription medicines. The patients’ personal information was protected by encrypting their identi-fication numbers. The 19 major cancers included liver (ICD-9-CM code: 155), lung (ICD-(ICD-9-CM code: 162), colorectal (ICD-9-CM code: 153–154, except for 153.5, 154.2–154.3, 154.8), oral (ICD-9-CM code: 140–141, 143–145), leuke-mia (ICD-O-3 morphology code: 9590–9729, 9731–9734, 9800–9805, 9820–9837, 9840–9930, 9940, 9950–9964, 9975, except for 9832–9834, 9870, 9931), stomach (ICD-9-CM code: 151.0–151.9), nasopharynx (ICD-9-CM code: 147.0–147.9), prostate (ICD-9-CM code: 185), urinary bladder (ICD-9-CM code: 188.0–188.9), kidney (ICD-9-CM code: 189.0), renal pelvis and ureter (ICD-9-CM code: 189.1–189.2), testis (ICD-9-CM code: 186.0–186.9), breast (ICD-9-CM code: 174.0–174.9), ovary (ICD-9-CM code: 183.0–183.9), cervix (ICD-9-CM code: 180.0–180.9), esophagus (ICD-9-CM code: 150.0–150.9), intrahepatic bile ducts (ICD-9-CM code: 155.1), gallbladder, extrahepatic bile ducts and biliary tract 9-CM code: 156.0–156.1, 156.9), and pancreas (ICD-9-CM code: 157.0–157.2, 157.8). The patients with cancer of the same organ system were grouped as a dynamic cancer cohort, indicating that they were diagnosed and recruited into the cohort at different calendar years during the period from 1998 to 2012, and we collected a total of 19 cancer cohorts.
Estimation of lifetime risk by CIR
With the age- and sex-specific number of new cases from the Taiwan Cancer Registry for every 3 consecutive calendar years as the numerators, and the corresponding population at risk from vital statistics as the denominators, we calculated the age- and sex-specific incidence rates (IR) and CIR for the 19 cancers. The CIR was calculated from ages 0 to 79 (CIR0–79) to estimate the lifetime risk of a specific cancer. The CIR0–79 was calculated from 1998 to 2012 to determine the trends in changes of lifetime risks. The formula is as follows:14
CIR0–79 = 1-exp(
-i
∑
(IRi) (∆ti)), where i=0–9, 10–19, …, 70–79where IRi is incidence rate for the i-th age group and ∆t
i=10 years of age range.
Clinical Epidemiology downloaded from https://www.dovepress.com/ by 118.70.13.36 on 20-Aug-2020
Dovepress Lifetime risks, loss of life expectancy, and health care expenditures
Figure 1 Flow diagram of the inclusion of subjects and their relevant information for estimations.
Notes: Bold type indicates original datasets, while with shading indicates results.
Abbreviations: CIR0–79, cumulative incidence rate, aged 0–79 years; EYLL, expected years of life lost; LE, life expectancy.
Survival functions of the age- and sex-matched referents for each cohort
Taiwan National Vital Statistics (national life tables), 1998–2012 Taiwan Cancer
Registry, 1998–2012 Taiwan Mortality
Registry, 1998–2014
Age-, sex-specific incidence rates, and CIR0–79 of 19 cancer cohorts
Survival functions of the 19 cancer cohorts
(n=831,314)
National Health Insurance reimbursement database,
1998–2013
Average monthly health care expenditures of
a patient, stratisfied by 0,1,…,K and over K months
prior to death, and adjusted for inflation to
the year of 2013
Survival ratio W(t) between the cohort and
the referents at time t
Logit transformation of W(t) by restricted cubic
splines model
Rolling extrapolation algorithm for lifetime survival function
Lifetime survival functions of 19 cancer cohorts Hazard functions of
the 19 cancer cohorts
Extrapolation for lifetime average monthly health care expenditures
LE for each of the 19 cancer cohorts
Lifetime health care expenditures of the 19
cohorts with different cancers
EYLL of the 19 cohorts with different cancers
LE of the age-, sex-matched referents
for each of the 19 cohorts
Estimation of lifetime survival function, LE
after diagnosis, and EYLL
Each cancer patient’s survival state was ascertained by link-age to the National Mortality Registry during 1998–2014.
The survival functions were produced via the Kaplan–Meier estimation method until the end of the follow-up. Further extrapolation of survival function was estimated using a rolling extrapolation algorithm, aided by the age- and
Clinical Epidemiology downloaded from https://www.dovepress.com/ by 118.70.13.36 on 20-Aug-2020
Dovepress Wu et al
sex-matched referents simulated from the National Vital Sta-tistics life tables.11 The EYLL was the difference between LEs of the cancer cohort and those of the age- and sex-matched referents (Supplementary materials). The iSQoL 2 software was used to compute these estimations.15
Estimation of average monthly cost and
its extrapolation to lifetime
Taiwan’s NHI categorizes every cancer patient with patho-logical proof as a case of catastrophic illness. The applica-tions must be validated by 2 physicians and can then be waived from all co-payments related to the specific cancer or illness. Therefore, our reimbursement data for cancer are very comprehensive and cover all health care expenditures related to the registered illness. We added all the reimburse-ment costs for every case and calculated the monthly average after diagnosis. The estimated lifetime cost was calculated by adding the product of monthly survival rates and monthly mean costs.11 The monthly mean costs beyond the maximum follow-up were estimated using the mean expenditures of the patients in a specific number of months prior to their death with a weighted average. The number could be decided according to the observed costs in the patients’ last months, where the weights were dependent on the extrapolated hazard of death. The estimates of lifetime costs were also calculated using the iSQoL2 package.
Results
The demographic data and burdens to health (CIR0–79, LE after diagnosis, and EYLL) and lifetime costs of the 19 cancers are summarized in Table 1. In males, the number of patients with liver cancer was the highest. Patients with prostate cancer showed the highest mean age at diagnosis (73.4±8.5 years). In females, the cohort of patients with breast cancer was the largest. Patients with cancers of the gallbladder, extrahepatic bile ducts, and biliary tract showed the highest mean age at diagnosis (68.9±12.5 years).
The lifetime risks of colorectal cancer and breast cancer were the highest, with CIR0–79 of 6.79% and 6.77%, among males and females, respectively, from 2010 to 2012. The high-est EYLL in males and females were esophageal cancer and cancer of intrahepatic bile ducts, with estimates of 19.1 and 17.1 years, respectively. Leukemia and cancer of renal pelvis and ureter represented the highest lifetime costs in males and females, with estimates of US$67,388 and US$78,586, respectively.
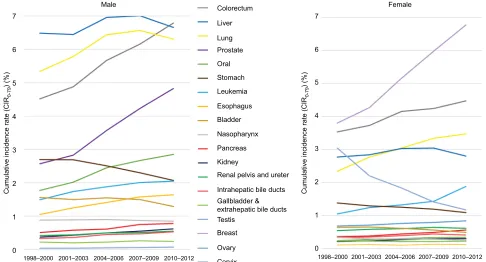
Figure 2 summarizes the dynamic changes in CIR0–79 for different cancers in both genders in the period from
1998 to 2012. In males, colorectal cancer surpassed can-cers of the liver and lung to become the highest CIR0–79 after 2010. While prostate cancer, oral cancer, esophageal cancer, and leukemia show an increasing trend, those of stomach and urinary bladder seem to have decreased over the last one and half decades. In addition, the trends of the other cancers appear flattened. In females, cancers of breast, colorectum, and lung show the highest CIR0–79 and a generally increasing trend. Among these, the lifetime risk of breast cancer rose very fast, from 3.80% to 6.77%, during the observation period. In contrast, cervical cancer dramatically decreased, from a CIR0–79 of 3.04% down to 1.17%. The trends of changes in CIR0–79 among other cancers in females were similar to those seen in males, except for lung cancer, which still exhibited a rising trend.
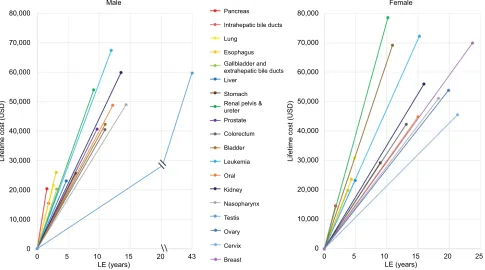
Figure 3 shows the EYLL and lifetime costs of the 19 cancers under consideration in Taiwan, stratified by gender. Leukemia seems to have the highest health burden and health care expenditures in both males and females, with an EYLL of >10 years and a lifetime cost of >US$50,000.
Figure 4 shows the cost-effectiveness of health care ser-vices for cancer. By dividing the lifetime cost by the LE of the cancer of a specific organ system, we were able to estimate the cost-per-life year survival. Testicular and cervical cancers had the least steep slopes in males and females, respectively. In contrast, pancreas cancer had the steepest slopes in both males and females.
Discussion
This study links 4 national datasets to quantify the likelihood and major consequences of common cancers with a lifetime horizon. Namely, we estimated the lifetime risk, EYLL, and health care expenditures for 19 major cancers in Taiwan. The following arguments corroborate the accuracy of these estimates: first, the 4 datasets are well validated. Take the National Cancer Registry as an example. Taiwan established this system in 1979 and required all hospitals to report.16,17 All diagnoses require pathological evidence, with the excep-tion of liver cancer, and all cancers had to be validated by at least 2 qualified experts after implementation by the NHI in 1995 (Supplementary materials).17,18 Second, we followed 19 groups of patients with different cancer sites from 1998 to 2014, or, a total of 17 years. Therefore, we covered the survival function and reimbursement data up to the LE of most of such cancers. A long-term follow-up would be helpful to decrease the effects of individual fluctuations. Third, the rolling extrapolation method extended the survival month by month until the survival rate was <0.1%, which usually leads
Clinical Epidemiology downloaded from https://www.dovepress.com/ by 118.70.13.36 on 20-Aug-2020
Dovepress Lifetime risks, loss of life expectancy, and health care expenditures
to a more accurate estimation of the lifetime survival function than that obtained using the usual parametric method.11,15 Although our method may be more accurate than other cur-rently available parametric methods, the estimation must be conducted again when there is any new development in treatment technology.
CIR0–79 can be regarded as the lifetime risk of disease occurrence.19 We found that colorectal and breast cancers had the highest CIR0–79 in males and females (6.79% and 6.77%, respectively), and their trends over the last 15 years still appeared to be rising at the end of 2012. Moreover, the trends in the IR of breast cancer and cervical cancer appear to be consistent with those in the USA and Korea.20,21 Through cancer screening, patients can detect their cancers
at earlier stages, even at a premalignant stage, which would likely save life-years and health care costs, as demonstrated for colorectal and cervical cancers.22–24 Thus, Taiwan has launched a national campaign for screening of 4 cancers since 2010.25 The cervical cancer screening rate has been consistently high (over 50% from 2004 to 2013), which may have contributed to the lowering of the CIR0–79 values seen in Figure 2.26 However, the screening rates of breast and colorec-tal cancers began to rise after 2010 but were still below 40% before 2012 and appeared to have no direct linear correlation with their individual CIR0–79 values (Figures S1 and S2).27,28 More research is needed to explore the related risk factors and determine the optimal age of beginning such screenings for a more cost-effective national strategy.
Table 1 Comparison of frequency distributions and expected lifetime impacts for 19 cancers in Taiwan stratified by gender: LE after
diagnosis, EYLL, lifetime cost, CIR0–79, and 95% CI
Cancer N Age (years)
(mean ± SD)
CIR0–79a
(%)
LE after diagnosis (95% CI, years)
EYLL (95% CI) (years)
Lifetime cost
(95% CI, ×103 USD)
Male
Liver 99,659 60.9±13.4 6.66 4.7 (4.6–4.8) 16.0 (15.8–16.1) 23.0 (22.4–23.6)
Lung 82,820 68.9±12.0 6.31 2.6 (2.5–2.7) 12.6 (12.5–12.7) 21.4 (21.1–21.8)
Colorectum 80,425 65.7±13.3 6.79 10.9 (10.7–11.1) 6.5 (6.3–6.7) 40.4 (39.7–41.2)
Oral 44,089 52.4±11.8 2.85 12.2 (11.7–12.6) 15.0 (14.5–15.4) 48.7 (47.3–50.1)
Esophagus 22,504 59.1±12.4 1.64 3.1 (2.9–3.3) 19.1 (18.8–19.3) 25.9 (25.3–26.6)
Leukemia 30,823 56.7±21.8 2.05 12.0 (11.3–12.6) 13.0 (12.4–13.6) 67.4 (64.5–70.2)
Stomach 34,726 68.2±13.3 2.07 6.2 (6–6.4) 9.5 (9.3–9.7) 25.6 (24.9–26.3)
Nasopharynx 16,758 50.3±13.1 0.85 14.3 (13.5–15.2) 14.4 (13.6–15.3) 48.9 (45.8–52.0)
Pancreas 9,057 68.9±12.5 0.78 1.6 (1–2.1) 15.2 (15–15.4) 20.3 (10.6–30.1)
Prostate 46,107 73.4±8.5 4.83 9.7 (9.5–9.8) 2.4 (2.3–2.6) 40.6 (39.6–41.5)
Intrahepatic bile ducts 5,994 68.4±12.3 0.53 1.9 (1.5–2.3) 16.0 (15.8–16.3) 15.4 (14.5–16.3)
Bladder 20,360 68.5±12.9 1.29 11.0 (10.6–11.4) 4.6 (4.2–4.9) 42.3 (40.8–43.7)
Kidney 7,510 60.7±15.9 0.62 13.5 (12.5–14.5) 7.7 (6.7–8.7) 59.9 (54.5–65.2)
Renal pelvis and ureter 6,425 66.4±12.3 0.55 9.1 (8.6–9.7) 7.7 (7.2–8.3) 54.0 (50.4–57.6) Gallbladder and extrahepatic bile ducts 3,096 67.3±13.9 0.24 3.2 (2.3–4) 12.3 (11.8–12.8) 20.3 (19.2–21.4)
Testis 2,089 29.8±14.8 0.07 42.7 (39.4–45.9) 4.2 (1.0–7.5) 59.7 (50.9–68.4)
Female
Lung 43,569 65.9±13.3 3.47 4.9 (4.6–5.2) 15.1 (14.8–15.4) 30.9 (29.6–32.3)
Breast 101,550 52.4±12.2 6.77 23.7 (23.2–24.1) 7.5 (7.1–8.0) 69.9 (67.3–72.4)
Liver 37,328 66.9±12.4 2.80 4.9 (4.8–5.1) 14.0 (13.8–14.1) 23.3 (22.5–24.0)
Colorectum 60,075 65.1±14.2 4.47 13.1 (12.9–13.3) 7.6 (7.4–7.9) 42.3 (41.4–43.3)
Leukemia 22,322 55.4±21.2 1.88 15.2 (14.4–16) 14.1 (13.3–14.9) 72.2 (68.4–76.0)
Stomach 18,752 65.3±15.3 1.09 9.0 (8.5–9.4) 11.7 (11.2–12.1) 29.3 (27.8–30.7)
Ovary 14,494 51.1±15.7 0.84 19.9 (19–20.7) 12.7 (11.8–13.6) 53.9 (50.7–57.0)
Pancreas 6,350 68.1±13.1 0.56 1.8 (1.5–2.1) 16.5 (16.1–16.9) 14.6 (13.9–15.3)
Cervix 31,613 56.2±14.6 1.17 21.3 (20.9–21.7) 6.4 (6.0–6.8) 45.6 (44.2–46.9)
Intrahepatic bile ducts 5,219 67.0±12.1 0.41 1.8 (1.6–2.1) 17.1 (16.8–17.4) 14.5 (13.6–15.4) Renal pelvis and ureter 7,547 68.7±11.2 0.61 10.2 (9.6–10.8) 7.3 (6.7–7.9) 78.6 (72.4–84.7)
Nasopharynx 5,591 49.7±13.7 0.25 18.3 (16.1–20.4) 15.2 (13.0–17.4) 51.1 (46.1–56.0)
Bladder 8,034 68.4±12.7 0.49 10.9 (10.4–11.4) 7.0 (6.5–7.5) 69.2 (64.3–74.0)
Oral 4,692 60.0±15.3 0.34 15.0 (13.6–16.4) 10.0 (8.6–11.3) 44.8 (40.1–49.6)
Gallbladder and extrahepatic bile ducts 3,002 68.9±12.5 0.22 3.8 (3.2–4.3) 13.8 (13.1–14.4) 19.9 (18.5–21.2)
Kidney 3,956 60.1±16.9 0.30 15.9 (14.3–17.5) 9.0 (7.4–10.6) 56 (47.8–64.1)
Esophagus 1,755 67.3±13.9 0.12 4.3 (3.5–5.2) 14.7 (13.7–15.7) 23.6 (21.2–26.1)
Notes:aCIR
0–79 in 2010–2012.
Abbreviations: CIR0–79, cumulative incidence rate, aged 0–79; EYLL, expected years of life lost; LE, life expectancy.
Clinical Epidemiology downloaded from https://www.dovepress.com/ by 118.70.13.36 on 20-Aug-2020
Dovepress Wu et al
Figure 2 CIR0–79 along a calendar period.
Abbreviations: CIR0–79, cumulative incidence rate, aged 0–79 years.
Liver Lung Colorectum
Male Female
Oral Stomach Prostate
Esophagus Bladder Leukemia
Pancreas Kidney Nasopharynx
Intrahepatic bile ducts Gallbladder & extrahepatic bile ducts
Breast Testis
Ovary Cervix
2010–2012 2007–2009
2004–2006 2001–2003
1998–2000 2001–20032004–20062007–2009 2010–2012
Cumulative incidence rate (CIR
0-79
) (%
)
1998–2000
0 1 2 3 4 5 6 7
Cumulative incidence rate (CIR
0-79
) (%
)
0 1 2 3 4 5 6 7
Renal pelvis and ureter
Figure 3 EYLL and lifetime costs of the 19 major cancers in Taiwan, specified by gender.
Abbreviation: EYLL, expected years of life lost.
0
Lifetime cost (USD
)
10,000 20,000 30,000 40,000 50,000 60,000 70,000 90,000
80,000
0
0 2 4 6 8 10
EYLL (years)12 14 16 18 20
0 2 4 6 8 10
EYLL (years)
Male Female
12 14 16 18 20
Lifetime cost (USD
)
10,000 20,000 30,000 40,000 50,000 60,000 70,000 90,000
80,000
Lung
Lung Liver Liver
Stomach Stomach
Renal pelvis and ureter
Renal pelvis and ureter
Colorectum Colorectum
Bladder
Bladder
Leukemia Leukemia
Oral Oral
Kidney Kidney
Testis
Prostate
Nasopharynx
Nasopharynx Ovary
Cervix Breast
Esophagus Esophagus
Gallbladder and extrahepatic bile
ducts Gallbladder and
extrahepatic bile duct
Intrahepatic bile ducts Intrahepatic
bile ducts Pancreas
Pancreas
Clinical Epidemiology downloaded from https://www.dovepress.com/ by 118.70.13.36 on 20-Aug-2020
Dovepress Lifetime risks, loss of life expectancy, and health care expenditures
Considering the lifetime health burden, our results showed that esophageal and intrahepatic bile duct cancers had the highest EYLL in both males and females, with estimates of 19.1 and 17.1 years, respectively. We found leukemia in males and cancer of the renal pelvis and ureter in females represented the highest lifetime costs, with estimates of US$ 67,388 and US$ 78,586, respectively (Table 1). In this study, however, we proposed considering both EYLL and lifetime costs together (Figure 3) as the potential savings that success-ful prevention of a cancer case could achieve. We found that the occurrence of one of following cancers would result in a loss of >10 years of EYLL plus expected health care costs of >US$ 50,000: leukemia in males and leukemia, nasopha-ryngeal, and ovary cancers in females.
In fact, the estimated EYLL at different stages of cancer could be used for adjustment of lead time bias on the evalu-ation of effectiveness of cancer screening.29 Moreover, while Figure 3 reminds us that there is a lifelong horizon for quan-tification of benefits of prevention, Figure 4 calls for attention to cost-effectiveness, or, cost-per-life year of management/ treatment of 19 different cancers along the same metric. Future studies are warranted to multiply the dynamic changes in quality of life (QOL), human capital loss, and disability with lifetime survival function for a more comprehensive evaluation of cost-effectiveness from a societal perspective.
Figure 4 Generalized cost-effectiveness assessment with cost-per-life-year as the basic unit for treating major cancers in Taiwan.
Notes: By plotting the LE after diagnosis against lifetime health expenditures, this figure shows that the steeper the slope, the more expensive the treatment.
Abbreviation: LE, life expectancy.
Lung
Liver
Stomach Renal pelvis & ureter Prostate Colorectum
Bladder
Leukemia
Oral
Kidney
Nasopharynx
Testis
Ovary
Cervix
Breast
0
0 5 10
LE (years)
Lifetime cost (USD
)
Lifetime cost (USD
)
15 20 25
10,000 20,000 30,000 40,000 50,000 60,000 70,000 80,000
0
0 5 10
LE (years)
Female Male
15 20 43
10,000 20,000 30,000 40,000 50,000 60,000 70,000 80,000
Esophagus Gallbladder and extrahepatic bile ducts Intrahepatic bile ducts Pancreas
Our study has the following limitations: First, the lifetime cost after cancer diagnosis in this study was only estimated based on reimbursement data from Taiwan’s NHI, which does not include patients’ out-of-pocket payments but includes non-cancer-related health expenditures. The lifetime health expenditures of patients with a long LE after diagnosis (e.g., >10 years) might be overestimated, whereas the estimation of lifetime health expenditures of patients with a short LE after diagnosis, say, <3–5 years, would be a lower bound. Second, this work has no data related to losses from a societal perspec-tive, such as losses due to reduced productivity and consump-tion unrelated to health, as well as the other costs associated with long-term care.7 We have thus heavily underestimated the potential savings for the successful prevention of a single case of cancer. Future studies are thus warranted to attempt estimation of these societal costs. Third, we did not consider patients’ QOL in the quantification of health. Since most cancers will lead to impaired QOL throughout the patient’s lifetime, we have obviously underestimated the savings with regard to improved QOL due to prevention. As such, the results of this study can only be considered as a lower bound, and the cost-per-life year cannot be directly compared with cost-per-quality-adjusted life year. Although decision makers may conduct sensitivity analyses by putting different overall utility values for QOL, comprehensive assessments of QOL
Clinical Epidemiology downloaded from https://www.dovepress.com/ by 118.70.13.36 on 20-Aug-2020
Dovepress Wu et al
for cancers of different organ systems at different stages of cancer care are still needed for resources allocation. We may also consider quantification of loss-of quality-adjusted LE as an outcome measurement to adjust for any biased comparison related to different age distributions. Fourth, although this study followed all the cancer cohorts for 17 years, we had to rely on extrapolation to obtain the lifetime survival functions for those with a longer LE, such as patients with leukemia, cancer of the breast, cervix, and testis (Table 1). We have shown in our previous studies that our estimates would be generally more accurate than those obtained with the usual parametric method by assuming a constant excess hazard after the end of follow-up.30 Recently, we have adopted a rolling extrapolation method that would probably be the most accurate for censored claim data when estimating lifetime costs.11
Conclusion
Because big data is now becoming more accessible, we can seize the opportunity to quantify the losses of life-years and health care costs in order to improve the fairness and efficiency of cancer control efforts. Given the limited data and underesti-mation of social costs, we have shown that the overall impacts of cancer in terms of lifetime risks, LE, EYLL, and reimbursement costs on NHI are tremendous. In other words, cancer control strategies should consider prevention first. Future studies are warranted to stratify the health care expenditures according to cancer relatedness and item cost for different technologies as well as to take into account impaired QOL, 5-year age strata, different calendar periods, pathological stages, and various other factors based on societal perspectives, including at least functional disability and productivity loss, for a more compre-hensive assessment of the cost-effectiveness of cancer control.
Acknowledgments
This work was funded by the “Multidisciplinary Health Cloud Research Program: Technology Development and Application of Big Health Data” of Academia Sinica (Taiwan) and the Ministry of Science and Technology (MOST105-2314-B-006-032, MOST106-2627-M-006-015), for which the data was obtained from the Health and Welfare Data Science Center (H104123).
Disclosure
The authors report no conflicts of interest in this work.
References
1. Torre LA, Siegel RL, Ward EM, Jemal A. Global cancer incidence and
mortality rates and trends–an update. Cancer Epidemiol Biomarkers
Prev. 2016;25:16–27.
2. International Agency For Research on Cancer. World Cancer Report
2014. Stewart BW, Wild C, editors. Lyon: International Agency for
Research on Cancer, 2014.
3. Bray F, Jemal A, Grey N, Ferlay J, Forman D. Global cancer transitions according to the Human Development Index (2008–2030): a
population-based study.Lancet Oncol. 2012;13:790–801.
4. Bluethmann SM, Mariotto AB, Rowland JH. Anticipating the “Silver Tsunami”: Prevalence Trajectories and Comorbidity Burden Among
Older Cancer Survivors in the United States. Cancer Epidemiol
Bio-markers Prev. 2016;25(7):1029–1036.
5. National Health Insurance Administration (Taiwan). Tables of effective
number of Catastrophic Illness Card in National Health Insurance by
2017. Available from:
https://dep.mohw.gov.tw/DOS/cp-3621-38058-113.html. Accessed November 1, 2017.
6. National Health Insurance Administration (Taiwan). Tables of effective
number of Catastrophic Illness Card in National Health Insurance by
2003. Available from:
https://dep.mohw.gov.tw/DOS/cp-2916-32950-113.html. Accessed November 1, 2017
7. Sanders GD, Neumann PJ, Basu A, et al. Recommendations for conduct, methodological practices, and reporting of cost-effectiveness analyses:
second panel on cost-effectiveness in health and medicine.JAMA.
2016;316:1093–103.
8. Murray CJ, Lopez AD. The Global Burden of Disease. Cambridge:
Harvard School of Public Health for the World Health Organization and the World Bank; 1996.
9. Liu PH, Wang JD, Keating NL. Expected years of life lost for six potentially
preventable cancers in the United States.Prev Med. 2013;56:309–313.
10. Burnet NG, Jefferies SJ, Benson RJ, Hunt DP, Treasure FP. Years of life lost (YLL) from cancer is an important measure of population
burden–and should be considered when allocating research funds.Br
J Cancer. 2005;92:241–245.
11. Hwang JS, Hu TH, Lee LJH, Wang JD. Estimating lifetime medical
costs from censored claims data.Health Econ. 2017;26:e332–e344.
12. Hung MC, Hsieh CL, Hwang JS, Jeng JS, Wang JD. Estimation of the long-term care needs of stroke patients by integrating functional
dis-ability and survival. PLoS One. 2013;8:e75605.
13. Hung MC, Sung JM, Chang YT, Hwang JS, Wang JD. Estimation of physical functional disabilities and long-term care needs for patients
under maintenance hemodialysis. Med Care. 2014;52:63–70.
14. Day N. A new measure of age standardized incidence, the cumulative
rate. In: Waterhouse JW, Muir CS, Correa P, Powell J, editors. Cancer
Incidence in Five Continents. Lyon: International Agency for Research on Cancer (IARC Scientific Publications No. 15); 1976:443–445. 15. iSQoL2 Package for Windows [webpage on the Internet]. 2017 [cited
2017 9/10]. Available from: http://sites.stat.sinica.edu.tw/isqol/.
16. Taiwan Cancer Registry. Introduction of Taiwan Cancer Registry. 2017;
Available from: http://tcr.cph.ntu.edu.tw/main.php?Page=A2. Accessed
September 27, 2017.
17. Chiang C-J, You S-L, Chen C-J, Yang Y-W, Lo W-C, Lai M-S. Quality assessment and improvement of nationwide cancer registration system
in Taiwan: a review. Jpn J Clin Oncol. 2015;45:291–296.
18. National Health Research Institute. Guidelines of quality assurance
of cancer diagnosis and treatment (Q & A). Available from: http:// tcog.nhri.org.tw/accredit/Q&A_basic2.html. Accessed November 1, 2017.
19. Rothman KJ. Modern Epidemiology. 3rd ed. Greenland S, Lash TL,
editors. Philadelphia: Wolters Kluwer Health/Lippincott Williams & Wilkins; 2008.
20. Jung K-W, Won Y-J, Kong H-J, Oh C-M, Lee DH, Lee JS. Cancer Sta-tistics in Korea: incidence, mortality, survival, and prevalence in 2011. Cancer Res Treatm. 2014;46:109–123.
21. Siegel RL, Miller KD, Jemal A. Cancer Statistics, 2017. CA Cancer J
Clin. 2017;67:7–30.
22. Lansdorp-Vogelaar I, Knudsen AB, Brenner H. Cost-effectiveness of
colorectal cancer screening–an overview. Best Pract Res Clin
Gastro-enterol. 2010;24:439–449.
Clinical Epidemiology downloaded from https://www.dovepress.com/ by 118.70.13.36 on 20-Aug-2020
Dovepress Lifetime risks, loss of life expectancy, and health care expenditures
23. Hung MC, Liu MT, Cheng YM, Wang JD. Estimation of savings of life-years and cost from early detection of cervical cancer: a
follow-up study using nationwide databases for the period 2002–2009. BMC
Cancer. 2014;14:505.
24. Chen PC, Lee JC, Wang JD. Estimation of life-year loss and lifetime
costs for different stages of colon adenocarcinoma in Taiwan. PLoS
One. 2015;10:e0133755.
25. Health Promotion Administration of Ministry of Health and Welfare. Taiwan Breast Cancer, Oral Cancer, and Colorectal Cancer Screening Programs. 2016. Available from: https://www.hpa.gov.tw/Pages/Detail.
aspx?nodeid=1051&pid=5957. Accessed September 27, 2017.
26. Health Promotion Administration of Ministry of Health and Welfare
in Taiwan. Screening rates of women aged 30-69 receiving cervical
cancer screening in recent three years (from 2000-2013). Avail-able from: https://data.gov.tw/dataset/14673. Accessed February 28, 2018.
27. Health Promotion Administration of Ministry of Health and Welfare. Screening rates of people aged 50-69 receiving colon cancer screen- ing in recent two years (2004-2013). Available from: http://210.71. 254.151/dataset/143070675847/resource/39ef04e8-6fdc-4902-87ec-03afb6a56007. Accessed February 28, 2018.
28. Health Promotion Administration of Ministry of Health and Welfare
in Taiwan. Screening rates of women aged 45-69 receiving breast
can-cer screening in recent two years (from 2004-2013). Available from: http://210.71.254.151/dataset/143070580718/resource/c3a2c286-bc26-447f-8049-444fe696878a. Accessed February 28, 2018.
29. Yang SC, Lai WW, Lin CC, et al. Cost-effectiveness of
implement-ing computed tomography screenimplement-ing for lung cancer in Taiwan. Lung
Cancer. 2017;108:183–191.
30. Fang CT, Chang YY, Hsu HM, et al. Life expectancy of patients with newly-diagnosed HIV infection in the era of highly active antiretroviral
therapy. Q J Med. 2007;100:97–105.
Clinical Epidemiology downloaded from https://www.dovepress.com/ by 118.70.13.36 on 20-Aug-2020
Dovepress Wu et al
Supplementary materials
Rolling extrapolation method for
estimating survival
The rolling extrapolation algorithm proposed by Hwang et al1 for estimating survival function beyond the maximum follow-up consists of 4 main steps. First, the survival times of referents are generated to match the patients in the index cohort with onset age and sex using national vital statistics. The estimated survival functions of the reference population and the index cohort are denoted as S(t|ref) for t = 0,1,..,L
and S(t|ind) for t = 0,1,..,F, respectively, where F is the maximum follow-up (months) and L is the maximum lifespan (months) since onset age. Second, the ratio of survival func-tions between the index group and reference population is calculated, and denoted as W(t), which is usually between 0 and 1. The logit transformation of the relative survival W(t) would straighten the curve of logit W(t) after a certain time point if the patients had excess constant hazard over time. The logit W(t) is often smooth and approximately linear within each short time interval even when the assumption of excess constant hazard is not satisfied. Third, with the linearity property of the logit transformed curve, a restricted cubic splines model is fitted, which is linear beyond the last knot, to the observed curve of logit W(t). The first 1-month ahead prediction of logit ˆW(F+ 1) should be quite accu-rate and can be treated as a new “observed value”. In the fourth step of rolling extrapolation, the data of logit ˆW(t) is updated by dropping the first logit W(t) and adding the new “observed value,” and a restricted cubic splines model is re-fitted to the updated data for predicting the next logit
ˆ
W(t) step-by-step until t= L. The survival function of the index cohort beyond the maximum follow-up can be obtained by:
ˆ ˆ ˆ
ˆ
( | ) ( | ) ( )
( )
S t S t W t
W t t
ind ref exp logit
exp logit
= ×
( )
+
( )
1 for ==F+1,F+2, , .… L
ˆ ˆ ˆ
ˆ
( | ) ( | ) ( )
( )
S t S t W t
W t t
ind ref exp logit
exp logit
= ×
( )
+
( )
1 for ==F+1,F+2, , .… L
The area between the complete survival curves of the ref-erence population and index cohort is an estimate of the EYLL. The standard error and 95% confidence interval of the expected years of life lost estimate can be obtained using bootstrap methods. An R package iSQoL2 is available at http://www.stat.sinica.edu.tw/isqol for users to implement the calculation in practice.
Brief introduction of the 4 mandated
datasets (the Taiwan Cancer Registry,
the Taiwan National Vital Statistics, the
reimbursement database of the National
Health Insurance [NHI] system, and the
Taiwan Mortality Registry) used in this
study
1. Taiwan Cancer Registry: The cancer diagnosis must be first validated by 2 qualified physicians, which are recorded into the registry by 2 trained health care profes-sionals who have been certified to perform such a task. The data cannot be formally stored in the dataset until all logical errors are corrected and/or debugged.2,3 2. Taiwan National Vital Statistics: It was first established
in 1905. After several decades of improving the quality, it has provided highly accurate and reliable demographic information and vital statistics for population resided in Taiwan. The algorithm of national vital statistics was updated in 1998 to more precisely match every detail of the population structure.4
3. The reimbursement database of the NHI system: The reimbursement database of the NHI system covers >99.9% of people in Taiwan. Moreover, the committee of NHI reimbursement reviews the data and debugs unreasonable expenditure every 3 months (https://nhird.nhri.org.tw/en/).5 4. Taiwan Mortality Registry: This is based on records
from death certificates, which must be issued by doctors, although some are provided by prosecutors, especially those who committed suicide or died of injuries. The family and related institutions will be imposed with a fine if they do not report a death.6
In summary, the quality of these 4 datasets are highly reli-able and valid.
References
1. Hwang JS, Hu TH, Lee LJ, Wang JD. Estimating lifetime medical costs
from censored claims data. Health Econ. 2017;26:e332–e344.
2. Chiang CJ, You SL, Chen CJ, Yang YW, Lo WC, Lai MS. Quality assess-ment and improveassess-ment of nationwide cancer registration system in
Taiwan: a review. Jpn J Clin Oncol. 2015;45:291–296.
3. Taiwan Cancer Registry. Introduction of Taiwan Cancer Registry. Available from: http://tcr.cph.ntu.edu.tw/main.php?Page=A2. Accessed September 27, 2017.
4. Ministry of Interior, Republic of China. Demographic Facts, 1968–1982.
Taipei: Ministry of Interior, 1969–1983.
5. National Health Insurance Administration, Ministry of Health and
Welfare, Taiwan, R.O.C. National Health Insurance Annual Report
2014–2015; 2014.
6. Ministry of Welfare and Health. Handbook of cause of death dataset.
Available from: http//dep.mohw.gov.tw/DOS/lp-3147-113.html. Accessed February 28, 2018.
Clinical Epidemiology downloaded from https://www.dovepress.com/ by 118.70.13.36 on 20-Aug-2020
Dovepress
Clinical Epidemiology
Publish your work in this journal
Submit your manuscript here: https://www.dovepress.com/clinical-epidemiology-journal
Clinical Epidemiology is an international, peer-reviewed, open access, online journal focusing on disease and drug epidemiology, identifica-tion of risk factors and screening procedures to develop optimal pre-ventative initiatives and programs. Specific topics include: diagnosis, prognosis, treatment, screening, prevention, risk factor modification,
systematic reviews, risk and safety of medical interventions, epidemiol-ogy and biostatistical methods, and evaluation of guidelines, translational medicine, health policies and economic evaluations. The manuscript management system is completely online and includes a very quick and fair peer-review system, which is all easy to use.
Dove
press
Lifetime risks, loss of life expectancy, and health care expenditures
Figure S1 Comparison of the trends of cancer screening rate and cumulative incidence rate of colorectal cancer every 3 years.
Abbreviations: M-CSR, cancer screening rate of male; M-CIR50–69, cumulative incidence rate for males aged 50–69 years; F-CSR, cancer screening rate of female; F-CIR50–69, cumulative incidence rate for females aged 50–69 years.
2007–2009 2010–2012 2004–2006
Colorectal cancer
Rate (%
)
F-CIR50–69
F-CSR M-CIR50–69
M-CSR 2001–2003 0
5 10 15 20 25 30 40
35
Figure S2 Comparison of the trends of cancer screening rate and cumulative incidence rate of breast cancer along calendar periods.
Abbreviation: CIR45–69, cumulative incidence rate for women aged 45–69 years.
2007–2009 2010–2012 2004–2006
Cancer screening rate Female breast cancer
Rate (%
)
CIR45–69
2001–2003 0
5 10 15 20 25 30 35
Clinical Epidemiology downloaded from https://www.dovepress.com/ by 118.70.13.36 on 20-Aug-2020