132 | P a g e
DATA ACQUISITION PROCESSING SYSTEM BASED
ON PXI
Mini Rai
1, S.R.Kane
2, Preet Jain
31,3
Shri Vaishnav Institute of Technology & Science, Indore (India)
2
Indus Synchrotrons Utilization Division, Raja Ramanna Centre for Advance Technology,
Indore-452013, (India)
ABSTRACT
An architecture model for fast data acquisition and processing system is developed in LabVIEW. The system
monitors and controls the various components of Reflectivity Beamline of Indus-2. The system is based on PXI
(PCI extension for instrumentation) Express and runs under real time operating system.
Index Terms: PXI Express, Real-time, LabVIEW RT, Shared Variable.
I INTRODUCTION
Indus-2 [1] is a 2.5GeV, 300mA synchrotron radiation source which is now working at 150mA current. There
are 27 proposed beamline out of which 10 are functional. The upcoming beamline is Reflectivity Beamline.
X-Ray Reflectivity [2] is a tool for the investigation of surfaces and interfaces in thin films and multi-layers. The
beamline consists of Vacuum Gauges to measure the vacuum inside the beamline, Gate Valves to regulate the
vacuum within the beamline, K-type thermocouple to measure the temperature of the beamline, flow sensors and
flow switches to measure waterflow and airflow.
Beamline control system is a data acquisition and control system. The system facilitates the beamline user to
remotely control and monitor the various beamline components from a centralized zone i.e. from the
experimental hutch for acquiring and storing experimental data. Interlocking scheme has been implemented for
the beamline operation. The main function of Interlock is to protect the beamline from the vacuum degradation
and ensuring the safe operation of the components.
II OBJECTIVE
The primary motive for developing the system is to control various components, to provide the fail-safe
operation of the beamline. The system controls the component like Gauges, Gate Valve, flow switches and flow
sensors with a user authentication. A proper interlocking scheme has been employed in the system for the
fail-safe operation of the Beamline. The data acquisition software has been developed in LabVIEW which provide
user friendly control interface. Different modules of LabVIEW have been used to develop the required system.
PXI has been used as a DAQ interface. The motivation behind the rapid adoption of PXI platform are its high
embedded controller and its synchronization mechanism that helps in architecting fast and precise data
III PXI Express
PXI Express [3][4] has ended standard data acquisition platform in industrial market. PXI Express platform uses
high speed PCI Express data communication bus. By incorporating the high speed PCI Express [5] data bus
technology into the PXI platform, drastically expand the data bandwidth. PXI/PXI Express provide the
compatibility with all major and significant operating system which offer a great deal of software that can run
on PXI/PXI Express. PXI Express is completely compatible with PCI, PCI Express, Compact PCI and PXI slots.
PXI is a synchronous bus. PXI utilizes different timing and synchronization features [6].
3.1 Using PXI for Real Time System
Real time system is often utilized for superior performance system obliging deterministic handling. A real-time
system is required when it is expected to run the program more reliably for long time and run continuously
without intrusion.
Real time processing is possible by exploiting powerful tool of Laboratory Virtual Instrumentation Engineering
Workbench Real Time (LabVIEW RT) combined with a high performance Pentium based PXI Express
embedded controller. LabVIEW RT satisfies the need of deterministic real time performance utilizing
LabVIEW.
Real time (RT) system [7] comprises of hardware and software components as shown in Fig.1. The hardware
components include host machine and RT target. The software components comprise LabVIEW with RT
module, RT engine and LabVIEW VI.
Figure 1: Real Time System Components
The host machine is the computer where the VIs is created. LabVIEW is graphical programming language with
the help of which VIs is developed. RT module provides LabVIEW the capabilities to run the VIs on the RT
target. RT engine run the VIs deployed to the RT target from the LabVIEW on the PC. It run on the real time
134 | P a g e
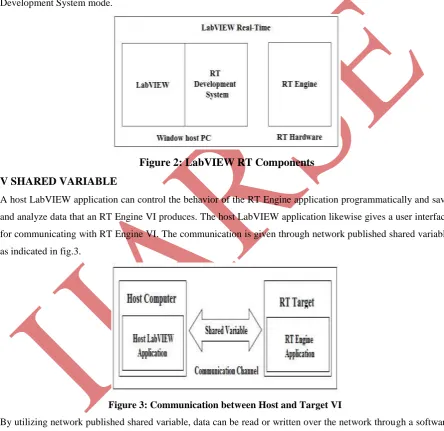
IV LabVIEW RT
LabVIEW RT consists of three components: LabVIEW, RT Development System and the RT Engine as shown
in fig.2 [8].
The RT Development System is a window application that runs on the host PC. It can be utilized to download
the VIs to the RT Engine. LabVIEW and RT Development System are the different form of the labview.exe.
LabVIEW RT extends the capability of LabVIEW to run on real time processor. When labview.exe is executed
on host PC, then it is in the LabVIEW mode. When labview.exe is executed on RT hardware, then it is in the RT
Development System mode.
Figure 2: LabVIEW RT Components
V SHARED VARIABLE
A host LabVIEW application can control the behavior of the RT Engine application programmatically and save
and analyze data that an RT Engine VI produces. The host LabVIEW application likewise gives a user interface
for communicating with RT Engine VI. The communication is given through network published shared variable
as indicated in fig.3.
Figure 3: Communication between Host and Target VI
By utilizing network published shared variable, data can be read or written over the network through a software
component called shared variable engine SVE. It manages shared variable updates using NI-PSP. NI PSP (NI
Publish and subscribe Protocol) is a networking protocol implemented for the transportation of network
VI GUI DEVELOPMENT
The Graphical User Interface (GUI) is developed using LabVIEW to monitor and control the different
instrument such as Gate Valve (GV), cold cathode gauges, K-type thermocouple and flow switches. Based on
various condition mentioned in Table 1, beam ready signal will be generated. GUI comprises three screens:
Status, Login and Control Screen.
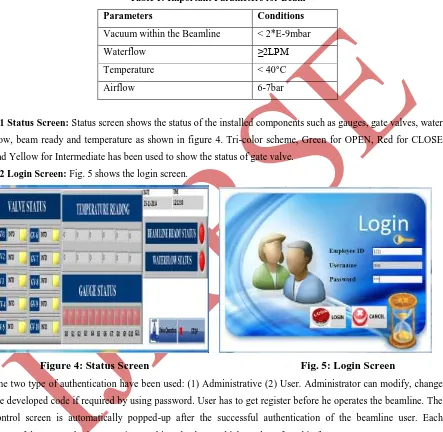
Table 1: Important Parameters for Beam
Parameters Conditions
Vacuum within the Beamline < 2*E-9mbar
Waterflow ≥2LPM
Temperature < 40°C
Airflow 6-7bar
6.1 Status Screen: Status screen shows the status of the installed components such as gauges, gate valves, water
flow, beam ready and temperature as shown in figure 4. Tri-color scheme, Green for OPEN, Red for CLOSE
and Yellow for Intermediate has been used to show the status of gate valve.
6.2 Login Screen: Fig. 5 shows the login screen.
Figure 4: Status Screen Fig. 5: Login Screen
The two type of authentication have been used: (1) Administrative (2) User. Administrator can modify, change
the developed code if required by using password. User has to get register before he operates the beamline. The
control screen is automatically popped-up after the successful authentication of the beamline user. Each
successful access to login screen is stored in a database, which can be referred in future.
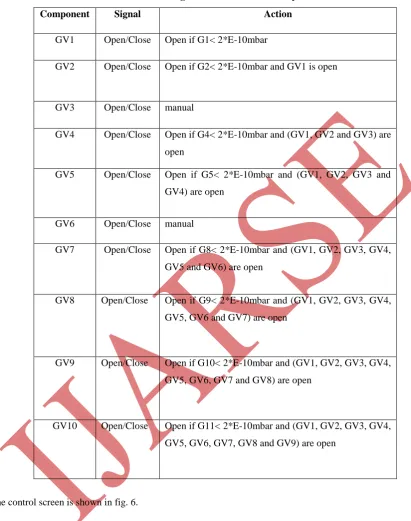
6.3 Control Screen: Gate valves (GV) can be opened only in a sequential fashion. An intermediate valve
opening is forbidden. This sequential valve opening scheme is assured in the code via a logical coding, in which
136 | P a g e
Table 2: Interlocking Scheme for Reflectivity Beamline
Component Signal Action
GV1 Open/Close Open if G1< 2*E-10mbar
GV2 Open/Close Open if G2< 2*E-10mbar and GV1 is open
GV3 Open/Close manual
GV4 Open/Close Open if G4< 2*E-10mbar and (GV1, GV2 and GV3) are
open
GV5 Open/Close Open if G5< 2*E-10mbar and (GV1, GV2, GV3 and
GV4) are open
GV6 Open/Close manual
GV7 Open/Close Open if G8< 2*E-10mbar and (GV1, GV2, GV3, GV4,
GV5 and GV6) are open
GV8 Open/Close Open if G9< 2*E-10mbar and (GV1, GV2, GV3, GV4,
GV5, GV6 and GV7) are open
GV9 Open/Close Open if G10< 2*E-10mbar and (GV1, GV2, GV3, GV4,
GV5, GV6, GV7 and GV8) are open
GV10 Open/Close Open if G11< 2*E-10mbar and (GV1, GV2, GV3, GV4,
GV5, GV6, GV7, GV8 and GV9) are open
The control screen is shown in fig. 6.
6.4 Alarm: Network-published shared variables hosted on Real-Time target are used to read temperature data.
Comparing those values to limits specified by the user or as mentioned in table 1, and displays a warning if those
Fig. 6: Control Screen Figure 7: Alarming Facility
6.5 Data Logger: Data logging means recording the critical parameters over a period of time. In our case
vacuum and temperature are the most critical signals. Enabling logging in shared variable property, the user will
be able to know the historical data of the beamline parameters from the database (MS Access) file of the shared
variable on the real time environment. The trend of temperature and vacuum is displayed in the graph as shown
in figure 8 and 9.
Figure 8: Temperature in the Beamline Figure 9: Vacuum in the Beamline
VII CONCLUSION
The Data Acquisition System has successfully been developed using LabVIEW. The developed system has been
tested at Reflectivity Beamline of Indus-2. All interlocks have also been tested and are working accordingly.
Fault analysis such as observation of status and values of various beamline components can be performed via
138 | P a g e
REFERENCES
[1]Indus-2, http://www.cat.gov.in/technology/accel/indus2.html
[2] Reflectivity beamline, http://www.cat.gov.in/technology/accel/srul/beamlines/softxray.html
[3] Adam Ullrich, National Instruments PXI Express for Real-Time Control and High Performance Acquisition
(April 2007).
[4] David Nosbusch, Architecting High- Throughput PXI Systems, National Instruments Corporation.
[5]PCI Express – An Overview of the PCI Express Standard, National Instruments Whitepaper, August 2009.
[6]“PXI Express Specification Tutorial” National Instruments, 10 Mar 2008
http://zone.ni.com/devzone/cda/tut/p/id/2876
[7]LabVIEW Real-Time Module User Manual, 1999–2003 National Instruments Corporation.