Available Online atwww.ijcsmc.com
International Journal of Computer Science and Mobile Computing
A Monthly Journal of Computer Science and Information Technology
ISSN 2320–088X
IJCSMC, Vol. 3, Issue. 1, January 2014, pg.173 – 180
RESEARCH ARTICLE
Data Design and Analysis for Survey
System Based on Statistical Functionality
Wessam Abbas Hamed
1, Atheer Yousif Oudah
2, Sarmad Kadhim Dhiab
31
Computer Department, Thi-Qar University, Iraq
2
Computer Department, Thi-Qar University, Iraq
3
Computer Department, Thi-Qar University, Iraq
1
[email protected]; 2 [email protected]; 3 [email protected]
Abstract-Nowadays, and after the rapid development of information systems make the researchers
look for an easy and automated way to collection and analysis of a data in a questionnaire that enables researchers to obtain the results quickly instead of using manual way. Questionnaires are used in a wide range of settings to gather information about the views and behavior of individuals to inform people about the specific issues. Feedbacks of the questionnaires are used by the researchesr to find an accurate result with supporting of statistical analysis functionalities. The main invention summary concerns with analyzing the online questionnaireis the easy way that enables researchers to get the results quickly instead of manual way. Finding a result using java tools enable the researcher to find an accurate result for statistical analysis. In addition, there is a strong relationship between questionnair eand research, questionnaireis are the most important phase in research. Consequently, this study focuses on thedevelopment of the online questionnaire to facilitate and support the researcher’s tasks by using Online Questionnaire System to reduce loss of papers, time and effort. Moreover, the system has been tested based on usability and flexibility.
Key words: JAVA; MY SQL; JSP; SPSS; OQS
i. INTRODUCTION
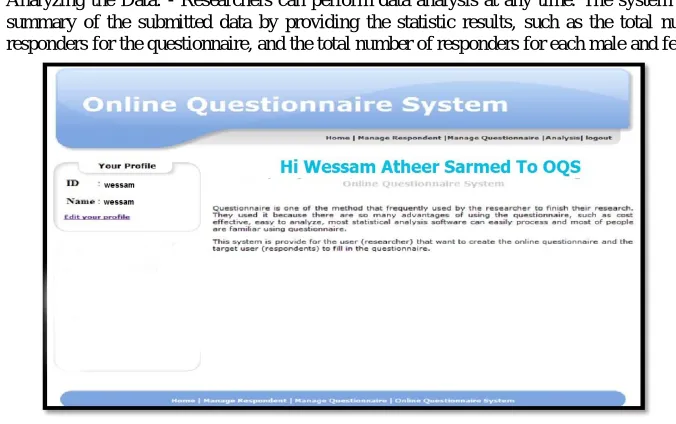
A questionnaire is a research instrument consists of a series of questions and their prompts in purpose of gathering information and opinions of the respondents (Chaudhuri, Ghosh, & Mukhopadhyay, 2009). Sir Francis Galton was the first who invented the questionnaire. Questionnaire could also mean the method of collecting data for descriptive research by using a list of questions; often mailed.Questionnaire is one of the ways that are often used by the researchers to finish their research. The researchers use the questionaire because there are many advantages of using it, such as cost-effective, easy to analyze and for most of the process of statistical analysis software and most people aware of using the questionnaire.
questionnaire, and analyze the questionnaire easily. In addition, they can manage the questionnaire, the respondent to the questionnaire, and present the result of the questionnaire.
ii. RESEARCH PROBLEM
Currently, the online survey system establishes the questionnaire and distributes it to the largest number of participants. However, result of the questionnaire lacks the support provided by the analyzing functionality. Analyzing functionality refers to the statistical analysis tools, which are a collection of methods that used to process large amounts of data and reports. Additionally, the overall trends and the performance of each question are analyzed using the equations from statistical analysis. Using the statistical analysis tools, researchers will be able to get the results of the research. Normally, the analyzing functionality is done manually or could be achieved by separate software applications such as the Statistical Package for Social Sciences (SPSS), and so it is difficult to achieve the desired results. Therefore, the online survey system will make it possible to provide analysis functionality and this is really useful and improves the implementation of the survey system. This research contributes to the development of the traditional questionnaire and the processes that are applied to analyze the questionnaire to be online questionnaire system.
iii. OBJECTIVE
The main objective of this research is to design and develop an on line Questionnaire System (OQS). In order to achieve this goal, the followings objectives are achieved:
Identify the components of OQS.
Define the analysis functionalities required by the researcher such as mean, correlation and standard deviation.
Design and develop the prototype of the OQS. Evaluate the usefulness of the OQS.
iv. RELATED WORK
The web is a highly programmable environment that allows mass customization through the immediate deployment of large and diverse applications to millions of global user (Conallen, 1999). The web is growing quickly but actually it is a chaos to large extent, for example, there is the scientific research output and web sites of supporting parties, etc, and there is the core of many of the bad quality or worst or something with mention to every page on the web has range from a little personalities to few hundred thousand which contains the truth and untruth, knowledge on nonsense propaganda. A questionnaire is a list of questions designed to collect specific information, or it can be defined as a group of printed questions used to collect information from the people who answer them, and those people are usually called respondents (Newsted, 1988).The World Wide Web (WWW) has become a common communication for several different types of information. It is important for most people around world because they rely on this method to retrieve information which they need at times, as is the case in using online survey to collect information about specific topics. New surveys technologies are trying to test the feasibility and usability of using computer networks, particularly in the WWW. Also there is a review of computer assisted survey techniques, and the comparisons among different survey methods are on way to appear (Chou, Chang, & Jiang, 2000). With advent of handy Internet building tools, online questionnaire is becoming a promising alternative to mail-based surveys and traditional paper-work regarding data collection and analysis for questionnaires (Singh, Taneja & Mangalaraj, 2009).
A- Advantages and Limitations of Using the Online Surveys
The advantages of computer-network surveys are:-
The delivery of network surveys is usually faster than that of mail surveys (Oppermann, 1995).
The cost of delivery is less than using regular mail specially in the presence system on the Internet (Anderson & Gansneder, 1995).
Network surveys allow more flexibility for the respond of the user (Chou, 1997).
It is the best surveys environmentally because the network does not use the paper or at least they use less paper (Saltzman, 1993).
Web surveys provide a convenient way of communication between participants and researchers (Fisher, Margolis, & Resnick, 1996).
However, there are many limitations of online surveys, such as the researcher must know that all persons that intended to pass the questionnaire must be able to access the internet. Furthermore, the computer browser may be over loaded with the information study and the system may crash down. The respondents to the questionnaire may lack the internet experience and this may affect negatively and threaten all responses (Evans & Mathur, 2005). In addition, Respondents may have difficulty in reading or writing of the questionnaire poorly designed, and this may lead to incomplete analysis in the perfect way (Granello & Wheaton, 2004). Also, there is a cost of time to download and open e-mail and effort to establish and maintain an Internet connection (Cho & Larose, 1999).
v. THE PROPOSED RESEARCH
One of the most important parts in any research is the data analysis.
Fig 1: Tentative design of OQS.
Statistical application such as SPSS is used for data analysis. The data that are collected using questionnaire is very important and forms the first step in any research.
A- State of the application
Using data analysis, the researcher will be able to get the results and find his/her research. This study contributes to develop the traditional questionnaire and the processes that are applied to analyze the questionnaire to be online questionnaire. The prototype developed using Java language and has been designed using UML. In addition, SPSS equations (correlation, mean, standard deviation, T-Test and regression, linear regression) are used in the data analysis. Furthermore, many functions had been added into the system as inserting questions automatically, which means that the researcher may upload a file and the system will provide automatic detection of the questions. As well as this system provides the online tools and forms those contain the participant’s information on the system. Also, the system enables researchers to send more than one e-mail that contains username and password to their participants.
B- Analysis
researchers, the online questionnaire have become a popular way of collecting data and get results. Secondly, the design of an online questionnaire often has an effect on the quality of the gathered data.
C- Invention/Innovation of online questionnaire
1- The smart GUI easy to access.
2- There were various programming tools which have been used in this invitation. 3- Scalability is available in this invitation for both researcher and applicant. 4- Authentication security has been used in this research.
5- Reducing the time for statistical analysis that the researcher needed.
6- The main innovativeness in this research is to gain cost opportunity in the private sector. 7- The project idea offers an openness to add more options for the future work.
D- Steps to use online questionnaire application
1- Start: get login by the researcher and applicant. 2- Open online questionnaire GUI for the researcher. 3- The authenticated researcher adds section number. 4- The researcher adds questions.
5- The researcher sends email to all applicants.
6- Applicant gets response for online questionnaire on identified period. 7- The researcher makes analysis and fined the statistical result. 8- End.
vi. IMPLEMENTATION AND RESULTS
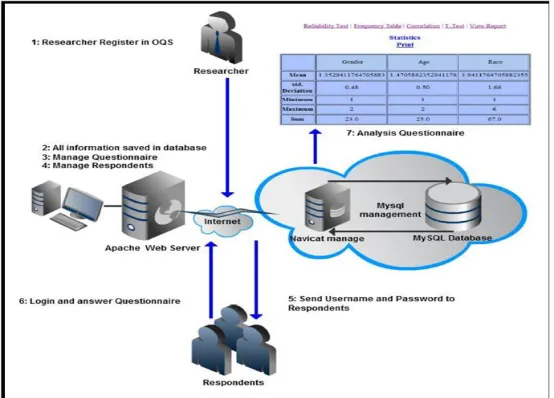
The prototype of OQS is developed using Java application programs and MySQL Community Server. The work of Java with MySQL has provided an appropriate environment work for this system.
Fig 2: OQS Architecture
.
easily (Navicat, 2011). The Apache HTTP Server Project is another program that we need to connect with the internet. The Apache is an effort to develop and maintain an open-source HTTP server for modern operating systems. The goal of this project is to provide a secure, efficient and extensible server that provides HTTP services in sync with the current HTTP standards (Apache, 2011). Dreamweaver program is used to design interfaces of the OQS website. Table 1 illustrates requirements necessary software and server used in OQS. By interacting with the prototype, users can get a better idea of their information requirements. The application approved by the users can be used as a template to create the final system.
TABLE 1
TOOLS USED IN DEVELOPING THE QQS SYSTEM.
A- Programming the Questionnaire
The programming of the questionnaire has included a collection of codes that are built and assembled to form OQS system. This is done by bringing together the following four components:
Designing a Questionnaire: - To create a questionnaire, we must take into account the researcher, who will create questionnaire in a simple and easy manner to manage the questionnaire and how to select an answer type, which could be Text Box, Radio Buttons, and Checkboxes.
Publishing the Questionnaire: - Once a questionnaire is completed, researchers can publish it by sending the survey link out via email. Responders on the Internet will then be able to view the questionnaire via a browser.
Submitting the Data: - this is achieved by clicking a relevant link on a browser, responders can view the questionnaire. If the respondents complete the information the questionnaire maintains, they can click the “Submit” button. Then, data will be delivered via the Internet to the web server and inserted to the database.
Analyzing the Data: - Researchers can perform data analysis at any time. The system provides summary of the submitted data by providing the statistic results, such as the total number of responders for the questionnaire, and the total number of responders for each male and female.
Fig4: Frequency Table Page. B- Statistical Analysis Functions
Statistical analysis refers to a collection of methods used to process large amounts of data and report overall trends (Cowan, 1998). Statistical analysis is particularly useful when dealing with surveys that have huge data and to provide appropriate reports to give a final conclusion about the information and the data collected. In OQS we have many functions for analyzing the questionnaire. These functions are Reliability Test, Statistics, Frequency Table, Correlation and T-Test, for each analysis function, there were special equations which can be illustrated as follows (Peck & Devore, 2010):-
Reliability Test: - To find the alpha value for any question we must apply the following equation:
Where k represents the answer options for each question, we can calculate the value of SP2 from the following equation: -
As S2 can be calculated from the following equation:
Statistics: - In these functions, we have many function types.
Mean: mean equation is given by:
Standard deviation: the standard deviation is given by:
Minimum represents the smallest value in the data.
Maximum represents the largest value in the data.
Sum is representing the total value in the data.
Fig 5: Statistical Table Page.
uses tally marks to record and show the number of times they occur (For example if we have 10 respondents in questionnaire, what is percentage male and female?).
Correlation: - To find correlation we used the following equation:
Where X, Y are the variables that we need to find the correlation for them.
: mean to x. y: mean to y.
N: number of participation. SX: Standard deviation to x.
SY: Standard deviation to y.
The correlation has been used as a measurement of the correlation among variables X and Y (from -1 to 1), if the correlation is close to 1, that is means that there is a strong correlation between the variables, in other hand, if the correlation was far from 1, this means that there is weak correlation between them, and if the correlation = 1, then this case is called optimal correlation.
T-Test: - TO find T-Test, we use the equation:
Where:
N: represent number of questions in each section.
X: represent the first value that we need to test in each section.
Σ x: represent summation of x variable for each section.
Y: represent the second value that we need to test in each section.
vii. CONCLUSION
Online questionnaire system was implemented to provide an efficient and effective system to help researchers to create his/her questionnaire online. The system also enables researchers to analyze their questionnaires in a high level, without spend a lot of time and effort, because the system has been built based on SPSS features. So, by increasing internet usage, a popular way for online questionnaire to collect the information will be created. Online questionnaires has been used in a wide range to gather the information about individual issues. This design depends on many factors, each of these factors has an impact on quality of the gathered data. Of these factors are availablity of the question formats, administration of the questionnaire which influence on the response rate and the analysis of these issues. Because there is no way to analyze data for an online questionnaire and since the available software uses many application such as SPSS, so this researc discuses the way to design a system for analyzing the online questionnaire data by using Java tools and analysis concepts.
REFERENCES
Apache. (2011). Retrieved Sep 21, 2011, from Apache: http://httpd.apache.org/
Anderson, S. E., & Gansneder, B. M. (1995). Using electronic mail surveys and computer monitored data for studying computer-mediated communication systems. Social
Science Computer Review , 33 - 46.
Chaudhuri, D., Ghosh, S. K., & Mukhopadhyay, A. R. (2009). A Discursion on the Issues of Questionnaire Design for Sample Survey. International Referred Research Journal, 60-62.
Cho, H., & Larose, R. (1999). Privacy Issues in Internet Surveys. Social Science Computer Review, 421-434.
Chou, C., Chang, Y.-F., & Jiang, Y.-Y. (2000). The development of an online adaptive questionnaire for health education in Taiwan. Computers & Education, 209-222. Conallen, J. (1999). Modeling Web application architectures with UML. Communications of
the ACM , 63 - 70.
Cowan, G. (1998). Statistical data analysis . London: Clarendon Press.
Evans, J. R., & Mathur, A. (2005). The value of online surveys. Internet Research, 195 - 219. Fisher, B., Margolis, M., & Resnick, D. (1996). Braking ground on the virtual frontier:
surveying civic life on the Internet. American Sociologist, 11 - 29.
Newsted, P. R. (1988). Factors affecting opinion and knowledge: responses to paper and online presentation of questionnaires. In J. M. Carey, Human factors in management information systems (pp. 149 - 164). Norwood , New Jersey, USA: Ablex Publishing Corp.
Nakaike, T., Kondoh, G., Nakamura, H., Kitayama, F., & Hirose, S. (2004). JSP splitting for improving execution performance. IEEE, 117 - 126.
Navicat. (2011). Retrieved Sep 27, 2011, from Premium overview:
http://www.navicat.de/en/products/navicat_premium/premium_overview.html
Oppermann, M. (1995). E-mail surveys: potentials and pitfalls. Marketing Res, 28 - 33. Parker, L. (1992). Collecting data the e-mail way. Training and Development, 52-54. Peck, R., & Devore, J. L. (2010). Statistics the Exploration and Analysis of Data. London:
Cengage Learning.
Saltzman, A. (1993). Improving response rates in disk-by-mail surveys. Marketing Research, 32-39.